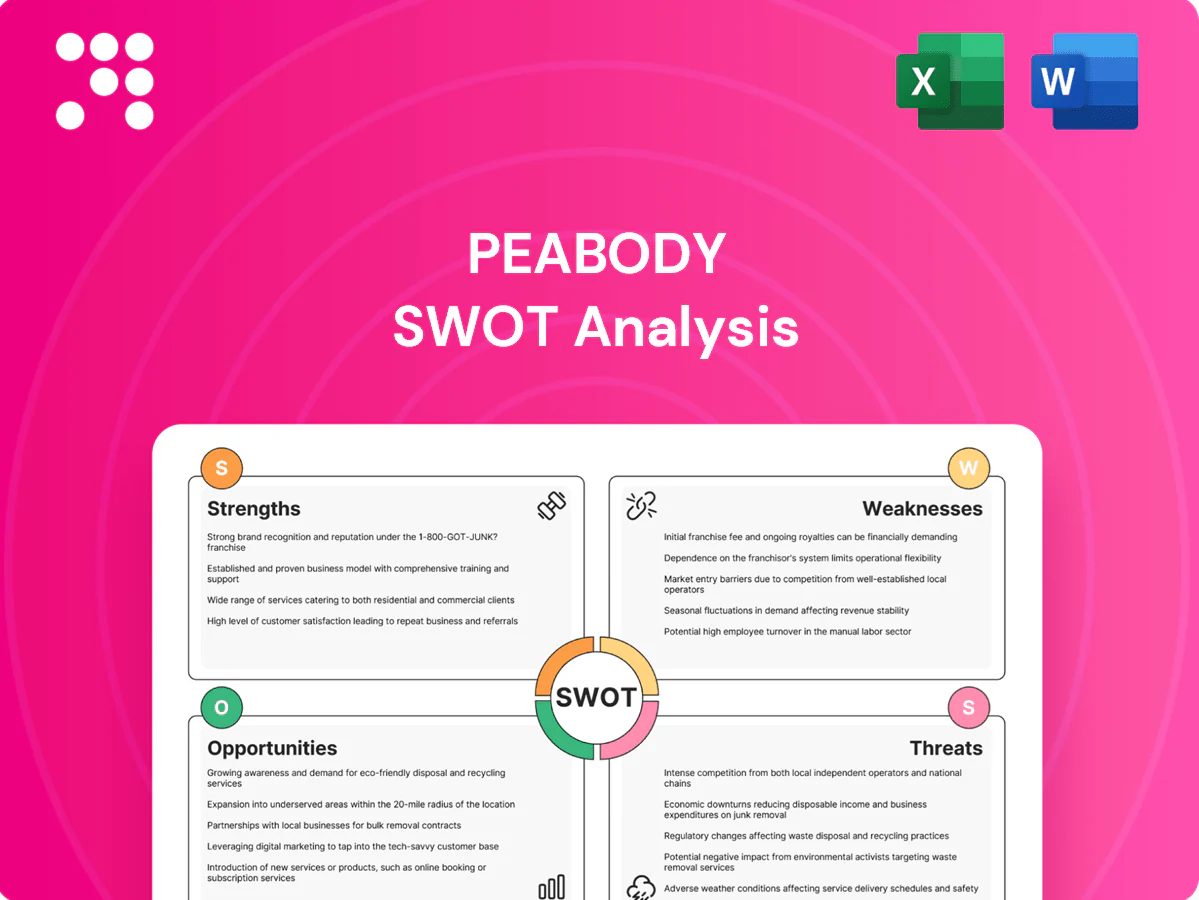
Peabody SWOT Analysis

Go Beyond the Preview—Access the Full Strategic Report
Peabody's SWOT reveals how its coal legacy, asset scale, and global reach contrast with regulatory pressure and shifting energy demand. The preview highlights strategic strengths and key vulnerabilities. Want deeper analysis and actionable recommendations? Purchase the full SWOT for a downloadable, editable report to guide investment and strategy decisions.
Strengths

Diversified coal portfolio
Peabody's mix of seaborne thermal, seaborne metallurgical and Powder River Basin coal reduces single-market dependence by spanning both thermal power and steelmaking markets. The Powder River Basin historically supplies roughly 40% of US coal, anchoring Peabody's U.S. volume while Australian operations access Asia's seaborne demand. Geographic spread across the U.S. and Australia helps moderate local disruptions and supports revenue resilience amid commodity volatility.
Scale and operational expertise
As one of the largest private-sector coal companies, Peabody leverages scale—with global operations and roughly $6 billion in annual net sales reported in 2023—to drive lower unit costs and supply reliability. Deep mining, logistics and marketing expertise underpins tight cost management and contract fulfillment for utilities and steelmakers, whose long relationships boost contract stability. Scale also enables continued investment in safety and efficiency programs.

Established export infrastructure
Peabody’s Australian export footprint provides direct access to Asia-Pacific, which takes roughly 75% of global seaborne thermal coal imports (about 1.2 billion tonnes/year), sharpening exposure to regional demand.
Export optionality lets Peabody arbitrate between higher international prices and domestic contracts, while integrated port and rail linkages enable bulk shipments that materially lower per-ton logistics versus road alternatives.
Such specialized rail-port infrastructure requires capital outlays and regulatory consents that are difficult and costly for smaller rivals to replicate, sustaining a competitive moat.

Long-term customer contracts
As of 2024 Peabody’s multi-year supply agreements with utilities and industrials stabilize cash flows by locking volumes and reducing exposure to volatile spot coal prices; contract structures typically include indexed pricing to regional benchmarks and firm volume commitments. This predictable demand supports production planning and capital allocation, lowering downside risk during market downturns.
- Indexed pricing to regional benchmarks
- Firm volume commitments
- Reduced spot exposure
- Supports capex and planning
Resource base and reserves
Peabody’s large, low-sulfur Powder River Basin reserves and metallurgical coal holdings underpin long mine lives and sustained production planning; the company reported roughly 129 million tons sold in 2023, supporting competitive cash costs per ton and markup in metallurgical markets. Strong reserve positions enhance buyer leverage and pricing optionality.
- Reserves: long mine lives
- Quality: low-sulfur PRB, met coal
- Cost: competitive cash costs
- Commercial: improved negotiating leverage
Coal scale 129 Mt, $6B, Asia access, PRB stabilize cash
Peabody’s scale and diversified mix—seaborne thermal, metallurgical and Powder River Basin (PRB) volumes—reduces single-market risk and supports lower unit costs; the company reported roughly $6B net sales and 129 Mt sold in 2023. Australian exports give direct access to Asia, which takes ~75% of seaborne thermal imports (~1.2 Bt/year), while PRB supplies ~40% of US coal. Long-term contracts and integrated rail/port assets stabilize cash flows and raise barriers to entry.
| Metric | Value |
|---|---|
| Net sales (2023) | $6.0B |
| Tons sold (2023) | 129 Mt |
| PRB share of US coal | ~40% |
| Asia share of seaborne thermal imports | ~75% (≈1.2 Bt/yr) |
What is included in the product
 Detailed Word Document
Provides a concise SWOT overview of Peabody, outlining its core strengths, operational weaknesses, market opportunities, and external threats shaping strategic decisions.

 Customizable Excel Spreadsheet
Provides a concise Peabody SWOT matrix for rapid identification of coal-market risks and strategic opportunities. Ideal for executives needing a high-level, editable snapshot to align strategy and stakeholder communications.
Weaknesses

High commodity price exposure
Peabody faces high exposure to cyclical, volatile coal prices that directly pressure margins and cash flow, with contract repricing and spot sales able to swing quarterly results. Limited hedging liquidity versus oil and gas markets leaves the company more exposed to sudden price moves. This volatility complicates budgeting and makes leverage management and capital allocation more uncertain.
Carbon-intensive product
Peabody's carbon-intensive coal products emit roughly twice the CO2 per MWh of natural gas, inviting regulatory, investor and customer pressure. US coal-fired generation fell to about 19% of electricity in 2023 (EIA), as utilities shift to gas and renewables, reducing demand. Reputation and ESG screening have constrained capital and partnership options, complicating project approvals and financing.

Operational and safety risks
Mining operations expose Peabody to safety, geotechnical and weather risks that in 2024 contributed to production volatility—Peabody sold about 84 million tons of coal in FY2024 and reported revenues near $3.9 billion—while disruptions can lift unit costs by 10–20% and cut volumes, regulatory compliance raises operating complexity and costs, and any incident risks fines, operational downtime and reputational damage.

Legacy liabilities and reclamation
Legacy reclamation and environmental liabilities consume cash and constrain capital allocation; Peabody reported approximately $554 million of asset retirement obligations at year-end 2024, and annual reclamation spending runs into the tens of millions. Bonding requirements often tighten in downturns, and cost overruns in closure activities can quickly erode margins, increasing balance-sheet rigidity.
- Reclamation ARO ~ $554M (2024)
- Annual reclamation spending: tens of millions
- Tighter bonding in downturns
- Closure cost overruns compress margins
Customer concentration
Utility buyers can account for a substantial share of Peabody's regional volumes, concentrating revenue and exposing the company to pricing pressure when large contracts come up for renewal as alternative fuels and imports grow.
Loss of a major utility customer would materially reduce utilization and cash flow, while concentration heightens negotiating risk and limits pricing leverage.
- High regional volume dependence on utilities
- Contract renewals pressure pricing
- Major-customer loss = material utilization drop
- Elevated negotiating and cash-flow risk
Coal firm: volatile prices, margin squeeze, ARO $554M, FY24 sales 84 Mt
Peabody is exposed to volatile coal prices that drive margin swings and uncertain cash flow; FY2024 sales ~84 Mt and revenue ~$3.9B. Coal demand is pressured—US coal generation ~19% of electricity in 2023—raising ESG and financing constraints. Operational risks and reclamation liabilities (ARO ~$554M) increase costs and limit capital flexibility.
| Metric | Value |
|---|---|
| FY2024 sales | ~84 Mt |
| FY2024 revenue | ~$3.9B |
| Asset retirement obligations | ~$554M (2024) |
| US coal share (2023) | ~19% |
What You See Is What You Get
Peabody SWOT Analysis
This is the actual SWOT analysis document you’ll receive upon purchase—no surprises, just professional quality. The preview below is taken directly from the full SWOT report you'll get, covering Peabody's strengths, weaknesses, opportunities, and threats. Purchase unlocks the full, editable version with detailed findings and strategic implications. The complete file is available immediately after checkout.

Go Beyond the Preview—Access the Full Strategic Report
Peabody's SWOT reveals how its coal legacy, asset scale, and global reach contrast with regulatory pressure and shifting energy demand. The preview highlights strategic strengths and key vulnerabilities. Want deeper analysis and actionable recommendations? Purchase the full SWOT for a downloadable, editable report to guide investment and strategy decisions.
Strengths
Diversified coal portfolio
Peabody's mix of seaborne thermal, seaborne metallurgical and Powder River Basin coal reduces single-market dependence by spanning both thermal power and steelmaking markets. The Powder River Basin historically supplies roughly 40% of US coal, anchoring Peabody's U.S. volume while Australian operations access Asia's seaborne demand. Geographic spread across the U.S. and Australia helps moderate local disruptions and supports revenue resilience amid commodity volatility.
Scale and operational expertise
As one of the largest private-sector coal companies, Peabody leverages scale—with global operations and roughly $6 billion in annual net sales reported in 2023—to drive lower unit costs and supply reliability. Deep mining, logistics and marketing expertise underpins tight cost management and contract fulfillment for utilities and steelmakers, whose long relationships boost contract stability. Scale also enables continued investment in safety and efficiency programs.
Established export infrastructure
Peabody’s Australian export footprint provides direct access to Asia-Pacific, which takes roughly 75% of global seaborne thermal coal imports (about 1.2 billion tonnes/year), sharpening exposure to regional demand.
Export optionality lets Peabody arbitrate between higher international prices and domestic contracts, while integrated port and rail linkages enable bulk shipments that materially lower per-ton logistics versus road alternatives.
Such specialized rail-port infrastructure requires capital outlays and regulatory consents that are difficult and costly for smaller rivals to replicate, sustaining a competitive moat.
Long-term customer contracts
As of 2024 Peabody’s multi-year supply agreements with utilities and industrials stabilize cash flows by locking volumes and reducing exposure to volatile spot coal prices; contract structures typically include indexed pricing to regional benchmarks and firm volume commitments. This predictable demand supports production planning and capital allocation, lowering downside risk during market downturns.
- Indexed pricing to regional benchmarks
- Firm volume commitments
- Reduced spot exposure
- Supports capex and planning
Resource base and reserves
Peabody’s large, low-sulfur Powder River Basin reserves and metallurgical coal holdings underpin long mine lives and sustained production planning; the company reported roughly 129 million tons sold in 2023, supporting competitive cash costs per ton and markup in metallurgical markets. Strong reserve positions enhance buyer leverage and pricing optionality.
- Reserves: long mine lives
- Quality: low-sulfur PRB, met coal
- Cost: competitive cash costs
- Commercial: improved negotiating leverage
Coal scale 129 Mt, $6B, Asia access, PRB stabilize cash
Peabody’s scale and diversified mix—seaborne thermal, metallurgical and Powder River Basin (PRB) volumes—reduces single-market risk and supports lower unit costs; the company reported roughly $6B net sales and 129 Mt sold in 2023. Australian exports give direct access to Asia, which takes ~75% of seaborne thermal imports (~1.2 Bt/year), while PRB supplies ~40% of US coal. Long-term contracts and integrated rail/port assets stabilize cash flows and raise barriers to entry.
| Metric | Value |
|---|---|
| Net sales (2023) | $6.0B |
| Tons sold (2023) | 129 Mt |
| PRB share of US coal | ~40% |
| Asia share of seaborne thermal imports | ~75% (≈1.2 Bt/yr) |
What is included in the product
Detailed Word Document
Provides a concise SWOT overview of Peabody, outlining its core strengths, operational weaknesses, market opportunities, and external threats shaping strategic decisions.
Customizable Excel Spreadsheet
Provides a concise Peabody SWOT matrix for rapid identification of coal-market risks and strategic opportunities. Ideal for executives needing a high-level, editable snapshot to align strategy and stakeholder communications.
Weaknesses
High commodity price exposure
Peabody faces high exposure to cyclical, volatile coal prices that directly pressure margins and cash flow, with contract repricing and spot sales able to swing quarterly results. Limited hedging liquidity versus oil and gas markets leaves the company more exposed to sudden price moves. This volatility complicates budgeting and makes leverage management and capital allocation more uncertain.
Carbon-intensive product
Peabody's carbon-intensive coal products emit roughly twice the CO2 per MWh of natural gas, inviting regulatory, investor and customer pressure. US coal-fired generation fell to about 19% of electricity in 2023 (EIA), as utilities shift to gas and renewables, reducing demand. Reputation and ESG screening have constrained capital and partnership options, complicating project approvals and financing.
Operational and safety risks
Mining operations expose Peabody to safety, geotechnical and weather risks that in 2024 contributed to production volatility—Peabody sold about 84 million tons of coal in FY2024 and reported revenues near $3.9 billion—while disruptions can lift unit costs by 10–20% and cut volumes, regulatory compliance raises operating complexity and costs, and any incident risks fines, operational downtime and reputational damage.
Legacy liabilities and reclamation
Legacy reclamation and environmental liabilities consume cash and constrain capital allocation; Peabody reported approximately $554 million of asset retirement obligations at year-end 2024, and annual reclamation spending runs into the tens of millions. Bonding requirements often tighten in downturns, and cost overruns in closure activities can quickly erode margins, increasing balance-sheet rigidity.
- Reclamation ARO ~ $554M (2024)
- Annual reclamation spending: tens of millions
- Tighter bonding in downturns
- Closure cost overruns compress margins
Customer concentration
Utility buyers can account for a substantial share of Peabody's regional volumes, concentrating revenue and exposing the company to pricing pressure when large contracts come up for renewal as alternative fuels and imports grow.
Loss of a major utility customer would materially reduce utilization and cash flow, while concentration heightens negotiating risk and limits pricing leverage.
- High regional volume dependence on utilities
- Contract renewals pressure pricing
- Major-customer loss = material utilization drop
- Elevated negotiating and cash-flow risk
Coal firm: volatile prices, margin squeeze, ARO $554M, FY24 sales 84 Mt
Peabody is exposed to volatile coal prices that drive margin swings and uncertain cash flow; FY2024 sales ~84 Mt and revenue ~$3.9B. Coal demand is pressured—US coal generation ~19% of electricity in 2023—raising ESG and financing constraints. Operational risks and reclamation liabilities (ARO ~$554M) increase costs and limit capital flexibility.
| Metric | Value |
|---|---|
| FY2024 sales | ~84 Mt |
| FY2024 revenue | ~$3.9B |
| Asset retirement obligations | ~$554M (2024) |
| US coal share (2023) | ~19% |
What You See Is What You Get
Peabody SWOT Analysis
This is the actual SWOT analysis document you’ll receive upon purchase—no surprises, just professional quality. The preview below is taken directly from the full SWOT report you'll get, covering Peabody's strengths, weaknesses, opportunities, and threats. Purchase unlocks the full, editable version with detailed findings and strategic implications. The complete file is available immediately after checkout.
Original: $10.00
-65%$10.00
$3.50Description
Go Beyond the Preview—Access the Full Strategic Report
Peabody's SWOT reveals how its coal legacy, asset scale, and global reach contrast with regulatory pressure and shifting energy demand. The preview highlights strategic strengths and key vulnerabilities. Want deeper analysis and actionable recommendations? Purchase the full SWOT for a downloadable, editable report to guide investment and strategy decisions.
Strengths
Diversified coal portfolio
Peabody's mix of seaborne thermal, seaborne metallurgical and Powder River Basin coal reduces single-market dependence by spanning both thermal power and steelmaking markets. The Powder River Basin historically supplies roughly 40% of US coal, anchoring Peabody's U.S. volume while Australian operations access Asia's seaborne demand. Geographic spread across the U.S. and Australia helps moderate local disruptions and supports revenue resilience amid commodity volatility.
Scale and operational expertise
As one of the largest private-sector coal companies, Peabody leverages scale—with global operations and roughly $6 billion in annual net sales reported in 2023—to drive lower unit costs and supply reliability. Deep mining, logistics and marketing expertise underpins tight cost management and contract fulfillment for utilities and steelmakers, whose long relationships boost contract stability. Scale also enables continued investment in safety and efficiency programs.
Established export infrastructure
Peabody’s Australian export footprint provides direct access to Asia-Pacific, which takes roughly 75% of global seaborne thermal coal imports (about 1.2 billion tonnes/year), sharpening exposure to regional demand.
Export optionality lets Peabody arbitrate between higher international prices and domestic contracts, while integrated port and rail linkages enable bulk shipments that materially lower per-ton logistics versus road alternatives.
Such specialized rail-port infrastructure requires capital outlays and regulatory consents that are difficult and costly for smaller rivals to replicate, sustaining a competitive moat.
Long-term customer contracts
As of 2024 Peabody’s multi-year supply agreements with utilities and industrials stabilize cash flows by locking volumes and reducing exposure to volatile spot coal prices; contract structures typically include indexed pricing to regional benchmarks and firm volume commitments. This predictable demand supports production planning and capital allocation, lowering downside risk during market downturns.
- Indexed pricing to regional benchmarks
- Firm volume commitments
- Reduced spot exposure
- Supports capex and planning
Resource base and reserves
Peabody’s large, low-sulfur Powder River Basin reserves and metallurgical coal holdings underpin long mine lives and sustained production planning; the company reported roughly 129 million tons sold in 2023, supporting competitive cash costs per ton and markup in metallurgical markets. Strong reserve positions enhance buyer leverage and pricing optionality.
- Reserves: long mine lives
- Quality: low-sulfur PRB, met coal
- Cost: competitive cash costs
- Commercial: improved negotiating leverage
Coal scale 129 Mt, $6B, Asia access, PRB stabilize cash
Peabody’s scale and diversified mix—seaborne thermal, metallurgical and Powder River Basin (PRB) volumes—reduces single-market risk and supports lower unit costs; the company reported roughly $6B net sales and 129 Mt sold in 2023. Australian exports give direct access to Asia, which takes ~75% of seaborne thermal imports (~1.2 Bt/year), while PRB supplies ~40% of US coal. Long-term contracts and integrated rail/port assets stabilize cash flows and raise barriers to entry.
| Metric | Value |
|---|---|
| Net sales (2023) | $6.0B |
| Tons sold (2023) | 129 Mt |
| PRB share of US coal | ~40% |
| Asia share of seaborne thermal imports | ~75% (≈1.2 Bt/yr) |
What is included in the product
Detailed Word Document
Provides a concise SWOT overview of Peabody, outlining its core strengths, operational weaknesses, market opportunities, and external threats shaping strategic decisions.
Customizable Excel Spreadsheet
Provides a concise Peabody SWOT matrix for rapid identification of coal-market risks and strategic opportunities. Ideal for executives needing a high-level, editable snapshot to align strategy and stakeholder communications.
Weaknesses
High commodity price exposure
Peabody faces high exposure to cyclical, volatile coal prices that directly pressure margins and cash flow, with contract repricing and spot sales able to swing quarterly results. Limited hedging liquidity versus oil and gas markets leaves the company more exposed to sudden price moves. This volatility complicates budgeting and makes leverage management and capital allocation more uncertain.
Carbon-intensive product
Peabody's carbon-intensive coal products emit roughly twice the CO2 per MWh of natural gas, inviting regulatory, investor and customer pressure. US coal-fired generation fell to about 19% of electricity in 2023 (EIA), as utilities shift to gas and renewables, reducing demand. Reputation and ESG screening have constrained capital and partnership options, complicating project approvals and financing.
Operational and safety risks
Mining operations expose Peabody to safety, geotechnical and weather risks that in 2024 contributed to production volatility—Peabody sold about 84 million tons of coal in FY2024 and reported revenues near $3.9 billion—while disruptions can lift unit costs by 10–20% and cut volumes, regulatory compliance raises operating complexity and costs, and any incident risks fines, operational downtime and reputational damage.
Legacy liabilities and reclamation
Legacy reclamation and environmental liabilities consume cash and constrain capital allocation; Peabody reported approximately $554 million of asset retirement obligations at year-end 2024, and annual reclamation spending runs into the tens of millions. Bonding requirements often tighten in downturns, and cost overruns in closure activities can quickly erode margins, increasing balance-sheet rigidity.
- Reclamation ARO ~ $554M (2024)
- Annual reclamation spending: tens of millions
- Tighter bonding in downturns
- Closure cost overruns compress margins
Customer concentration
Utility buyers can account for a substantial share of Peabody's regional volumes, concentrating revenue and exposing the company to pricing pressure when large contracts come up for renewal as alternative fuels and imports grow.
Loss of a major utility customer would materially reduce utilization and cash flow, while concentration heightens negotiating risk and limits pricing leverage.
- High regional volume dependence on utilities
- Contract renewals pressure pricing
- Major-customer loss = material utilization drop
- Elevated negotiating and cash-flow risk
Coal firm: volatile prices, margin squeeze, ARO $554M, FY24 sales 84 Mt
Peabody is exposed to volatile coal prices that drive margin swings and uncertain cash flow; FY2024 sales ~84 Mt and revenue ~$3.9B. Coal demand is pressured—US coal generation ~19% of electricity in 2023—raising ESG and financing constraints. Operational risks and reclamation liabilities (ARO ~$554M) increase costs and limit capital flexibility.
| Metric | Value |
|---|---|
| FY2024 sales | ~84 Mt |
| FY2024 revenue | ~$3.9B |
| Asset retirement obligations | ~$554M (2024) |
| US coal share (2023) | ~19% |
What You See Is What You Get
Peabody SWOT Analysis
This is the actual SWOT analysis document you’ll receive upon purchase—no surprises, just professional quality. The preview below is taken directly from the full SWOT report you'll get, covering Peabody's strengths, weaknesses, opportunities, and threats. Purchase unlocks the full, editable version with detailed findings and strategic implications. The complete file is available immediately after checkout.











