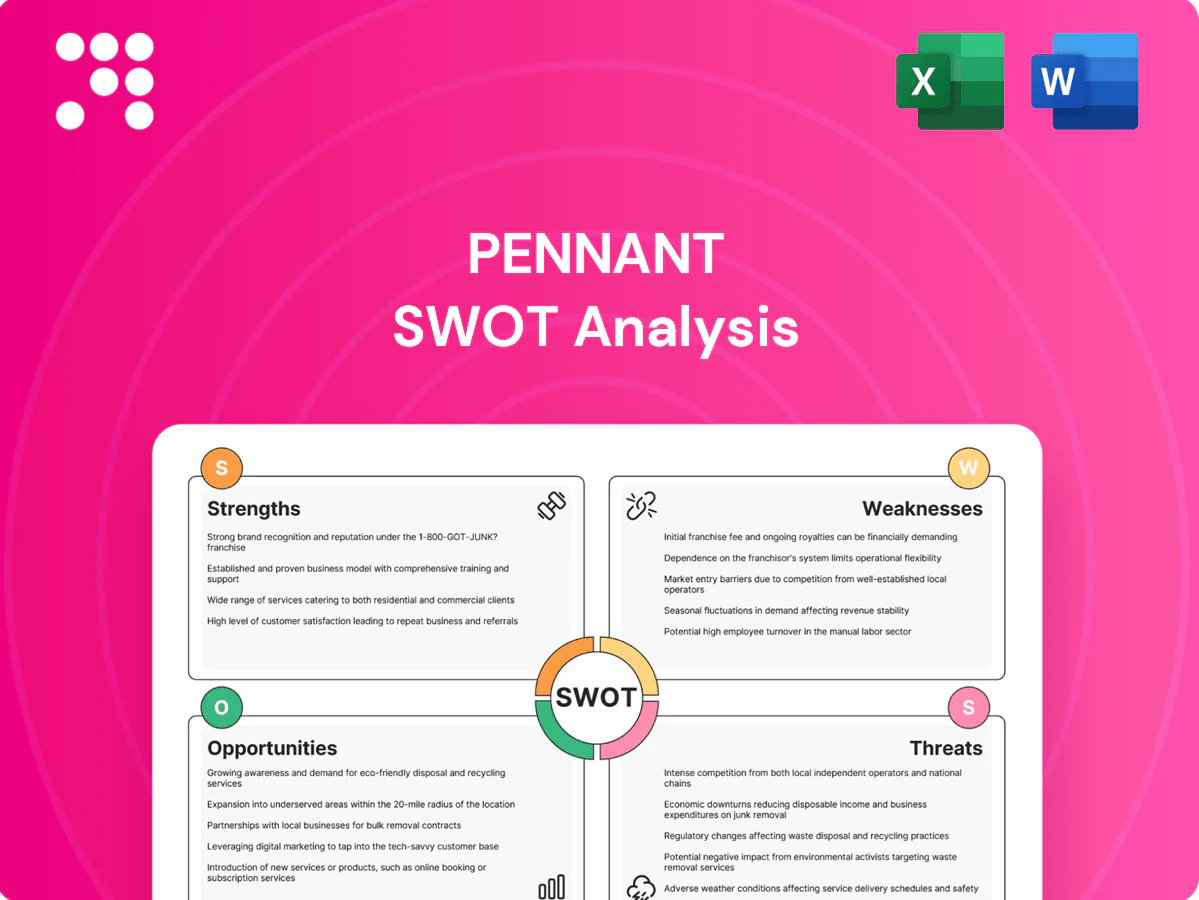
Pennant SWOT Analysis

Dive Deeper Into the Company’s Strategic Blueprint
Pennant's SWOT highlights strong market positioning and innovative product momentum, but also exposes regulatory and competitive risks that could impact growth. Want the full picture behind its strengths, weaknesses, opportunities, and threats? Purchase the complete SWOT analysis for a professionally written, editable Word report plus an Excel matrix to support investing, planning, and pitching.
Strengths

Decentralized operating model
Decentralized operating model gives local leaders autonomy to tailor services to community needs, improving responsiveness and accountability; this boosts clinician engagement and accelerates decisions while often cutting bureaucracy to support cost discipline and local innovation. The approach scales through repeatable playbooks that preserve local initiative and speed adoption across markets.
Diversified care portfolio
Operating across home health, hospice and senior living spreads revenue risk across cycles and taps a growing 65+ population of about 56 million in the U.S., cushioning Pennant against single-line downturns. Cross-segment insights enhance clinical protocols and operational benchmarks, improving care consistency. Diversification stabilizes cash flow versus single-line peers and supports strategic flexibility in capital allocation.

Patient-centered clinical focus
Pennant’s patient-centered outcomes approach can strengthen hospital and physician referrals by demonstrably lowering 30-day readmission rates, which nationally hover around 15% for Medicare beneficiaries, and thereby reduce exposure to CMS HRRP penalties of up to 3% of Medicare payments. Improved quality scores support Medicare Advantage star ratings and associated bonus/rebate benefits (up to 5% for 5-star plans), enhancing payer negotiations. Better outcomes and experience build trust and market share in underserved areas where alternatives are scarce.

Underserved market penetration
Targeting less-served geographies reduces competitive intensity and acquisition costs, allowing Pennant to scale with lower CAC and faster unit economics; rural and smaller metro focus leverages local customization to capture share and deepen community ties. Favorable referral dynamics and workforce loyalty improve retention, while growth via de novo openings and tuck-ins supports steady network expansion.
- Lower CAC
- Faster local share
- Stronger referrals
- Workforce loyalty
- De novo + tuck-in growth
Scalable operating playbook
Standardized metrics, clinical pathways, and centralized back-office support scale efficiently, freeing local operators to focus on care and growth; Medicare Advantage penetration reached about 50% of beneficiaries in 2024, increasing referral density and market opportunity. Data feedback loops across agencies drive continuous improvement and underpin margin expansion as density increases, with consolidation often trimming SG&A ~10–15%.
- Standardized metrics
- Clinical pathways
- Shared services free operators
- Data feedback loops
- Density-driven margin expansion
Decentralized care model boosts clinician adoption, cuts SG&A ~10–15%, taps ~56M 65+ market
Decentralized model enables local responsiveness and faster adoption via playbooks, improving clinician engagement and cost discipline. Cross-segment exposure (home health, hospice, senior living) diversifies revenue vs single-line peers and taps ~56M US adults 65+ (2024). Quality focus lowers 30‑day readmissions (~15% Medicare) and limits HRRP penalties (up to 3%), while consolidation can trim SG&A ~10–15%.
| Metric | Value |
|---|---|
| US 65+ population (2024) | ~56M |
| Medicare Advantage penetration (2024) | ~50% |
| 30‑day readmission (Medicare) | ~15% |
| HRRP max penalty | up to 3% |
| SG&A savings from density | ~10–15% |
What is included in the product
 Detailed Word Document
Provides a concise SWOT analysis of Pennant, detailing internal strengths and weaknesses and external opportunities and threats that shape its competitive position and strategic outlook.

 Customizable Excel Spreadsheet
Provides a focused Pennant SWOT template that distills strengths, weaknesses, opportunities, and threats into a compact visual for faster alignment and clearer, quicker decision-making.
Weaknesses

Labor intensity and turnover
Reliance on nurses, therapists and aides exposes Pennant to widespread shortages and wage pressure, with industry reports in 2023–24 showing turnover rates above 50% in post-acute care. High turnover disrupts continuity of care and raises recruiting costs, while agency staffing—often 1.5–2x regular wage—limits census growth. Overtime and temp usage compress margins and erode operating leverage.
Operational variability
Decentralization at Pennant creates inconsistent standards across locations, with industry studies showing top versus bottom site performance gaps often exceeding 30%, complicating oversight and weakening the brand promise. Maintaining uniform quality pushes training and compliance costs higher—multi-site firms reported rising training spend in 2024—and underperforming sites can dilute consolidated results and margins.

Reimbursement concentration
Heavy reliance on Medicare and Medicaid concentrates pricing risk, since 2024–25 CMS policy changes have tightened documentation and audit scrutiny, delaying reimbursements and increasing admin burden. Recent CMS rulemaking has accelerated how quickly rate cuts affect margins, forcing providers to absorb lower unit prices. Rapid payer mix shifts can demand immediate operational retooling and cash-flow management.

Senior living exposure
Senior living exposure drives revenue volatility—U.S. senior housing occupancy was about 76.8% in Q1 2024 (NIC MAP), and move-in cycles can swing top-line results materially; high fixed costs make margins sensitive to small census declines. Infection-control events raise operating expenses and depress demand, while ongoing capital needs for maintenance and upgrades pressure cash flow and capital expenditure budgets.
- Occupancy: 76.8% (Q1 2024, NIC MAP)
- Margin sensitivity: high fixed costs
- Operational risk: infection-control spikes
- Capex: continuous maintenance/upgrades
Brand scale vs national peers
Compared with national peers, Pennant’s smaller brand scale reduces marketing reach and negotiating leverage with suppliers and advertisers, making market-share expansion costlier. Recruiting top talent is harder without marquee recognition, and limited scale slows technology investment and rollout cadence. These constraints can delay efficient entry into highly competitive metropolitan markets.
- Lower marketing reach
- Weaker supplier leverage
- Recruiting disadvantage
- Slower tech investment
Turnover >50% and 76.8% occupancy squeeze margins amid 1.5-2x agency pay
Reliance on nurses/therapists exposes Pennant to >50% turnover in post-acute care (2023–24), driving agency spend of 1.5–2x wages and compressing margins. Decentralized ops produce >30% top-vs-bottom site performance gaps; occupancy was 76.8% (Q1 2024), heightening margin sensitivity. Heavy Medicare/Medicaid mix and 2024 CMS audit tightening delay reimbursements and raise administrative and capex pressure.
| Metric | 2023–25 Data |
|---|---|
| Post-acute turnover | >50% (2023–24) |
| Agency pay multiplier | 1.5–2x |
| Senior housing occupancy | 76.8% (Q1 2024) |
Full Version Awaits
Pennant SWOT Analysis
This is the actual Pennant SWOT analysis document you'll receive upon purchase—no surprises, just professional quality. The preview below is taken directly from the full report and reflects the real, structured content you'll download after payment. Buy now to unlock the complete, editable version with in-depth findings and recommendations.

Dive Deeper Into the Company’s Strategic Blueprint
Pennant's SWOT highlights strong market positioning and innovative product momentum, but also exposes regulatory and competitive risks that could impact growth. Want the full picture behind its strengths, weaknesses, opportunities, and threats? Purchase the complete SWOT analysis for a professionally written, editable Word report plus an Excel matrix to support investing, planning, and pitching.
Strengths
Decentralized operating model
Decentralized operating model gives local leaders autonomy to tailor services to community needs, improving responsiveness and accountability; this boosts clinician engagement and accelerates decisions while often cutting bureaucracy to support cost discipline and local innovation. The approach scales through repeatable playbooks that preserve local initiative and speed adoption across markets.
Diversified care portfolio
Operating across home health, hospice and senior living spreads revenue risk across cycles and taps a growing 65+ population of about 56 million in the U.S., cushioning Pennant against single-line downturns. Cross-segment insights enhance clinical protocols and operational benchmarks, improving care consistency. Diversification stabilizes cash flow versus single-line peers and supports strategic flexibility in capital allocation.
Patient-centered clinical focus
Pennant’s patient-centered outcomes approach can strengthen hospital and physician referrals by demonstrably lowering 30-day readmission rates, which nationally hover around 15% for Medicare beneficiaries, and thereby reduce exposure to CMS HRRP penalties of up to 3% of Medicare payments. Improved quality scores support Medicare Advantage star ratings and associated bonus/rebate benefits (up to 5% for 5-star plans), enhancing payer negotiations. Better outcomes and experience build trust and market share in underserved areas where alternatives are scarce.
Underserved market penetration
Targeting less-served geographies reduces competitive intensity and acquisition costs, allowing Pennant to scale with lower CAC and faster unit economics; rural and smaller metro focus leverages local customization to capture share and deepen community ties. Favorable referral dynamics and workforce loyalty improve retention, while growth via de novo openings and tuck-ins supports steady network expansion.
- Lower CAC
- Faster local share
- Stronger referrals
- Workforce loyalty
- De novo + tuck-in growth
Scalable operating playbook
Standardized metrics, clinical pathways, and centralized back-office support scale efficiently, freeing local operators to focus on care and growth; Medicare Advantage penetration reached about 50% of beneficiaries in 2024, increasing referral density and market opportunity. Data feedback loops across agencies drive continuous improvement and underpin margin expansion as density increases, with consolidation often trimming SG&A ~10–15%.
- Standardized metrics
- Clinical pathways
- Shared services free operators
- Data feedback loops
- Density-driven margin expansion
Decentralized care model boosts clinician adoption, cuts SG&A ~10–15%, taps ~56M 65+ market
Decentralized model enables local responsiveness and faster adoption via playbooks, improving clinician engagement and cost discipline. Cross-segment exposure (home health, hospice, senior living) diversifies revenue vs single-line peers and taps ~56M US adults 65+ (2024). Quality focus lowers 30‑day readmissions (~15% Medicare) and limits HRRP penalties (up to 3%), while consolidation can trim SG&A ~10–15%.
| Metric | Value |
|---|---|
| US 65+ population (2024) | ~56M |
| Medicare Advantage penetration (2024) | ~50% |
| 30‑day readmission (Medicare) | ~15% |
| HRRP max penalty | up to 3% |
| SG&A savings from density | ~10–15% |
What is included in the product
Detailed Word Document
Provides a concise SWOT analysis of Pennant, detailing internal strengths and weaknesses and external opportunities and threats that shape its competitive position and strategic outlook.
Customizable Excel Spreadsheet
Provides a focused Pennant SWOT template that distills strengths, weaknesses, opportunities, and threats into a compact visual for faster alignment and clearer, quicker decision-making.
Weaknesses
Labor intensity and turnover
Reliance on nurses, therapists and aides exposes Pennant to widespread shortages and wage pressure, with industry reports in 2023–24 showing turnover rates above 50% in post-acute care. High turnover disrupts continuity of care and raises recruiting costs, while agency staffing—often 1.5–2x regular wage—limits census growth. Overtime and temp usage compress margins and erode operating leverage.
Operational variability
Decentralization at Pennant creates inconsistent standards across locations, with industry studies showing top versus bottom site performance gaps often exceeding 30%, complicating oversight and weakening the brand promise. Maintaining uniform quality pushes training and compliance costs higher—multi-site firms reported rising training spend in 2024—and underperforming sites can dilute consolidated results and margins.
Reimbursement concentration
Heavy reliance on Medicare and Medicaid concentrates pricing risk, since 2024–25 CMS policy changes have tightened documentation and audit scrutiny, delaying reimbursements and increasing admin burden. Recent CMS rulemaking has accelerated how quickly rate cuts affect margins, forcing providers to absorb lower unit prices. Rapid payer mix shifts can demand immediate operational retooling and cash-flow management.
Senior living exposure
Senior living exposure drives revenue volatility—U.S. senior housing occupancy was about 76.8% in Q1 2024 (NIC MAP), and move-in cycles can swing top-line results materially; high fixed costs make margins sensitive to small census declines. Infection-control events raise operating expenses and depress demand, while ongoing capital needs for maintenance and upgrades pressure cash flow and capital expenditure budgets.
- Occupancy: 76.8% (Q1 2024, NIC MAP)
- Margin sensitivity: high fixed costs
- Operational risk: infection-control spikes
- Capex: continuous maintenance/upgrades
Brand scale vs national peers
Compared with national peers, Pennant’s smaller brand scale reduces marketing reach and negotiating leverage with suppliers and advertisers, making market-share expansion costlier. Recruiting top talent is harder without marquee recognition, and limited scale slows technology investment and rollout cadence. These constraints can delay efficient entry into highly competitive metropolitan markets.
- Lower marketing reach
- Weaker supplier leverage
- Recruiting disadvantage
- Slower tech investment
Turnover >50% and 76.8% occupancy squeeze margins amid 1.5-2x agency pay
Reliance on nurses/therapists exposes Pennant to >50% turnover in post-acute care (2023–24), driving agency spend of 1.5–2x wages and compressing margins. Decentralized ops produce >30% top-vs-bottom site performance gaps; occupancy was 76.8% (Q1 2024), heightening margin sensitivity. Heavy Medicare/Medicaid mix and 2024 CMS audit tightening delay reimbursements and raise administrative and capex pressure.
| Metric | 2023–25 Data |
|---|---|
| Post-acute turnover | >50% (2023–24) |
| Agency pay multiplier | 1.5–2x |
| Senior housing occupancy | 76.8% (Q1 2024) |
Full Version Awaits
Pennant SWOT Analysis
This is the actual Pennant SWOT analysis document you'll receive upon purchase—no surprises, just professional quality. The preview below is taken directly from the full report and reflects the real, structured content you'll download after payment. Buy now to unlock the complete, editable version with in-depth findings and recommendations.
Original: $10.00
-65%$10.00
$3.50Description
Dive Deeper Into the Company’s Strategic Blueprint
Pennant's SWOT highlights strong market positioning and innovative product momentum, but also exposes regulatory and competitive risks that could impact growth. Want the full picture behind its strengths, weaknesses, opportunities, and threats? Purchase the complete SWOT analysis for a professionally written, editable Word report plus an Excel matrix to support investing, planning, and pitching.
Strengths
Decentralized operating model
Decentralized operating model gives local leaders autonomy to tailor services to community needs, improving responsiveness and accountability; this boosts clinician engagement and accelerates decisions while often cutting bureaucracy to support cost discipline and local innovation. The approach scales through repeatable playbooks that preserve local initiative and speed adoption across markets.
Diversified care portfolio
Operating across home health, hospice and senior living spreads revenue risk across cycles and taps a growing 65+ population of about 56 million in the U.S., cushioning Pennant against single-line downturns. Cross-segment insights enhance clinical protocols and operational benchmarks, improving care consistency. Diversification stabilizes cash flow versus single-line peers and supports strategic flexibility in capital allocation.
Patient-centered clinical focus
Pennant’s patient-centered outcomes approach can strengthen hospital and physician referrals by demonstrably lowering 30-day readmission rates, which nationally hover around 15% for Medicare beneficiaries, and thereby reduce exposure to CMS HRRP penalties of up to 3% of Medicare payments. Improved quality scores support Medicare Advantage star ratings and associated bonus/rebate benefits (up to 5% for 5-star plans), enhancing payer negotiations. Better outcomes and experience build trust and market share in underserved areas where alternatives are scarce.
Underserved market penetration
Targeting less-served geographies reduces competitive intensity and acquisition costs, allowing Pennant to scale with lower CAC and faster unit economics; rural and smaller metro focus leverages local customization to capture share and deepen community ties. Favorable referral dynamics and workforce loyalty improve retention, while growth via de novo openings and tuck-ins supports steady network expansion.
- Lower CAC
- Faster local share
- Stronger referrals
- Workforce loyalty
- De novo + tuck-in growth
Scalable operating playbook
Standardized metrics, clinical pathways, and centralized back-office support scale efficiently, freeing local operators to focus on care and growth; Medicare Advantage penetration reached about 50% of beneficiaries in 2024, increasing referral density and market opportunity. Data feedback loops across agencies drive continuous improvement and underpin margin expansion as density increases, with consolidation often trimming SG&A ~10–15%.
- Standardized metrics
- Clinical pathways
- Shared services free operators
- Data feedback loops
- Density-driven margin expansion
Decentralized care model boosts clinician adoption, cuts SG&A ~10–15%, taps ~56M 65+ market
Decentralized model enables local responsiveness and faster adoption via playbooks, improving clinician engagement and cost discipline. Cross-segment exposure (home health, hospice, senior living) diversifies revenue vs single-line peers and taps ~56M US adults 65+ (2024). Quality focus lowers 30‑day readmissions (~15% Medicare) and limits HRRP penalties (up to 3%), while consolidation can trim SG&A ~10–15%.
| Metric | Value |
|---|---|
| US 65+ population (2024) | ~56M |
| Medicare Advantage penetration (2024) | ~50% |
| 30‑day readmission (Medicare) | ~15% |
| HRRP max penalty | up to 3% |
| SG&A savings from density | ~10–15% |
What is included in the product
Detailed Word Document
Provides a concise SWOT analysis of Pennant, detailing internal strengths and weaknesses and external opportunities and threats that shape its competitive position and strategic outlook.
Customizable Excel Spreadsheet
Provides a focused Pennant SWOT template that distills strengths, weaknesses, opportunities, and threats into a compact visual for faster alignment and clearer, quicker decision-making.
Weaknesses
Labor intensity and turnover
Reliance on nurses, therapists and aides exposes Pennant to widespread shortages and wage pressure, with industry reports in 2023–24 showing turnover rates above 50% in post-acute care. High turnover disrupts continuity of care and raises recruiting costs, while agency staffing—often 1.5–2x regular wage—limits census growth. Overtime and temp usage compress margins and erode operating leverage.
Operational variability
Decentralization at Pennant creates inconsistent standards across locations, with industry studies showing top versus bottom site performance gaps often exceeding 30%, complicating oversight and weakening the brand promise. Maintaining uniform quality pushes training and compliance costs higher—multi-site firms reported rising training spend in 2024—and underperforming sites can dilute consolidated results and margins.
Reimbursement concentration
Heavy reliance on Medicare and Medicaid concentrates pricing risk, since 2024–25 CMS policy changes have tightened documentation and audit scrutiny, delaying reimbursements and increasing admin burden. Recent CMS rulemaking has accelerated how quickly rate cuts affect margins, forcing providers to absorb lower unit prices. Rapid payer mix shifts can demand immediate operational retooling and cash-flow management.
Senior living exposure
Senior living exposure drives revenue volatility—U.S. senior housing occupancy was about 76.8% in Q1 2024 (NIC MAP), and move-in cycles can swing top-line results materially; high fixed costs make margins sensitive to small census declines. Infection-control events raise operating expenses and depress demand, while ongoing capital needs for maintenance and upgrades pressure cash flow and capital expenditure budgets.
- Occupancy: 76.8% (Q1 2024, NIC MAP)
- Margin sensitivity: high fixed costs
- Operational risk: infection-control spikes
- Capex: continuous maintenance/upgrades
Brand scale vs national peers
Compared with national peers, Pennant’s smaller brand scale reduces marketing reach and negotiating leverage with suppliers and advertisers, making market-share expansion costlier. Recruiting top talent is harder without marquee recognition, and limited scale slows technology investment and rollout cadence. These constraints can delay efficient entry into highly competitive metropolitan markets.
- Lower marketing reach
- Weaker supplier leverage
- Recruiting disadvantage
- Slower tech investment
Turnover >50% and 76.8% occupancy squeeze margins amid 1.5-2x agency pay
Reliance on nurses/therapists exposes Pennant to >50% turnover in post-acute care (2023–24), driving agency spend of 1.5–2x wages and compressing margins. Decentralized ops produce >30% top-vs-bottom site performance gaps; occupancy was 76.8% (Q1 2024), heightening margin sensitivity. Heavy Medicare/Medicaid mix and 2024 CMS audit tightening delay reimbursements and raise administrative and capex pressure.
| Metric | 2023–25 Data |
|---|---|
| Post-acute turnover | >50% (2023–24) |
| Agency pay multiplier | 1.5–2x |
| Senior housing occupancy | 76.8% (Q1 2024) |
Full Version Awaits
Pennant SWOT Analysis
This is the actual Pennant SWOT analysis document you'll receive upon purchase—no surprises, just professional quality. The preview below is taken directly from the full report and reflects the real, structured content you'll download after payment. Buy now to unlock the complete, editable version with in-depth findings and recommendations.











