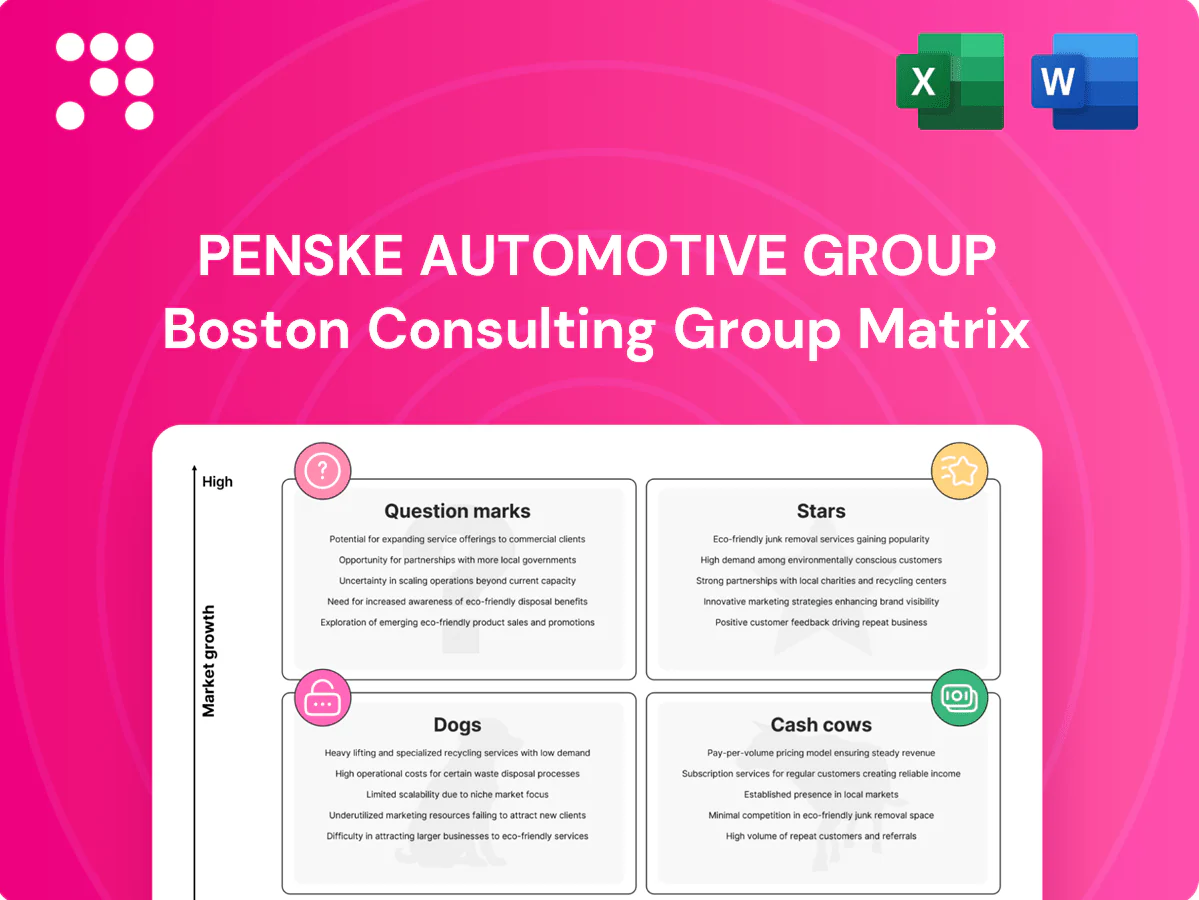
Penske Automotive Group Boston Consulting Group Matrix

Visual. Strategic. Downloadable.
Penske Automotive Group’s BCG Matrix snapshot shows where franchises and service lines sit—some are clear Stars, others steady Cash Cows, and a few are Question Marks worth watching. This preview sketches the high-level moves; buy the full BCG Matrix to see quadrant-by-quadrant placements, precise market-share data, and tactical recommendations you can act on. Purchase now for a ready-to-use Word report plus an Excel summary—cut the research time and get a strategic playbook fast.
Stars

Premium-brand dealerships in fast-growth cities
Premium-brand dealerships in fast-growth cities — Penske’s network of over 300 premium franchises (BMW, Mercedes, Lexus, etc.) sits in high-growth MSAs like Austin and Phoenix where luxury demand is concentrated, giving defendable share. These stores lead local conversation and absorb promo and placement spend to stay ahead while sustaining pricing power. Keep feeding inventory, talent and omnichannel; today’s star can become tomorrow’s cash cow if momentum holds.
Commercial vehicle distribution in booming logistics corridors
E-commerce penetration rose to about 18% of U.S. retail sales in 2024, and reshoring strengthened freight flows through key logistics corridors, boosting demand for commercial vehicle distribution. Penske Automotive Group’s broad dealer and fleet footprint plus OEM partnerships capture expanding route share as hubs scale. Higher working-capital burn funds inventory and spare parts, but increased throughput and utilization drive payback. Continue targeted investment in capacity and uptime SLAs to sustain growth.

Fleet service contracts with uptime guarantees
Locked-in demand from hundreds of thousands of fleet vehicles and rising fleet counts plus performance-based uptime targets (commonly 95%+) push Penske into high-growth, high-share BCG territory; multi-year contracts (typically 3–5 years) cement recurring revenue. Delivering this requires techs, bays and telematics investment and is cash-hungry, but the resulting stickiness protects service levels and wins leadership customers.

CPO sales in supply-constrained markets
Late-model CPO inventory turns fastest in supply-constrained markets; in 2024 dealers saw weeks-to-turn compressing versus pre-pandemic levels as buyers chased immediate availability. Penske Automotive Groups certification trust and dealer scale — over 1,500 retail locations — drive share and velocity. Marketing and reconditioning spend is elevated but retail CPO margins held resilient through 2024 despite softer wholesale values. Stay aggressive on sourcing and sub-30-day turn targets.
- Supply pressure 2024: faster retail turns
- Scale: 1,500+ locations
- Investment: high marketing/reconditioning
- Margin: retail CPO resilient in 2024
- Action: prioritize sourcing and <30-day turns
F&I bundles with high attach in growth stores
F&I bundles show star behavior in Penske growth stores: penetration rises where volume is hot and finance desks are sharp, often lifting attach by 10–20 points; industry F&I gross averaged about 1,600 USD per retailed unit in 2024. Success requires ongoing training, compliance muscle and digital workflows; yield per deal justifies continued investment as share compounds with process maturity. Keep tuning menus and lenders.
- Attach lift: +10–20 pts
- Avg F&I gross 2024: 1,600 USD/unit
- Requires: training, compliance, digital workflows
- Focus: menu pricing and lender mix
Premium dealerships & fleet: luxury demand, high volumes and pricing power
Penske’s premium dealerships and fleet services act as BCG Stars in 2024, benefiting from luxury demand in fast-growth MSAs, 18% e-commerce penetration, and recurring fleet contracts; high inventory spend fuels volume while preserving pricing power. F&I strength (avg 1,600 USD/unit) and 1,500+ locations amplify share and margins, but capex and working-capital remain elevated to sustain throughput.
| Metric | 2024 | Note |
|---|---|---|
| E‑commerce share | 18% | US retail |
| F&I avg gross | 1,600 USD/unit | Industry avg |
| Retail locations | 1,500+ | PAG network |
What is included in the product
 Detailed Word Document
BCG Matrix of Penske Automotive Group: maps Stars, Cash Cows, Question Marks and Dogs with clear invest/hold/divest guidance.

 Customizable Excel Spreadsheet
One-page Penske Automotive BCG matrix placing each unit in a quadrant for quick strategic decisions.
Cash Cows

Service & parts operations
Service & parts operations are mature, high-share bays that hum day in, day out with low market growth, steady ticket sizes and strong absorption—classic milk-the-cash. Incremental tooling and scheduling tweaks lift throughput without massive spend, improving labor utilization and fixed-cost leverage. These operations consistently fund investment across the portfolio.
Dominant metro dealerships in settled markets
Dominant metro dealerships in settled markets deliver sticky local share and predictable 2024 demand, with operations focused on light promotion, efficiency and CSI to preserve margins. Growth is modest, typically low-single-digit, while fixed ops and service lanes provide stable profit coverage for overhead. Maintain these assets rather than chase vanity expansion.

Scaled used-vehicle retail
Scaled used-vehicle retail at Penske is volume-driven and process-heavy, with data-led sourcing and pricing improving buys and turns; Penske reported total revenue of $39.8 billion in fiscal 2024, underscoring scale. Market growth is stable, not spiking, but Penske maintains share advantages through tight working-capital controls and reconditioning efficiency, keeping the engine lean and cash-generative.

Long-term fleet maintenance programs
Long-term fleet maintenance programs are predictable cash cows: renewing contracts, routine work and planned downtime drive steady, low-drama cash flow with slow growth but deep customer relationships. In 2024 Penske Automotive Group’s service operations supported margins within broader company revenue (~$36B), so focus on workflow software and parts logistics to squeeze incremental margin. Milk, don’t overbuild.
- renewals: recurring revenue
- routine: high utilization, low volatility
- invest: workflow SW & parts logistics
- strategy: optimize margins, avoid capacity overbuild
Insurance renewals and finance income
Renewal streams from insurance and finance income deliver steady, high-margin cash for Penske Automotive, with predictable attachment and low churn supporting recurring revenue and funding investment in growth areas.
Robust compliance and credit controls keep operating costs low and interest spread returns stable, allowing the insurer/finance lane to underwrite riskier dealer and mobility bets.
- Renewal reliability
- Predictable attachment/churn
- Low compliance-driven costs
- Funds risk capital
Service, parts & used-vehicle retail drive steady cash flow — 2024 39.8B
Service & parts and scaled used-vehicle retail are Penske’s cash cows: mature, high-share businesses delivering steady, low-volatility cash flow that funds fleet, mobility and selective expansion. Finance/insurance renewals add predictable, high-margin income. 2024 revenue: $39.8 billion; prioritize margin ops, workflow software and parts logistics to lift cash conversion.
| Metric | 2024 | Role |
|---|---|---|
| Total revenue | $39.8B | Scale backbone |
| Market growth | Low-single-digit | Stable cash flow |
What You See Is What You Get
Penske Automotive Group BCG Matrix
The file you’re previewing is the exact BCG Matrix report you’ll receive after purchase—no watermarks, no placeholders, just the finished, professionally formatted document. It’s built for clarity and action, ready to drop into presentations or strategic plans without edits. After buying, you’ll get the full, editable file straight to your inbox—no surprises, no waiting. Made by strategy pros for busy leaders who need clean, reliable analysis now.

Visual. Strategic. Downloadable.
Penske Automotive Group’s BCG Matrix snapshot shows where franchises and service lines sit—some are clear Stars, others steady Cash Cows, and a few are Question Marks worth watching. This preview sketches the high-level moves; buy the full BCG Matrix to see quadrant-by-quadrant placements, precise market-share data, and tactical recommendations you can act on. Purchase now for a ready-to-use Word report plus an Excel summary—cut the research time and get a strategic playbook fast.
Stars
Premium-brand dealerships in fast-growth cities
Premium-brand dealerships in fast-growth cities — Penske’s network of over 300 premium franchises (BMW, Mercedes, Lexus, etc.) sits in high-growth MSAs like Austin and Phoenix where luxury demand is concentrated, giving defendable share. These stores lead local conversation and absorb promo and placement spend to stay ahead while sustaining pricing power. Keep feeding inventory, talent and omnichannel; today’s star can become tomorrow’s cash cow if momentum holds.
Commercial vehicle distribution in booming logistics corridors
E-commerce penetration rose to about 18% of U.S. retail sales in 2024, and reshoring strengthened freight flows through key logistics corridors, boosting demand for commercial vehicle distribution. Penske Automotive Group’s broad dealer and fleet footprint plus OEM partnerships capture expanding route share as hubs scale. Higher working-capital burn funds inventory and spare parts, but increased throughput and utilization drive payback. Continue targeted investment in capacity and uptime SLAs to sustain growth.
Fleet service contracts with uptime guarantees
Locked-in demand from hundreds of thousands of fleet vehicles and rising fleet counts plus performance-based uptime targets (commonly 95%+) push Penske into high-growth, high-share BCG territory; multi-year contracts (typically 3–5 years) cement recurring revenue. Delivering this requires techs, bays and telematics investment and is cash-hungry, but the resulting stickiness protects service levels and wins leadership customers.
CPO sales in supply-constrained markets
Late-model CPO inventory turns fastest in supply-constrained markets; in 2024 dealers saw weeks-to-turn compressing versus pre-pandemic levels as buyers chased immediate availability. Penske Automotive Groups certification trust and dealer scale — over 1,500 retail locations — drive share and velocity. Marketing and reconditioning spend is elevated but retail CPO margins held resilient through 2024 despite softer wholesale values. Stay aggressive on sourcing and sub-30-day turn targets.
- Supply pressure 2024: faster retail turns
- Scale: 1,500+ locations
- Investment: high marketing/reconditioning
- Margin: retail CPO resilient in 2024
- Action: prioritize sourcing and <30-day turns
F&I bundles with high attach in growth stores
F&I bundles show star behavior in Penske growth stores: penetration rises where volume is hot and finance desks are sharp, often lifting attach by 10–20 points; industry F&I gross averaged about 1,600 USD per retailed unit in 2024. Success requires ongoing training, compliance muscle and digital workflows; yield per deal justifies continued investment as share compounds with process maturity. Keep tuning menus and lenders.
- Attach lift: +10–20 pts
- Avg F&I gross 2024: 1,600 USD/unit
- Requires: training, compliance, digital workflows
- Focus: menu pricing and lender mix
Premium dealerships & fleet: luxury demand, high volumes and pricing power
Penske’s premium dealerships and fleet services act as BCG Stars in 2024, benefiting from luxury demand in fast-growth MSAs, 18% e-commerce penetration, and recurring fleet contracts; high inventory spend fuels volume while preserving pricing power. F&I strength (avg 1,600 USD/unit) and 1,500+ locations amplify share and margins, but capex and working-capital remain elevated to sustain throughput.
| Metric | 2024 | Note |
|---|---|---|
| E‑commerce share | 18% | US retail |
| F&I avg gross | 1,600 USD/unit | Industry avg |
| Retail locations | 1,500+ | PAG network |
What is included in the product
Detailed Word Document
BCG Matrix of Penske Automotive Group: maps Stars, Cash Cows, Question Marks and Dogs with clear invest/hold/divest guidance.
Customizable Excel Spreadsheet
One-page Penske Automotive BCG matrix placing each unit in a quadrant for quick strategic decisions.
Cash Cows
Service & parts operations
Service & parts operations are mature, high-share bays that hum day in, day out with low market growth, steady ticket sizes and strong absorption—classic milk-the-cash. Incremental tooling and scheduling tweaks lift throughput without massive spend, improving labor utilization and fixed-cost leverage. These operations consistently fund investment across the portfolio.
Dominant metro dealerships in settled markets
Dominant metro dealerships in settled markets deliver sticky local share and predictable 2024 demand, with operations focused on light promotion, efficiency and CSI to preserve margins. Growth is modest, typically low-single-digit, while fixed ops and service lanes provide stable profit coverage for overhead. Maintain these assets rather than chase vanity expansion.
Scaled used-vehicle retail
Scaled used-vehicle retail at Penske is volume-driven and process-heavy, with data-led sourcing and pricing improving buys and turns; Penske reported total revenue of $39.8 billion in fiscal 2024, underscoring scale. Market growth is stable, not spiking, but Penske maintains share advantages through tight working-capital controls and reconditioning efficiency, keeping the engine lean and cash-generative.
Long-term fleet maintenance programs
Long-term fleet maintenance programs are predictable cash cows: renewing contracts, routine work and planned downtime drive steady, low-drama cash flow with slow growth but deep customer relationships. In 2024 Penske Automotive Group’s service operations supported margins within broader company revenue (~$36B), so focus on workflow software and parts logistics to squeeze incremental margin. Milk, don’t overbuild.
- renewals: recurring revenue
- routine: high utilization, low volatility
- invest: workflow SW & parts logistics
- strategy: optimize margins, avoid capacity overbuild
Insurance renewals and finance income
Renewal streams from insurance and finance income deliver steady, high-margin cash for Penske Automotive, with predictable attachment and low churn supporting recurring revenue and funding investment in growth areas.
Robust compliance and credit controls keep operating costs low and interest spread returns stable, allowing the insurer/finance lane to underwrite riskier dealer and mobility bets.
- Renewal reliability
- Predictable attachment/churn
- Low compliance-driven costs
- Funds risk capital
Service, parts & used-vehicle retail drive steady cash flow — 2024 39.8B
Service & parts and scaled used-vehicle retail are Penske’s cash cows: mature, high-share businesses delivering steady, low-volatility cash flow that funds fleet, mobility and selective expansion. Finance/insurance renewals add predictable, high-margin income. 2024 revenue: $39.8 billion; prioritize margin ops, workflow software and parts logistics to lift cash conversion.
| Metric | 2024 | Role |
|---|---|---|
| Total revenue | $39.8B | Scale backbone |
| Market growth | Low-single-digit | Stable cash flow |
What You See Is What You Get
Penske Automotive Group BCG Matrix
The file you’re previewing is the exact BCG Matrix report you’ll receive after purchase—no watermarks, no placeholders, just the finished, professionally formatted document. It’s built for clarity and action, ready to drop into presentations or strategic plans without edits. After buying, you’ll get the full, editable file straight to your inbox—no surprises, no waiting. Made by strategy pros for busy leaders who need clean, reliable analysis now.
Description
Visual. Strategic. Downloadable.
Penske Automotive Group’s BCG Matrix snapshot shows where franchises and service lines sit—some are clear Stars, others steady Cash Cows, and a few are Question Marks worth watching. This preview sketches the high-level moves; buy the full BCG Matrix to see quadrant-by-quadrant placements, precise market-share data, and tactical recommendations you can act on. Purchase now for a ready-to-use Word report plus an Excel summary—cut the research time and get a strategic playbook fast.
Stars
Premium-brand dealerships in fast-growth cities
Premium-brand dealerships in fast-growth cities — Penske’s network of over 300 premium franchises (BMW, Mercedes, Lexus, etc.) sits in high-growth MSAs like Austin and Phoenix where luxury demand is concentrated, giving defendable share. These stores lead local conversation and absorb promo and placement spend to stay ahead while sustaining pricing power. Keep feeding inventory, talent and omnichannel; today’s star can become tomorrow’s cash cow if momentum holds.
Commercial vehicle distribution in booming logistics corridors
E-commerce penetration rose to about 18% of U.S. retail sales in 2024, and reshoring strengthened freight flows through key logistics corridors, boosting demand for commercial vehicle distribution. Penske Automotive Group’s broad dealer and fleet footprint plus OEM partnerships capture expanding route share as hubs scale. Higher working-capital burn funds inventory and spare parts, but increased throughput and utilization drive payback. Continue targeted investment in capacity and uptime SLAs to sustain growth.
Fleet service contracts with uptime guarantees
Locked-in demand from hundreds of thousands of fleet vehicles and rising fleet counts plus performance-based uptime targets (commonly 95%+) push Penske into high-growth, high-share BCG territory; multi-year contracts (typically 3–5 years) cement recurring revenue. Delivering this requires techs, bays and telematics investment and is cash-hungry, but the resulting stickiness protects service levels and wins leadership customers.
CPO sales in supply-constrained markets
Late-model CPO inventory turns fastest in supply-constrained markets; in 2024 dealers saw weeks-to-turn compressing versus pre-pandemic levels as buyers chased immediate availability. Penske Automotive Groups certification trust and dealer scale — over 1,500 retail locations — drive share and velocity. Marketing and reconditioning spend is elevated but retail CPO margins held resilient through 2024 despite softer wholesale values. Stay aggressive on sourcing and sub-30-day turn targets.
- Supply pressure 2024: faster retail turns
- Scale: 1,500+ locations
- Investment: high marketing/reconditioning
- Margin: retail CPO resilient in 2024
- Action: prioritize sourcing and <30-day turns
F&I bundles with high attach in growth stores
F&I bundles show star behavior in Penske growth stores: penetration rises where volume is hot and finance desks are sharp, often lifting attach by 10–20 points; industry F&I gross averaged about 1,600 USD per retailed unit in 2024. Success requires ongoing training, compliance muscle and digital workflows; yield per deal justifies continued investment as share compounds with process maturity. Keep tuning menus and lenders.
- Attach lift: +10–20 pts
- Avg F&I gross 2024: 1,600 USD/unit
- Requires: training, compliance, digital workflows
- Focus: menu pricing and lender mix
Premium dealerships & fleet: luxury demand, high volumes and pricing power
Penske’s premium dealerships and fleet services act as BCG Stars in 2024, benefiting from luxury demand in fast-growth MSAs, 18% e-commerce penetration, and recurring fleet contracts; high inventory spend fuels volume while preserving pricing power. F&I strength (avg 1,600 USD/unit) and 1,500+ locations amplify share and margins, but capex and working-capital remain elevated to sustain throughput.
| Metric | 2024 | Note |
|---|---|---|
| E‑commerce share | 18% | US retail |
| F&I avg gross | 1,600 USD/unit | Industry avg |
| Retail locations | 1,500+ | PAG network |
What is included in the product
Detailed Word Document
BCG Matrix of Penske Automotive Group: maps Stars, Cash Cows, Question Marks and Dogs with clear invest/hold/divest guidance.
Customizable Excel Spreadsheet
One-page Penske Automotive BCG matrix placing each unit in a quadrant for quick strategic decisions.
Cash Cows
Service & parts operations
Service & parts operations are mature, high-share bays that hum day in, day out with low market growth, steady ticket sizes and strong absorption—classic milk-the-cash. Incremental tooling and scheduling tweaks lift throughput without massive spend, improving labor utilization and fixed-cost leverage. These operations consistently fund investment across the portfolio.
Dominant metro dealerships in settled markets
Dominant metro dealerships in settled markets deliver sticky local share and predictable 2024 demand, with operations focused on light promotion, efficiency and CSI to preserve margins. Growth is modest, typically low-single-digit, while fixed ops and service lanes provide stable profit coverage for overhead. Maintain these assets rather than chase vanity expansion.
Scaled used-vehicle retail
Scaled used-vehicle retail at Penske is volume-driven and process-heavy, with data-led sourcing and pricing improving buys and turns; Penske reported total revenue of $39.8 billion in fiscal 2024, underscoring scale. Market growth is stable, not spiking, but Penske maintains share advantages through tight working-capital controls and reconditioning efficiency, keeping the engine lean and cash-generative.
Long-term fleet maintenance programs
Long-term fleet maintenance programs are predictable cash cows: renewing contracts, routine work and planned downtime drive steady, low-drama cash flow with slow growth but deep customer relationships. In 2024 Penske Automotive Group’s service operations supported margins within broader company revenue (~$36B), so focus on workflow software and parts logistics to squeeze incremental margin. Milk, don’t overbuild.
- renewals: recurring revenue
- routine: high utilization, low volatility
- invest: workflow SW & parts logistics
- strategy: optimize margins, avoid capacity overbuild
Insurance renewals and finance income
Renewal streams from insurance and finance income deliver steady, high-margin cash for Penske Automotive, with predictable attachment and low churn supporting recurring revenue and funding investment in growth areas.
Robust compliance and credit controls keep operating costs low and interest spread returns stable, allowing the insurer/finance lane to underwrite riskier dealer and mobility bets.
- Renewal reliability
- Predictable attachment/churn
- Low compliance-driven costs
- Funds risk capital
Service, parts & used-vehicle retail drive steady cash flow — 2024 39.8B
Service & parts and scaled used-vehicle retail are Penske’s cash cows: mature, high-share businesses delivering steady, low-volatility cash flow that funds fleet, mobility and selective expansion. Finance/insurance renewals add predictable, high-margin income. 2024 revenue: $39.8 billion; prioritize margin ops, workflow software and parts logistics to lift cash conversion.
| Metric | 2024 | Role |
|---|---|---|
| Total revenue | $39.8B | Scale backbone |
| Market growth | Low-single-digit | Stable cash flow |
What You See Is What You Get
Penske Automotive Group BCG Matrix
The file you’re previewing is the exact BCG Matrix report you’ll receive after purchase—no watermarks, no placeholders, just the finished, professionally formatted document. It’s built for clarity and action, ready to drop into presentations or strategic plans without edits. After buying, you’ll get the full, editable file straight to your inbox—no surprises, no waiting. Made by strategy pros for busy leaders who need clean, reliable analysis now.











