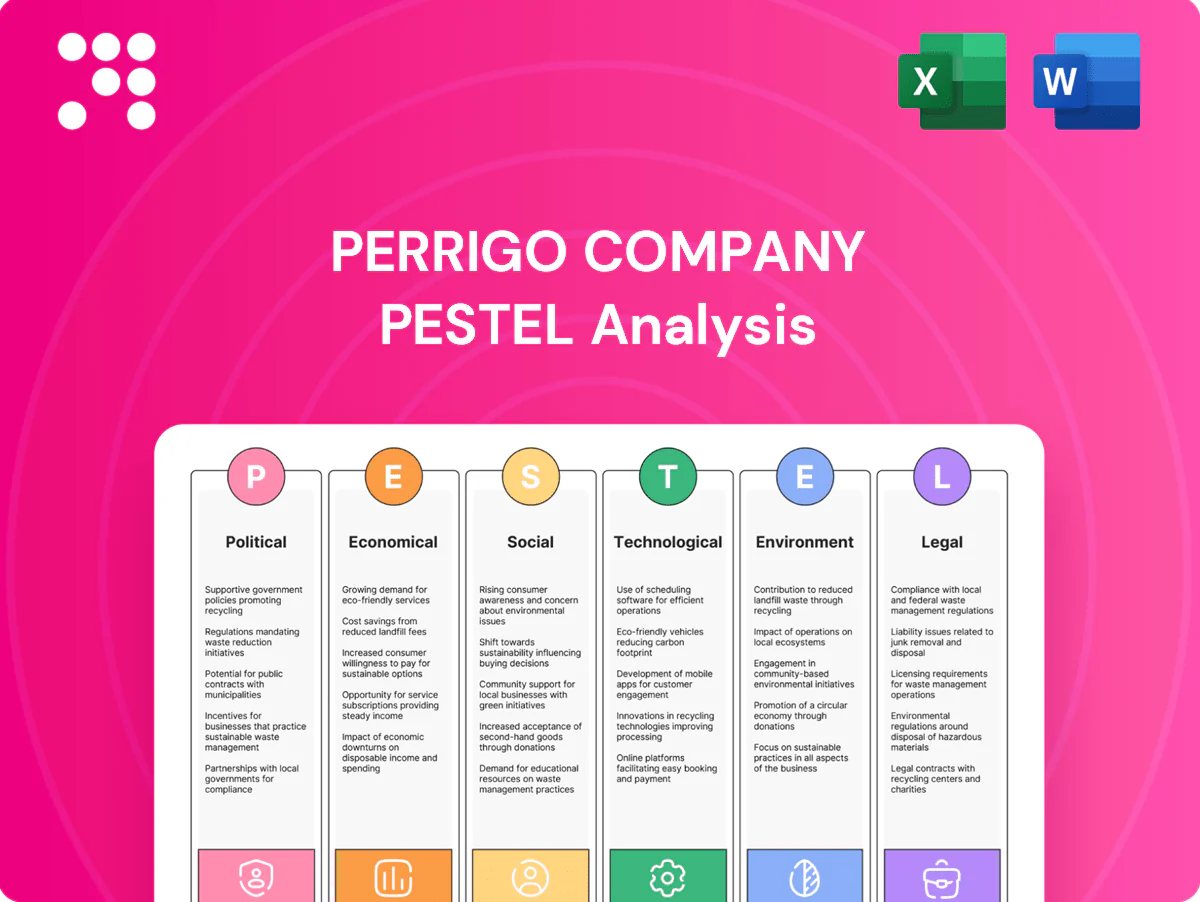
Perrigo Company PESTLE Analysis

Your Shortcut to Market Insight Starts Here
Gain a strategic edge with our concise PESTLE snapshot for Perrigo Company: it reveals how regulation, macroeconomics, and technological shifts shape growth and risks. Perfect for investors and strategists, the full PESTLE delivers deeper, actionable insights. Purchase the complete report to access the detailed analysis now.
Political factors

OTC regulatory agendas
Government priorities on self-care and OTC access drive category growth—US OTC retail sales were roughly $40 billion in 2024—shaping approval timelines and Rx-to-OTC switches that affect Perrigo’s ~3.2 billion USD annual revenue profile. FDA monograph reform remains in active rulemaking with hundreds of stakeholder comments, while EMA, MHRA and TGA updates since 2023 have tightened some claim pathways and relaxed others. Perrigo must engage policy consultations to influence standards and budget for compliance investments, and divergent national policies force adaptive labeling and portfolio strategies across markets.
Drug pricing and affordability politics
Political pressure to curb healthcare costs pushes consumers toward OTC and private-label solutions, which supports Perrigo’s value positioning. However, retailer margin compression and reference-pricing initiatives can squeeze manufacturers during negotiations under public scrutiny. HSA/FSA policy influences self-care spending—2024 HSA limits were $4,150 individual/$8,300 family and FSA limit $3,050—shaping consumer willingness to pay.

Trade policy and tariffs
Tariffs on APIs, packaging or finished goods raise Perrigo’s COGS and pricing across US–EU–Australia lanes, given its Ireland headquarters and major manufacturing in the US and Ireland; many industry APIs are sourced from India and China. Post-Brexit regulatory divergence has added customs and compliance friction for UK/EU movements. Trade tensions with API source countries drive supply reconfiguration, so Perrigo needs tariff engineering and dual-sourcing to mitigate volatility.

Public health priorities
Government vaccination drives, cold/flu preparedness and self-care literacy programs can lift OTC demand; the global OTC market was about 152.5 billion USD in 2023, offering scale for Perrigo to capture share. Policy shifts in opioid stewardship and revised pain-management guidelines are reshaping analgesic volumes, while pandemic readiness and essential-designation rules drive stockpiling and channel prioritization. Aligning SKUs with public-health messaging enhances credibility and uptake.
- Vaccination & preparedness broaden OTC demand
- Opioid policies compress analgesic segments
- Pandemic readiness raises stockpiling/essential status
Geopolitical stability and logistics
Geopolitical conflicts and sanctions continue to disrupt freight lanes, increase carrier insurance and delay key API and packaging deliveries, pressuring Perrigo supply chains and working capital. European energy policy shocks since 2022 have raised manufacturing input cost volatility and prompted capacity curtailments that affect lead times. Political unrest complicates regulatory inspections and product launches, driving Perrigo to build regional redundancy to limit exposure to single-source disruptions.
- Supply disruption: freight lanes, insurance, delayed APIs
- Energy shocks: higher input cost volatility in Europe
- Regulatory risk: inspections and product release delays
- Mitigation: regional redundancy to reduce localized exposure
Regulatory shifts, tariffs and HSA caps reshape OTC market and $3.2B exposure
Perrigo faces regulatory shifts (FDA monograph reform; EMA/MHRA updates) altering OTC approvals and Rx‑to‑OTC switches, affecting ~3.2bn USD revenue. Tariffs, trade tensions and post‑Brexit friction raise COGS and logistics risk, driving dual‑sourcing. Public cost‑containment and 2024 HSA/FSA limits ($4,150/$8,300) push consumers to private‑label OTC.
| Factor | 2023–25 Data | Impact |
|---|---|---|
| US OTC sales | $40B (2024) | Market growth |
| Global OTC | $152.5B (2023) | Scale opportunity |
| Perrigo rev | $3.2B | Revenue exposure |
What is included in the product
 Detailed Word Document
Explores how macro-environmental factors uniquely affect Perrigo across Political, Economic, Social, Technological, Environmental, and Legal dimensions, with data-backed trends, actionable insights, and forward-looking implications to help executives, investors, and strategists identify risks, opportunities, and scenario-ready strategies.

 Customizable Excel Spreadsheet
Perrigo Company PESTLE analysis distilled into a concise, shareable brief that quickly highlights regulatory, economic, social and technological risks and opportunities, easing strategic discussions and decision-making across teams.
Economic factors

Consumer spending and inflation
Sticky inflation remaining above 3% in 2024 lifted staple price points and accelerated trade-down to private label, benefiting Perrigo given its scale in store-brand OTCs. Real wage stagnation in 2023–24 increased elasticity across cough/cold, allergy and digestive categories, shifting consumers toward lower-price tiers. Cyclical input costs for excipients and packaging continued to pressure gross margins. Strategic pack-price architecture and layered value tiers help defend volume.
Retailer consolidation dynamics
Large US and EU retailers and pharmacy chains (Walmart, Kroger, CVS, Walgreens, Amazon) command roughly half of U.S. grocery/OTC shelf space, exerting pricing and assortment control. Private-label penetration rose to about 19% in the U.S. in 2024 and tops 30% in some EU categories, boosting Perrigo’s contract-manufacturing volumes but tightening gross margins by roughly 200–300 basis points from promotions and slotting. Strategic joint business planning can secure category captaincy, shelf allocation and promotional funding.

FX and interest rate environment
FX swings (USD/EUR ~1.08, USD/GBP ~1.27, USD/AUD ~0.65 mid-2025) materially affect Perrigo’s translated revenues and global input costs. Higher policy rates (Fed ~5.25–5.5%, ECB ~4.0%, BoE ~5.25%) lift working-capital and inventory carrying costs by ~100–200bps in seasonal categories. Hedging policies and natural operational offsets have reduced FX/rate earnings volatility. Capex timing should follow rate trajectories and higher ROI thresholds.

Supply chain resilience costs
Perrigo’s shift to safety stocks, nearshoring and dual-sourcing raises service levels but lifts inventory and overheads; inventory carrying can increase months of working capital. Ocean freight fell roughly 60% from 2022 peaks to 2024 (Drewry) while air rates in 2024 remained about 30–40% above 2019 (IATA), driving landed-cost variance. API availability and 6–12 month qualification lead times delay NPI calendars; APICS studies show planning and VMI can cut bullwhip variance 20–40%.
- Safety stocks: higher working capital
- Nearshoring/dual-sourcing: up-front capex/overhead
- Freight cycles: ocean -60% vs 2022; air +30–40% vs 2019
- API lead times: 6–12 months
- Advanced planning/VMI: reduce variability 20–40%
Category seasonality and epidemiology
Cold and flu intensity drives volatile week-to-week demand spikes for Perrigo cough/cold SKUs, with US influenza activity peaking in Dec 2023–Jan 2024 per CDC surveillance, amplifying OTC sell-through and inventory churn. Climate-driven shifts have lengthened allergy seasons, changing sell-in timing and return rates for antihistamines and nasal products. Economic cycles push consumers between efficacy-focused generics and premium wellness SKUs; Perrigo’s flexible manufacturing and rapid changeovers capture upside during spikes.
- Seasonal peaks: CDC Dec 2023–Jan 2024
- Allergy lengthening: climate-driven shifts
- Basket shift: value vs premium in recessions
- Operational edge: fast changeovers
Regulatory shifts, tariffs and HSA caps reshape OTC market and $3.2B exposure
Sticky inflation >3% in 2024 raised staple prices and accelerated private‑label share; US private‑label ~19% (2024). FX mid‑2025 USD/EUR ~1.08 and policy rates (Fed 5.25–5.5%) lift carry costs; hedging mitigates volatility. Freight: ocean -60% vs 2022, air +30–40% vs 2019; API lead times 6–12 months, pressuring NPI timing.
| Metric | Value |
|---|---|
| Inflation (2024) | >3% |
| US private‑label (2024) | ~19% |
| USD/EUR (mid‑2025) | ~1.08 |
| Fed rate | 5.25–5.5% |
| Ocean freight vs 2022 | -60% |
| Air freight vs 2019 | +30–40% |
| API lead times | 6–12 mo |
Preview the Actual Deliverable
Perrigo Company PESTLE Analysis
This Perrigo Company PESTLE Analysis offers a concise, professionally structured review of political, economic, social, technological, legal, and environmental factors affecting the business. The preview shown here is the exact document you’ll receive after purchase—fully formatted and ready to use. No placeholders or teasers: what you see is the final file available for immediate download.

Your Shortcut to Market Insight Starts Here
Gain a strategic edge with our concise PESTLE snapshot for Perrigo Company: it reveals how regulation, macroeconomics, and technological shifts shape growth and risks. Perfect for investors and strategists, the full PESTLE delivers deeper, actionable insights. Purchase the complete report to access the detailed analysis now.
Political factors
OTC regulatory agendas
Government priorities on self-care and OTC access drive category growth—US OTC retail sales were roughly $40 billion in 2024—shaping approval timelines and Rx-to-OTC switches that affect Perrigo’s ~3.2 billion USD annual revenue profile. FDA monograph reform remains in active rulemaking with hundreds of stakeholder comments, while EMA, MHRA and TGA updates since 2023 have tightened some claim pathways and relaxed others. Perrigo must engage policy consultations to influence standards and budget for compliance investments, and divergent national policies force adaptive labeling and portfolio strategies across markets.
Drug pricing and affordability politics
Political pressure to curb healthcare costs pushes consumers toward OTC and private-label solutions, which supports Perrigo’s value positioning. However, retailer margin compression and reference-pricing initiatives can squeeze manufacturers during negotiations under public scrutiny. HSA/FSA policy influences self-care spending—2024 HSA limits were $4,150 individual/$8,300 family and FSA limit $3,050—shaping consumer willingness to pay.
Trade policy and tariffs
Tariffs on APIs, packaging or finished goods raise Perrigo’s COGS and pricing across US–EU–Australia lanes, given its Ireland headquarters and major manufacturing in the US and Ireland; many industry APIs are sourced from India and China. Post-Brexit regulatory divergence has added customs and compliance friction for UK/EU movements. Trade tensions with API source countries drive supply reconfiguration, so Perrigo needs tariff engineering and dual-sourcing to mitigate volatility.
Public health priorities
Government vaccination drives, cold/flu preparedness and self-care literacy programs can lift OTC demand; the global OTC market was about 152.5 billion USD in 2023, offering scale for Perrigo to capture share. Policy shifts in opioid stewardship and revised pain-management guidelines are reshaping analgesic volumes, while pandemic readiness and essential-designation rules drive stockpiling and channel prioritization. Aligning SKUs with public-health messaging enhances credibility and uptake.
- Vaccination & preparedness broaden OTC demand
- Opioid policies compress analgesic segments
- Pandemic readiness raises stockpiling/essential status
Geopolitical stability and logistics
Geopolitical conflicts and sanctions continue to disrupt freight lanes, increase carrier insurance and delay key API and packaging deliveries, pressuring Perrigo supply chains and working capital. European energy policy shocks since 2022 have raised manufacturing input cost volatility and prompted capacity curtailments that affect lead times. Political unrest complicates regulatory inspections and product launches, driving Perrigo to build regional redundancy to limit exposure to single-source disruptions.
- Supply disruption: freight lanes, insurance, delayed APIs
- Energy shocks: higher input cost volatility in Europe
- Regulatory risk: inspections and product release delays
- Mitigation: regional redundancy to reduce localized exposure
Regulatory shifts, tariffs and HSA caps reshape OTC market and $3.2B exposure
Perrigo faces regulatory shifts (FDA monograph reform; EMA/MHRA updates) altering OTC approvals and Rx‑to‑OTC switches, affecting ~3.2bn USD revenue. Tariffs, trade tensions and post‑Brexit friction raise COGS and logistics risk, driving dual‑sourcing. Public cost‑containment and 2024 HSA/FSA limits ($4,150/$8,300) push consumers to private‑label OTC.
| Factor | 2023–25 Data | Impact |
|---|---|---|
| US OTC sales | $40B (2024) | Market growth |
| Global OTC | $152.5B (2023) | Scale opportunity |
| Perrigo rev | $3.2B | Revenue exposure |
What is included in the product
Detailed Word Document
Explores how macro-environmental factors uniquely affect Perrigo across Political, Economic, Social, Technological, Environmental, and Legal dimensions, with data-backed trends, actionable insights, and forward-looking implications to help executives, investors, and strategists identify risks, opportunities, and scenario-ready strategies.
Customizable Excel Spreadsheet
Perrigo Company PESTLE analysis distilled into a concise, shareable brief that quickly highlights regulatory, economic, social and technological risks and opportunities, easing strategic discussions and decision-making across teams.
Economic factors
Consumer spending and inflation
Sticky inflation remaining above 3% in 2024 lifted staple price points and accelerated trade-down to private label, benefiting Perrigo given its scale in store-brand OTCs. Real wage stagnation in 2023–24 increased elasticity across cough/cold, allergy and digestive categories, shifting consumers toward lower-price tiers. Cyclical input costs for excipients and packaging continued to pressure gross margins. Strategic pack-price architecture and layered value tiers help defend volume.
Retailer consolidation dynamics
Large US and EU retailers and pharmacy chains (Walmart, Kroger, CVS, Walgreens, Amazon) command roughly half of U.S. grocery/OTC shelf space, exerting pricing and assortment control. Private-label penetration rose to about 19% in the U.S. in 2024 and tops 30% in some EU categories, boosting Perrigo’s contract-manufacturing volumes but tightening gross margins by roughly 200–300 basis points from promotions and slotting. Strategic joint business planning can secure category captaincy, shelf allocation and promotional funding.
FX and interest rate environment
FX swings (USD/EUR ~1.08, USD/GBP ~1.27, USD/AUD ~0.65 mid-2025) materially affect Perrigo’s translated revenues and global input costs. Higher policy rates (Fed ~5.25–5.5%, ECB ~4.0%, BoE ~5.25%) lift working-capital and inventory carrying costs by ~100–200bps in seasonal categories. Hedging policies and natural operational offsets have reduced FX/rate earnings volatility. Capex timing should follow rate trajectories and higher ROI thresholds.
Supply chain resilience costs
Perrigo’s shift to safety stocks, nearshoring and dual-sourcing raises service levels but lifts inventory and overheads; inventory carrying can increase months of working capital. Ocean freight fell roughly 60% from 2022 peaks to 2024 (Drewry) while air rates in 2024 remained about 30–40% above 2019 (IATA), driving landed-cost variance. API availability and 6–12 month qualification lead times delay NPI calendars; APICS studies show planning and VMI can cut bullwhip variance 20–40%.
- Safety stocks: higher working capital
- Nearshoring/dual-sourcing: up-front capex/overhead
- Freight cycles: ocean -60% vs 2022; air +30–40% vs 2019
- API lead times: 6–12 months
- Advanced planning/VMI: reduce variability 20–40%
Category seasonality and epidemiology
Cold and flu intensity drives volatile week-to-week demand spikes for Perrigo cough/cold SKUs, with US influenza activity peaking in Dec 2023–Jan 2024 per CDC surveillance, amplifying OTC sell-through and inventory churn. Climate-driven shifts have lengthened allergy seasons, changing sell-in timing and return rates for antihistamines and nasal products. Economic cycles push consumers between efficacy-focused generics and premium wellness SKUs; Perrigo’s flexible manufacturing and rapid changeovers capture upside during spikes.
- Seasonal peaks: CDC Dec 2023–Jan 2024
- Allergy lengthening: climate-driven shifts
- Basket shift: value vs premium in recessions
- Operational edge: fast changeovers
Regulatory shifts, tariffs and HSA caps reshape OTC market and $3.2B exposure
Sticky inflation >3% in 2024 raised staple prices and accelerated private‑label share; US private‑label ~19% (2024). FX mid‑2025 USD/EUR ~1.08 and policy rates (Fed 5.25–5.5%) lift carry costs; hedging mitigates volatility. Freight: ocean -60% vs 2022, air +30–40% vs 2019; API lead times 6–12 months, pressuring NPI timing.
| Metric | Value |
|---|---|
| Inflation (2024) | >3% |
| US private‑label (2024) | ~19% |
| USD/EUR (mid‑2025) | ~1.08 |
| Fed rate | 5.25–5.5% |
| Ocean freight vs 2022 | -60% |
| Air freight vs 2019 | +30–40% |
| API lead times | 6–12 mo |
Preview the Actual Deliverable
Perrigo Company PESTLE Analysis
This Perrigo Company PESTLE Analysis offers a concise, professionally structured review of political, economic, social, technological, legal, and environmental factors affecting the business. The preview shown here is the exact document you’ll receive after purchase—fully formatted and ready to use. No placeholders or teasers: what you see is the final file available for immediate download.
Description
Your Shortcut to Market Insight Starts Here
Gain a strategic edge with our concise PESTLE snapshot for Perrigo Company: it reveals how regulation, macroeconomics, and technological shifts shape growth and risks. Perfect for investors and strategists, the full PESTLE delivers deeper, actionable insights. Purchase the complete report to access the detailed analysis now.
Political factors
OTC regulatory agendas
Government priorities on self-care and OTC access drive category growth—US OTC retail sales were roughly $40 billion in 2024—shaping approval timelines and Rx-to-OTC switches that affect Perrigo’s ~3.2 billion USD annual revenue profile. FDA monograph reform remains in active rulemaking with hundreds of stakeholder comments, while EMA, MHRA and TGA updates since 2023 have tightened some claim pathways and relaxed others. Perrigo must engage policy consultations to influence standards and budget for compliance investments, and divergent national policies force adaptive labeling and portfolio strategies across markets.
Drug pricing and affordability politics
Political pressure to curb healthcare costs pushes consumers toward OTC and private-label solutions, which supports Perrigo’s value positioning. However, retailer margin compression and reference-pricing initiatives can squeeze manufacturers during negotiations under public scrutiny. HSA/FSA policy influences self-care spending—2024 HSA limits were $4,150 individual/$8,300 family and FSA limit $3,050—shaping consumer willingness to pay.
Trade policy and tariffs
Tariffs on APIs, packaging or finished goods raise Perrigo’s COGS and pricing across US–EU–Australia lanes, given its Ireland headquarters and major manufacturing in the US and Ireland; many industry APIs are sourced from India and China. Post-Brexit regulatory divergence has added customs and compliance friction for UK/EU movements. Trade tensions with API source countries drive supply reconfiguration, so Perrigo needs tariff engineering and dual-sourcing to mitigate volatility.
Public health priorities
Government vaccination drives, cold/flu preparedness and self-care literacy programs can lift OTC demand; the global OTC market was about 152.5 billion USD in 2023, offering scale for Perrigo to capture share. Policy shifts in opioid stewardship and revised pain-management guidelines are reshaping analgesic volumes, while pandemic readiness and essential-designation rules drive stockpiling and channel prioritization. Aligning SKUs with public-health messaging enhances credibility and uptake.
- Vaccination & preparedness broaden OTC demand
- Opioid policies compress analgesic segments
- Pandemic readiness raises stockpiling/essential status
Geopolitical stability and logistics
Geopolitical conflicts and sanctions continue to disrupt freight lanes, increase carrier insurance and delay key API and packaging deliveries, pressuring Perrigo supply chains and working capital. European energy policy shocks since 2022 have raised manufacturing input cost volatility and prompted capacity curtailments that affect lead times. Political unrest complicates regulatory inspections and product launches, driving Perrigo to build regional redundancy to limit exposure to single-source disruptions.
- Supply disruption: freight lanes, insurance, delayed APIs
- Energy shocks: higher input cost volatility in Europe
- Regulatory risk: inspections and product release delays
- Mitigation: regional redundancy to reduce localized exposure
Regulatory shifts, tariffs and HSA caps reshape OTC market and $3.2B exposure
Perrigo faces regulatory shifts (FDA monograph reform; EMA/MHRA updates) altering OTC approvals and Rx‑to‑OTC switches, affecting ~3.2bn USD revenue. Tariffs, trade tensions and post‑Brexit friction raise COGS and logistics risk, driving dual‑sourcing. Public cost‑containment and 2024 HSA/FSA limits ($4,150/$8,300) push consumers to private‑label OTC.
| Factor | 2023–25 Data | Impact |
|---|---|---|
| US OTC sales | $40B (2024) | Market growth |
| Global OTC | $152.5B (2023) | Scale opportunity |
| Perrigo rev | $3.2B | Revenue exposure |
What is included in the product
Detailed Word Document
Explores how macro-environmental factors uniquely affect Perrigo across Political, Economic, Social, Technological, Environmental, and Legal dimensions, with data-backed trends, actionable insights, and forward-looking implications to help executives, investors, and strategists identify risks, opportunities, and scenario-ready strategies.
Customizable Excel Spreadsheet
Perrigo Company PESTLE analysis distilled into a concise, shareable brief that quickly highlights regulatory, economic, social and technological risks and opportunities, easing strategic discussions and decision-making across teams.
Economic factors
Consumer spending and inflation
Sticky inflation remaining above 3% in 2024 lifted staple price points and accelerated trade-down to private label, benefiting Perrigo given its scale in store-brand OTCs. Real wage stagnation in 2023–24 increased elasticity across cough/cold, allergy and digestive categories, shifting consumers toward lower-price tiers. Cyclical input costs for excipients and packaging continued to pressure gross margins. Strategic pack-price architecture and layered value tiers help defend volume.
Retailer consolidation dynamics
Large US and EU retailers and pharmacy chains (Walmart, Kroger, CVS, Walgreens, Amazon) command roughly half of U.S. grocery/OTC shelf space, exerting pricing and assortment control. Private-label penetration rose to about 19% in the U.S. in 2024 and tops 30% in some EU categories, boosting Perrigo’s contract-manufacturing volumes but tightening gross margins by roughly 200–300 basis points from promotions and slotting. Strategic joint business planning can secure category captaincy, shelf allocation and promotional funding.
FX and interest rate environment
FX swings (USD/EUR ~1.08, USD/GBP ~1.27, USD/AUD ~0.65 mid-2025) materially affect Perrigo’s translated revenues and global input costs. Higher policy rates (Fed ~5.25–5.5%, ECB ~4.0%, BoE ~5.25%) lift working-capital and inventory carrying costs by ~100–200bps in seasonal categories. Hedging policies and natural operational offsets have reduced FX/rate earnings volatility. Capex timing should follow rate trajectories and higher ROI thresholds.
Supply chain resilience costs
Perrigo’s shift to safety stocks, nearshoring and dual-sourcing raises service levels but lifts inventory and overheads; inventory carrying can increase months of working capital. Ocean freight fell roughly 60% from 2022 peaks to 2024 (Drewry) while air rates in 2024 remained about 30–40% above 2019 (IATA), driving landed-cost variance. API availability and 6–12 month qualification lead times delay NPI calendars; APICS studies show planning and VMI can cut bullwhip variance 20–40%.
- Safety stocks: higher working capital
- Nearshoring/dual-sourcing: up-front capex/overhead
- Freight cycles: ocean -60% vs 2022; air +30–40% vs 2019
- API lead times: 6–12 months
- Advanced planning/VMI: reduce variability 20–40%
Category seasonality and epidemiology
Cold and flu intensity drives volatile week-to-week demand spikes for Perrigo cough/cold SKUs, with US influenza activity peaking in Dec 2023–Jan 2024 per CDC surveillance, amplifying OTC sell-through and inventory churn. Climate-driven shifts have lengthened allergy seasons, changing sell-in timing and return rates for antihistamines and nasal products. Economic cycles push consumers between efficacy-focused generics and premium wellness SKUs; Perrigo’s flexible manufacturing and rapid changeovers capture upside during spikes.
- Seasonal peaks: CDC Dec 2023–Jan 2024
- Allergy lengthening: climate-driven shifts
- Basket shift: value vs premium in recessions
- Operational edge: fast changeovers
Regulatory shifts, tariffs and HSA caps reshape OTC market and $3.2B exposure
Sticky inflation >3% in 2024 raised staple prices and accelerated private‑label share; US private‑label ~19% (2024). FX mid‑2025 USD/EUR ~1.08 and policy rates (Fed 5.25–5.5%) lift carry costs; hedging mitigates volatility. Freight: ocean -60% vs 2022, air +30–40% vs 2019; API lead times 6–12 months, pressuring NPI timing.
| Metric | Value |
|---|---|
| Inflation (2024) | >3% |
| US private‑label (2024) | ~19% |
| USD/EUR (mid‑2025) | ~1.08 |
| Fed rate | 5.25–5.5% |
| Ocean freight vs 2022 | -60% |
| Air freight vs 2019 | +30–40% |
| API lead times | 6–12 mo |
Preview the Actual Deliverable
Perrigo Company PESTLE Analysis
This Perrigo Company PESTLE Analysis offers a concise, professionally structured review of political, economic, social, technological, legal, and environmental factors affecting the business. The preview shown here is the exact document you’ll receive after purchase—fully formatted and ready to use. No placeholders or teasers: what you see is the final file available for immediate download.











