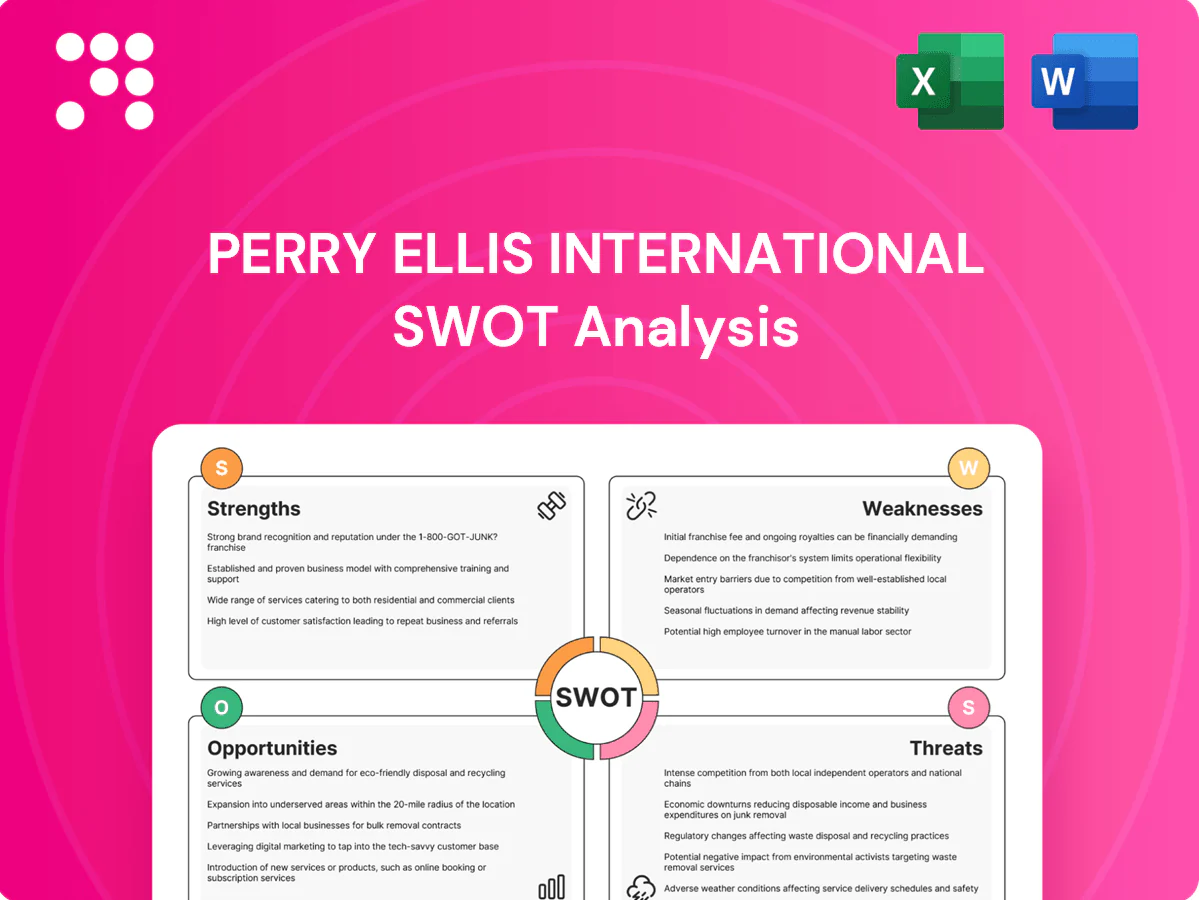
Perry Ellis International SWOT Analysis

Make Insightful Decisions Backed by Expert Research
Perry Ellis International blends strong brand heritage and diversified distribution with margins pressured by retail shifts and inventory risks. Competitive apparel markets and reliance on wholesale partnerships present growth challenges, while licensing and digital expansion offer clear upside. Want the full story behind the company’s strengths, risks, and growth drivers? Purchase the complete SWOT analysis to gain an editable, investor-ready report.
Strengths

Diverse brand portfolio
Perry Ellis International operates more than 20 owned and licensed lifestyle brands across dress, casual, golf, swim and fragrance, spreading risk across multiple price points and consumer segments. This breadth enables cross-selling and evens seasonal revenue swings, providing resilience by not relying on a single hero label.
Multi-channel global distribution
Perry Ellis International distributes 25+ brands through department stores, specialty retailers, off-price channels, direct e-commerce and international wholesalers, enabling reach across varied demographics and geographies; its flexible channel mix lets the company reallocate inventory to chase demand, while global sourcing and buyer networks drive scale with suppliers and retail partners.

Licensing and royalty engine
Perry Ellis combines owned brands and licensed agreements to drive asset-light royalty income, supporting its $1.07 billion net sales reported in FY2024. Licensing lets the company enter new categories without heavy capex, while royalties provide more predictable cash flows and higher gross margins. Royalty streams boost margin accretion and benefit from licensees’ marketing spend that amplifies brand awareness globally.

Design-to-sourcing expertise
Perry Ellis leverages experienced design, merchandising and global sourcing teams to drive speed-to-market and tight cost control, supporting consistent product execution at targeted price-value; fiscal 2024 net sales hovered around $1.1B, reflecting scale that strengthens vendor leverage across Asia, Latin America and Europe, enabling agile calendar management, robust quality control and better price negotiation.
- Speed-to-market from centralized design/sourcing
- Regional vendor networks for agility & price leverage
- Seasonal calendar + QC driving consistent execution
Balanced price-value positioning
Balanced price-value positioning lets Perry Ellis deliver accessible lifestyle fashion with strong value perception, supporting fiscal 2024 net sales of about $1.15 billion and steady gross margins versus peers.
The brand serves the mid-market via premium outlets and off-price channels (≈35% distribution) without material dilution, covering workwear, casual and occasionwear to drive broad reach and repeat buyers.
- Value-led appeal
- Multi-channel reach ≈35% off-price
- Work/casual/occasion coverage
- Drives repeat purchases
Diversified apparel portfolio, multi-channel reach and ~$1.07B FY2024 sales
Perry Ellis operates 20+ owned/licensed brands across dress, casual, golf, swim and fragrance, reducing concentration risk.
Multi-channel distribution (department, specialty, off-price ~35%, e-commerce, international wholesale) enables wide reach and inventory flexibility.
FY2024 net sales ~$1.07B with asset-light licensing/royalty streams and centralized design/sourcing that drive speed-to-market and vendor leverage.
| Metric | Value |
|---|---|
| Brands | 20+ |
| FY2024 Sales | $1.07B |
| Off-price Distribution | ~35% |
What is included in the product
 Detailed Word Document
Delivers a strategic overview of Perry Ellis International’s internal and external business factors, outlining strengths, weaknesses, opportunities, and threats to assess its competitive position and growth prospects.

 Customizable Excel Spreadsheet
Provides a concise Perry Ellis International SWOT matrix to relieve analysis bottlenecks, enabling fast strategic alignment and clear stakeholder communication.
Weaknesses

Wholesale dependence
Perry Ellis remains heavily dependent on department stores and third-party retailers that dictate shelf space and markdown policies, with wholesale still representing a majority of channels after FY2024 net sales of about $1.3 billion. This exposes the company to retailer inventory cuts and chargebacks that compress margins. Wholesale margins are tighter versus direct-to-consumer, and the firm is vulnerable to retail consolidation and bankruptcies.
Fashion and demand volatility
Perry Ellis is highly exposed to fast-changing style cycles and seasonal misreads, which can force heavy markdowns and elevated returns when trends shift; the company reported FY2024 net sales of $1.05 billion, amplifying scale risk. Forecasting demand across dozens of brands and categories increases planning complexity and inventory mismatch. In promotional environments, reliance on discounts drives marked earnings variability quarter-to-quarter.

Inventory and working capital intensity
Perry Ellis must commit buys months ahead, tying cash into inventory—ending fiscal 2024 with inventory of $352.2 million—raising working-capital intensity and liquidity drag. Long lead times heighten obsolescence and liquidation pressure if trends shift, while wide assortments and many SKUs increase logistics and fulfillment costs. These factors can compress gross margins during slow seasons when sell-through falters.

Limited direct-to-consumer scale
Perry Ellis International's direct-to-consumer e-commerce and company-owned store footprint remains materially smaller than many apparel peers, with DTC representing roughly 7% of net sales in FY2024 versus 20–30% at larger competitors, limiting first‑party data capture and customer lifetime value realization.
The wholesale‑heavy mix reduces pricing and merchandising control, compresses margin upside and slows test‑and‑learn cycles for assortment and personalization.
- Lower DTC share ≈7% of FY2024 net sales
- Peers' DTC typically 20–30%
- Weaker first‑party data and LTV capture
- Less pricing/merchandising control; slower consumer testing
License concentration and renewal risk
Perry Ellis International’s reliance on key licensed brands and categories creates renewal dependency; with reported FY2024 net sales near $1.0 billion, loss or tightening of a major license could materially cut revenue. Licensor agreements often restrict geographic/channel expansion and require strict brand-guideline coordination, adding operational complexity and margin pressure.
- License concentration risk
- Potential material revenue loss on non-renewal
- Geographic/channel limits in contracts
- High compliance/coordination costs
Wholesale-heavy apparel firm facing margin compression, elevated inventory and weak DTC
Perry Ellis is wholesale‑heavy (FY2024 net sales ~$1.3B; wholesale majority) exposing it to retailer markdowns and chargebacks that compress margins. Inventory was $352.2M at FY2024, raising working‑capital and obsolescence risk. DTC ≈7% of sales vs peers 20–30%, limiting first‑party data and pricing control; license concentration risks material revenue loss on non‑renewal.
| Metric | Value |
|---|---|
| FY2024 net sales | ~$1.3B |
| Inventory (FY2024) | $352.2M |
| DTC share | ~7% |
| Peers' DTC | 20–30% |
Full Version Awaits
Perry Ellis International SWOT Analysis
This is the actual Perry Ellis International SWOT analysis document you’ll receive upon purchase—no surprises, just professional quality. The preview below is taken directly from the full report you'll get and reflects the same structure and findings. Purchase unlocks the entire, editable and detailed version for immediate download.

Make Insightful Decisions Backed by Expert Research
Perry Ellis International blends strong brand heritage and diversified distribution with margins pressured by retail shifts and inventory risks. Competitive apparel markets and reliance on wholesale partnerships present growth challenges, while licensing and digital expansion offer clear upside. Want the full story behind the company’s strengths, risks, and growth drivers? Purchase the complete SWOT analysis to gain an editable, investor-ready report.
Strengths
Diverse brand portfolio
Perry Ellis International operates more than 20 owned and licensed lifestyle brands across dress, casual, golf, swim and fragrance, spreading risk across multiple price points and consumer segments. This breadth enables cross-selling and evens seasonal revenue swings, providing resilience by not relying on a single hero label.
Multi-channel global distribution
Perry Ellis International distributes 25+ brands through department stores, specialty retailers, off-price channels, direct e-commerce and international wholesalers, enabling reach across varied demographics and geographies; its flexible channel mix lets the company reallocate inventory to chase demand, while global sourcing and buyer networks drive scale with suppliers and retail partners.
Licensing and royalty engine
Perry Ellis combines owned brands and licensed agreements to drive asset-light royalty income, supporting its $1.07 billion net sales reported in FY2024. Licensing lets the company enter new categories without heavy capex, while royalties provide more predictable cash flows and higher gross margins. Royalty streams boost margin accretion and benefit from licensees’ marketing spend that amplifies brand awareness globally.
Design-to-sourcing expertise
Perry Ellis leverages experienced design, merchandising and global sourcing teams to drive speed-to-market and tight cost control, supporting consistent product execution at targeted price-value; fiscal 2024 net sales hovered around $1.1B, reflecting scale that strengthens vendor leverage across Asia, Latin America and Europe, enabling agile calendar management, robust quality control and better price negotiation.
- Speed-to-market from centralized design/sourcing
- Regional vendor networks for agility & price leverage
- Seasonal calendar + QC driving consistent execution
Balanced price-value positioning
Balanced price-value positioning lets Perry Ellis deliver accessible lifestyle fashion with strong value perception, supporting fiscal 2024 net sales of about $1.15 billion and steady gross margins versus peers.
The brand serves the mid-market via premium outlets and off-price channels (≈35% distribution) without material dilution, covering workwear, casual and occasionwear to drive broad reach and repeat buyers.
- Value-led appeal
- Multi-channel reach ≈35% off-price
- Work/casual/occasion coverage
- Drives repeat purchases
Diversified apparel portfolio, multi-channel reach and ~$1.07B FY2024 sales
Perry Ellis operates 20+ owned/licensed brands across dress, casual, golf, swim and fragrance, reducing concentration risk.
Multi-channel distribution (department, specialty, off-price ~35%, e-commerce, international wholesale) enables wide reach and inventory flexibility.
FY2024 net sales ~$1.07B with asset-light licensing/royalty streams and centralized design/sourcing that drive speed-to-market and vendor leverage.
| Metric | Value |
|---|---|
| Brands | 20+ |
| FY2024 Sales | $1.07B |
| Off-price Distribution | ~35% |
What is included in the product
Detailed Word Document
Delivers a strategic overview of Perry Ellis International’s internal and external business factors, outlining strengths, weaknesses, opportunities, and threats to assess its competitive position and growth prospects.
Customizable Excel Spreadsheet
Provides a concise Perry Ellis International SWOT matrix to relieve analysis bottlenecks, enabling fast strategic alignment and clear stakeholder communication.
Weaknesses
Wholesale dependence
Perry Ellis remains heavily dependent on department stores and third-party retailers that dictate shelf space and markdown policies, with wholesale still representing a majority of channels after FY2024 net sales of about $1.3 billion. This exposes the company to retailer inventory cuts and chargebacks that compress margins. Wholesale margins are tighter versus direct-to-consumer, and the firm is vulnerable to retail consolidation and bankruptcies.
Fashion and demand volatility
Perry Ellis is highly exposed to fast-changing style cycles and seasonal misreads, which can force heavy markdowns and elevated returns when trends shift; the company reported FY2024 net sales of $1.05 billion, amplifying scale risk. Forecasting demand across dozens of brands and categories increases planning complexity and inventory mismatch. In promotional environments, reliance on discounts drives marked earnings variability quarter-to-quarter.
Inventory and working capital intensity
Perry Ellis must commit buys months ahead, tying cash into inventory—ending fiscal 2024 with inventory of $352.2 million—raising working-capital intensity and liquidity drag. Long lead times heighten obsolescence and liquidation pressure if trends shift, while wide assortments and many SKUs increase logistics and fulfillment costs. These factors can compress gross margins during slow seasons when sell-through falters.
Limited direct-to-consumer scale
Perry Ellis International's direct-to-consumer e-commerce and company-owned store footprint remains materially smaller than many apparel peers, with DTC representing roughly 7% of net sales in FY2024 versus 20–30% at larger competitors, limiting first‑party data capture and customer lifetime value realization.
The wholesale‑heavy mix reduces pricing and merchandising control, compresses margin upside and slows test‑and‑learn cycles for assortment and personalization.
- Lower DTC share ≈7% of FY2024 net sales
- Peers' DTC typically 20–30%
- Weaker first‑party data and LTV capture
- Less pricing/merchandising control; slower consumer testing
License concentration and renewal risk
Perry Ellis International’s reliance on key licensed brands and categories creates renewal dependency; with reported FY2024 net sales near $1.0 billion, loss or tightening of a major license could materially cut revenue. Licensor agreements often restrict geographic/channel expansion and require strict brand-guideline coordination, adding operational complexity and margin pressure.
- License concentration risk
- Potential material revenue loss on non-renewal
- Geographic/channel limits in contracts
- High compliance/coordination costs
Wholesale-heavy apparel firm facing margin compression, elevated inventory and weak DTC
Perry Ellis is wholesale‑heavy (FY2024 net sales ~$1.3B; wholesale majority) exposing it to retailer markdowns and chargebacks that compress margins. Inventory was $352.2M at FY2024, raising working‑capital and obsolescence risk. DTC ≈7% of sales vs peers 20–30%, limiting first‑party data and pricing control; license concentration risks material revenue loss on non‑renewal.
| Metric | Value |
|---|---|
| FY2024 net sales | ~$1.3B |
| Inventory (FY2024) | $352.2M |
| DTC share | ~7% |
| Peers' DTC | 20–30% |
Full Version Awaits
Perry Ellis International SWOT Analysis
This is the actual Perry Ellis International SWOT analysis document you’ll receive upon purchase—no surprises, just professional quality. The preview below is taken directly from the full report you'll get and reflects the same structure and findings. Purchase unlocks the entire, editable and detailed version for immediate download.
Description
Make Insightful Decisions Backed by Expert Research
Perry Ellis International blends strong brand heritage and diversified distribution with margins pressured by retail shifts and inventory risks. Competitive apparel markets and reliance on wholesale partnerships present growth challenges, while licensing and digital expansion offer clear upside. Want the full story behind the company’s strengths, risks, and growth drivers? Purchase the complete SWOT analysis to gain an editable, investor-ready report.
Strengths
Diverse brand portfolio
Perry Ellis International operates more than 20 owned and licensed lifestyle brands across dress, casual, golf, swim and fragrance, spreading risk across multiple price points and consumer segments. This breadth enables cross-selling and evens seasonal revenue swings, providing resilience by not relying on a single hero label.
Multi-channel global distribution
Perry Ellis International distributes 25+ brands through department stores, specialty retailers, off-price channels, direct e-commerce and international wholesalers, enabling reach across varied demographics and geographies; its flexible channel mix lets the company reallocate inventory to chase demand, while global sourcing and buyer networks drive scale with suppliers and retail partners.
Licensing and royalty engine
Perry Ellis combines owned brands and licensed agreements to drive asset-light royalty income, supporting its $1.07 billion net sales reported in FY2024. Licensing lets the company enter new categories without heavy capex, while royalties provide more predictable cash flows and higher gross margins. Royalty streams boost margin accretion and benefit from licensees’ marketing spend that amplifies brand awareness globally.
Design-to-sourcing expertise
Perry Ellis leverages experienced design, merchandising and global sourcing teams to drive speed-to-market and tight cost control, supporting consistent product execution at targeted price-value; fiscal 2024 net sales hovered around $1.1B, reflecting scale that strengthens vendor leverage across Asia, Latin America and Europe, enabling agile calendar management, robust quality control and better price negotiation.
- Speed-to-market from centralized design/sourcing
- Regional vendor networks for agility & price leverage
- Seasonal calendar + QC driving consistent execution
Balanced price-value positioning
Balanced price-value positioning lets Perry Ellis deliver accessible lifestyle fashion with strong value perception, supporting fiscal 2024 net sales of about $1.15 billion and steady gross margins versus peers.
The brand serves the mid-market via premium outlets and off-price channels (≈35% distribution) without material dilution, covering workwear, casual and occasionwear to drive broad reach and repeat buyers.
- Value-led appeal
- Multi-channel reach ≈35% off-price
- Work/casual/occasion coverage
- Drives repeat purchases
Diversified apparel portfolio, multi-channel reach and ~$1.07B FY2024 sales
Perry Ellis operates 20+ owned/licensed brands across dress, casual, golf, swim and fragrance, reducing concentration risk.
Multi-channel distribution (department, specialty, off-price ~35%, e-commerce, international wholesale) enables wide reach and inventory flexibility.
FY2024 net sales ~$1.07B with asset-light licensing/royalty streams and centralized design/sourcing that drive speed-to-market and vendor leverage.
| Metric | Value |
|---|---|
| Brands | 20+ |
| FY2024 Sales | $1.07B |
| Off-price Distribution | ~35% |
What is included in the product
Detailed Word Document
Delivers a strategic overview of Perry Ellis International’s internal and external business factors, outlining strengths, weaknesses, opportunities, and threats to assess its competitive position and growth prospects.
Customizable Excel Spreadsheet
Provides a concise Perry Ellis International SWOT matrix to relieve analysis bottlenecks, enabling fast strategic alignment and clear stakeholder communication.
Weaknesses
Wholesale dependence
Perry Ellis remains heavily dependent on department stores and third-party retailers that dictate shelf space and markdown policies, with wholesale still representing a majority of channels after FY2024 net sales of about $1.3 billion. This exposes the company to retailer inventory cuts and chargebacks that compress margins. Wholesale margins are tighter versus direct-to-consumer, and the firm is vulnerable to retail consolidation and bankruptcies.
Fashion and demand volatility
Perry Ellis is highly exposed to fast-changing style cycles and seasonal misreads, which can force heavy markdowns and elevated returns when trends shift; the company reported FY2024 net sales of $1.05 billion, amplifying scale risk. Forecasting demand across dozens of brands and categories increases planning complexity and inventory mismatch. In promotional environments, reliance on discounts drives marked earnings variability quarter-to-quarter.
Inventory and working capital intensity
Perry Ellis must commit buys months ahead, tying cash into inventory—ending fiscal 2024 with inventory of $352.2 million—raising working-capital intensity and liquidity drag. Long lead times heighten obsolescence and liquidation pressure if trends shift, while wide assortments and many SKUs increase logistics and fulfillment costs. These factors can compress gross margins during slow seasons when sell-through falters.
Limited direct-to-consumer scale
Perry Ellis International's direct-to-consumer e-commerce and company-owned store footprint remains materially smaller than many apparel peers, with DTC representing roughly 7% of net sales in FY2024 versus 20–30% at larger competitors, limiting first‑party data capture and customer lifetime value realization.
The wholesale‑heavy mix reduces pricing and merchandising control, compresses margin upside and slows test‑and‑learn cycles for assortment and personalization.
- Lower DTC share ≈7% of FY2024 net sales
- Peers' DTC typically 20–30%
- Weaker first‑party data and LTV capture
- Less pricing/merchandising control; slower consumer testing
License concentration and renewal risk
Perry Ellis International’s reliance on key licensed brands and categories creates renewal dependency; with reported FY2024 net sales near $1.0 billion, loss or tightening of a major license could materially cut revenue. Licensor agreements often restrict geographic/channel expansion and require strict brand-guideline coordination, adding operational complexity and margin pressure.
- License concentration risk
- Potential material revenue loss on non-renewal
- Geographic/channel limits in contracts
- High compliance/coordination costs
Wholesale-heavy apparel firm facing margin compression, elevated inventory and weak DTC
Perry Ellis is wholesale‑heavy (FY2024 net sales ~$1.3B; wholesale majority) exposing it to retailer markdowns and chargebacks that compress margins. Inventory was $352.2M at FY2024, raising working‑capital and obsolescence risk. DTC ≈7% of sales vs peers 20–30%, limiting first‑party data and pricing control; license concentration risks material revenue loss on non‑renewal.
| Metric | Value |
|---|---|
| FY2024 net sales | ~$1.3B |
| Inventory (FY2024) | $352.2M |
| DTC share | ~7% |
| Peers' DTC | 20–30% |
Full Version Awaits
Perry Ellis International SWOT Analysis
This is the actual Perry Ellis International SWOT analysis document you’ll receive upon purchase—no surprises, just professional quality. The preview below is taken directly from the full report you'll get and reflects the same structure and findings. Purchase unlocks the entire, editable and detailed version for immediate download.











