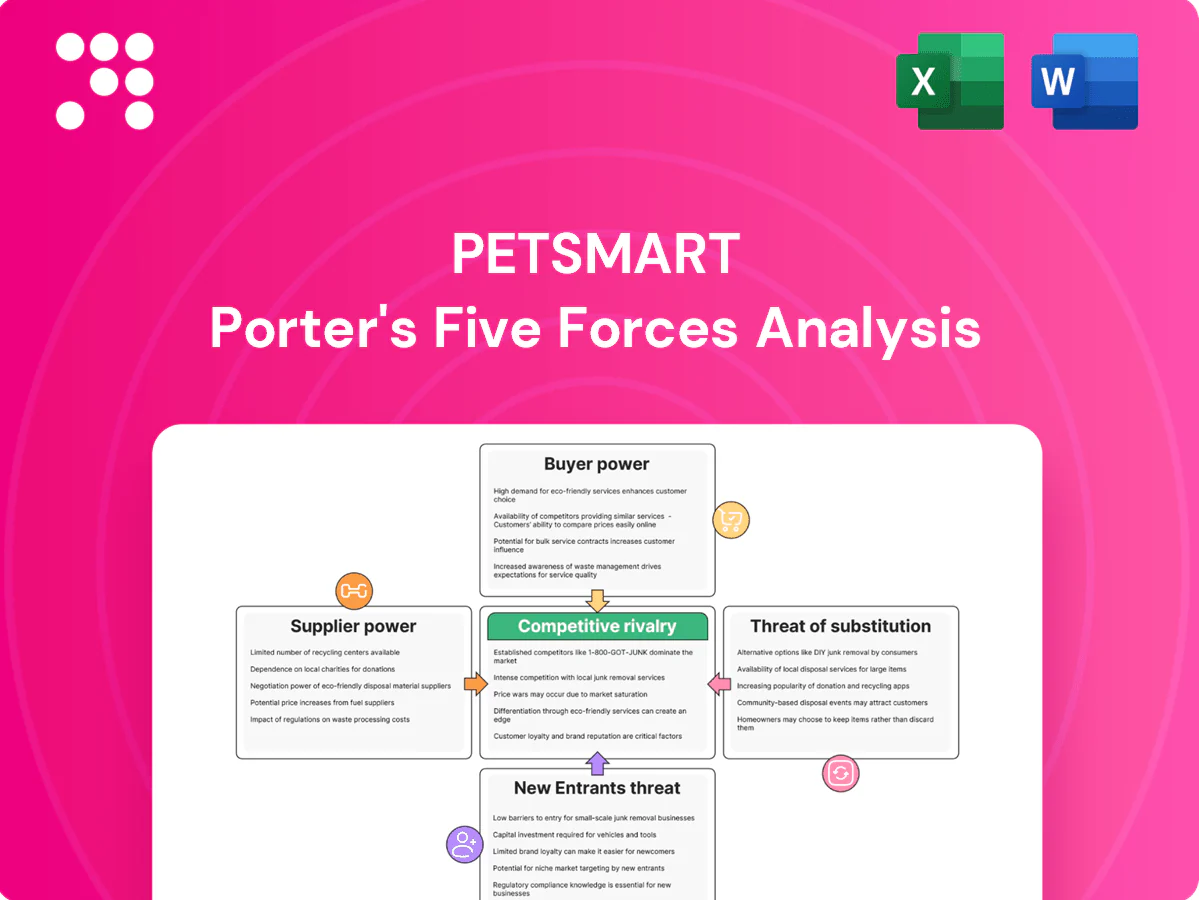
Petsmart Porter's Five Forces Analysis

Don't Miss the Bigger Picture
Petsmart navigates strong competitive rivalry from Petco and e-commerce, moderate supplier influence, growing substitute threats from online retailers and private-label brands, and limited but present entry threats due to scale advantages and real-estate costs. This brief snapshot only scratches the surface. Unlock the full Porter's Five Forces Analysis to explore Petsmart’s competitive dynamics, market pressures, and strategic advantages in detail.
Suppliers Bargaining Power

Branded pet food concentration
Leading CPG pet brands are concentrated—Mars and Nestlé Purina together control roughly 60–65% of the US pet food market in 2024, giving them leverage on pricing, placement, and promotions. Exclusive formulas and prescription diets, which account for about 10–12% of pet food sales, limit substitutability. PetSmart offsets this with scale negotiations and category management, but dependence on top brands keeps supplier power moderate. Expansion of private label (specialty channel share near 10% in 2024) is a key counterweight.
Private label and exclusives
Private label and exclusive SKUs like Top Paw and WholeHearted reduce PetSmart's dependence on national brands and improve margins by capturing retail markup. Control over specs and sourcing lowers supplier bargaining power through tailored contracts and direct procurement. Maintaining consistent quality and supply continuity demands multi-sourcing and QA investment, but rising private-label penetration shifts leverage toward PetSmart.

Services and vet partnership dependency
In-store Banfield Pet Hospital and third-party service vendors create partner-dependency risks, with Banfield operating more than 1,000 in-store hospitals as of 2024, giving partners negotiating leverage via contract terms, brand alignment, and co-location economics. PetSmart offsets this by driving traffic through diversified services such as grooming and training. Renegotiation risk is managed via performance metrics and long-term agreements.

Logistics and commodity exposure
Input cost swings in proteins, grains, packaging and freight drove margin pressure in 2024, as retail fuel/diesel volatility raised inbound freight costs; when supplier capacity tightens vendors often favor higher-margin foodservice and CPG channels over pet retail. PetSmart’s scale—about 1,650 stores and a national DC/replenishment network—plus replenishment tech and long-term purchase plans help secure allocations and blunt supplier leverage.
- Scale: ~1,650 stores (2024)
- DC network/replenishment tech secures allocations
- Long-term contracts & vendor scorecards reduce supplier leverage
- Freight and commodity swings remain primary cost risk
Switching costs and brand equity
Pet owners’ loyalty to specific formulas (taste, sensitivities) gives branded suppliers pull-through power, with APPA estimating the US pet food and supplies market at about $62 billion in 2024, raising delisting risk of customer churn and supplier bargaining strength. PetSmart counters via cross-brand promotions and in-store nutritional counseling to enable safe trade-offs. Wide assortment preserves choice and negotiating flexibility.
- Brand loyalty: high pull-through
- Delisting risk: raises supplier leverage
- Defenses: promos + counseling
- Assortment: negotiation buffer
Branded suppliers hold leverage; retailer scale, private label and clinics counterbalance
Branded suppliers (Mars, Nestlé Purina ~60–65% US pet food 2024) and prescription lines (10–12%) give suppliers moderate-to-high leverage; PetSmart offsets via scale (~1,650 stores), private label (~10%) and DC/replenishment networks. Banfield (>1,000 in-store hospitals) and commodity-driven freight swings sustain supplier negotiation pressure.
| Metric | 2024 |
|---|---|
| Top brand share | 60–65% |
| Prescription/limited substitutability | 10–12% |
| PetSmart stores | ~1,650 |
| Private label | ~10% |
| Banfield clinics | >1,000 |
| US market size | $62B |
What is included in the product
 Detailed Word Document
Tailored exclusively for Petsmart, this Porter’s Five Forces overview analyzes its competitive position, customer and supplier influence, and barriers protecting incumbents. It evaluates buyer/supplier power, threat of substitutes and new entrants, and identifies disruptive forces that could erode market share.

 Customizable Excel Spreadsheet
One-sheet Porter's Five Forces for PetSmart that highlights sourcing, retail competition, and supplier dynamics—perfect for swift strategic decisions; customize force levels and swap in your own data to reflect promotions, e-commerce shifts, or private-label moves.
Customers Bargaining Power

Price transparency and comparison
Customers can instantly compare PetSmart prices with Chewy (Chewy net sales $8.08B in FY2023), Amazon (estimated 38% share of US e-commerce in 2024), Walmart and Target, raising price elasticity and deal-seeking. High online visibility drives churn; PetSmart counters with price-matching, a loyalty program and autoship subscriptions. Promotions and recurring orders reduce buyer bargaining power by locking repeat spend and lowering switch rates.
Omnichannel expectations
Shoppers now expect BOPIS, same-day delivery, and frictionless returns, and low switching costs make service slippage costly as buyers can easily migrate to competitors. PetSmart’s roughly 1,650-store footprint across North America plus same-day fulfillment via partners such as Instacart strengthens last-mile speed and convenience. Strong omnichannel execution raises perceived value and reduces buyer leverage by making switching less attractive.

Service stickiness vs. DIY alternatives
Grooming, training and day care drive recurring visits and relationship depth for PetSmart, leveraging its ~1,650 North American stores (2024) to embed schedules, staff familiarity and pet comfort as switching costs.
DIY grooming, online training apps and local boutiques remain lower-cost alternatives, maintaining buyer leverage.
Membership bundles and bundled services increase lifetime value and further curb customer bargaining power.

Product differentiation and pet health
Needs-based diets and health-driven purchases reduce price sensitivity as owners prioritize outcomes; US pet spending reached about 139 billion in 2024, with premium food and health categories growing ~7.5% YoY. Associates’ expertise and vet-adjacent services at Petsmart boost trust and upsell, shifting leverage away from buyers. Education content and personalized recommendations further lock in demand and lower customer bargaining power.
- Reduced price sensitivity — health outcomes prioritized
- Trust via associates & vet services — higher switching costs
- Content & personalization — stronger retention
- Category growth ~7.5% in 2024 — less buyer leverage
Loyalty and subscriptions
Loyalty and subscription tools—Autoship, points programs, and tailored offers—cut comparison shopping by creating recurring purchase flows; Autoship historically drove roughly half of Chewy’s e-commerce sales, illustrating category stickiness. Data-driven retention (personalized offers, churn analytics) steadily reduces effective buyer power, while breakage, perks, and convenience lock in repeat purchasing and raise customer LTV. U.S. pet spending topped $140B in 2024, amplifying the value of captive customers.
- Autoship: recurring orders reduce visit frequency
- Points & perks: increase retention and breakage
- Data-driven offers: lower buyer price sensitivity
- Result: more captive, higher-LTV customer base
Moderate customer power amid strong omnichannel reach, autoship and premium pet spend growth
Customers wield moderate bargaining power: easy price/feature comparison with Chewy (net sales $8.08B FY2023) and Amazon (~38% US e‑commerce share 2024) raises elasticity, but PetSmart’s ~1,650 stores (2024), autoship, loyalty and services reduce churn. US pet spend ~$140B in 2024 with premium categories +7.5% YoY, lowering pure price sensitivity.
| Metric | Value |
|---|---|
| PetSmart stores | ~1,650 (2024) |
| Chewy sales | $8.08B (FY2023) |
| US e‑commerce leader | Amazon ~38% (2024) |
| US pet spend | ~$140B (2024) |
| Premium growth | +7.5% YoY (2024) |
Same Document Delivered
Petsmart Porter's Five Forces Analysis
This preview shows the exact document you'll receive immediately after purchase—no surprises, no placeholders. The Petsmart Porter’s Five Forces Analysis evaluates supplier and buyer power, competitive rivalry, threat of substitutes and barriers to entry, providing concise, data-driven insights. It concludes with strategic implications and actionable recommendations you can use immediately.

Don't Miss the Bigger Picture
Petsmart navigates strong competitive rivalry from Petco and e-commerce, moderate supplier influence, growing substitute threats from online retailers and private-label brands, and limited but present entry threats due to scale advantages and real-estate costs. This brief snapshot only scratches the surface. Unlock the full Porter's Five Forces Analysis to explore Petsmart’s competitive dynamics, market pressures, and strategic advantages in detail.
Suppliers Bargaining Power
Branded pet food concentration
Leading CPG pet brands are concentrated—Mars and Nestlé Purina together control roughly 60–65% of the US pet food market in 2024, giving them leverage on pricing, placement, and promotions. Exclusive formulas and prescription diets, which account for about 10–12% of pet food sales, limit substitutability. PetSmart offsets this with scale negotiations and category management, but dependence on top brands keeps supplier power moderate. Expansion of private label (specialty channel share near 10% in 2024) is a key counterweight.
Private label and exclusives
Private label and exclusive SKUs like Top Paw and WholeHearted reduce PetSmart's dependence on national brands and improve margins by capturing retail markup. Control over specs and sourcing lowers supplier bargaining power through tailored contracts and direct procurement. Maintaining consistent quality and supply continuity demands multi-sourcing and QA investment, but rising private-label penetration shifts leverage toward PetSmart.
Services and vet partnership dependency
In-store Banfield Pet Hospital and third-party service vendors create partner-dependency risks, with Banfield operating more than 1,000 in-store hospitals as of 2024, giving partners negotiating leverage via contract terms, brand alignment, and co-location economics. PetSmart offsets this by driving traffic through diversified services such as grooming and training. Renegotiation risk is managed via performance metrics and long-term agreements.
Logistics and commodity exposure
Input cost swings in proteins, grains, packaging and freight drove margin pressure in 2024, as retail fuel/diesel volatility raised inbound freight costs; when supplier capacity tightens vendors often favor higher-margin foodservice and CPG channels over pet retail. PetSmart’s scale—about 1,650 stores and a national DC/replenishment network—plus replenishment tech and long-term purchase plans help secure allocations and blunt supplier leverage.
- Scale: ~1,650 stores (2024)
- DC network/replenishment tech secures allocations
- Long-term contracts & vendor scorecards reduce supplier leverage
- Freight and commodity swings remain primary cost risk
Switching costs and brand equity
Pet owners’ loyalty to specific formulas (taste, sensitivities) gives branded suppliers pull-through power, with APPA estimating the US pet food and supplies market at about $62 billion in 2024, raising delisting risk of customer churn and supplier bargaining strength. PetSmart counters via cross-brand promotions and in-store nutritional counseling to enable safe trade-offs. Wide assortment preserves choice and negotiating flexibility.
- Brand loyalty: high pull-through
- Delisting risk: raises supplier leverage
- Defenses: promos + counseling
- Assortment: negotiation buffer
Branded suppliers hold leverage; retailer scale, private label and clinics counterbalance
Branded suppliers (Mars, Nestlé Purina ~60–65% US pet food 2024) and prescription lines (10–12%) give suppliers moderate-to-high leverage; PetSmart offsets via scale (~1,650 stores), private label (~10%) and DC/replenishment networks. Banfield (>1,000 in-store hospitals) and commodity-driven freight swings sustain supplier negotiation pressure.
| Metric | 2024 |
|---|---|
| Top brand share | 60–65% |
| Prescription/limited substitutability | 10–12% |
| PetSmart stores | ~1,650 |
| Private label | ~10% |
| Banfield clinics | >1,000 |
| US market size | $62B |
What is included in the product
Detailed Word Document
Tailored exclusively for Petsmart, this Porter’s Five Forces overview analyzes its competitive position, customer and supplier influence, and barriers protecting incumbents. It evaluates buyer/supplier power, threat of substitutes and new entrants, and identifies disruptive forces that could erode market share.
Customizable Excel Spreadsheet
One-sheet Porter's Five Forces for PetSmart that highlights sourcing, retail competition, and supplier dynamics—perfect for swift strategic decisions; customize force levels and swap in your own data to reflect promotions, e-commerce shifts, or private-label moves.
Customers Bargaining Power
Price transparency and comparison
Customers can instantly compare PetSmart prices with Chewy (Chewy net sales $8.08B in FY2023), Amazon (estimated 38% share of US e-commerce in 2024), Walmart and Target, raising price elasticity and deal-seeking. High online visibility drives churn; PetSmart counters with price-matching, a loyalty program and autoship subscriptions. Promotions and recurring orders reduce buyer bargaining power by locking repeat spend and lowering switch rates.
Omnichannel expectations
Shoppers now expect BOPIS, same-day delivery, and frictionless returns, and low switching costs make service slippage costly as buyers can easily migrate to competitors. PetSmart’s roughly 1,650-store footprint across North America plus same-day fulfillment via partners such as Instacart strengthens last-mile speed and convenience. Strong omnichannel execution raises perceived value and reduces buyer leverage by making switching less attractive.
Service stickiness vs. DIY alternatives
Grooming, training and day care drive recurring visits and relationship depth for PetSmart, leveraging its ~1,650 North American stores (2024) to embed schedules, staff familiarity and pet comfort as switching costs.
DIY grooming, online training apps and local boutiques remain lower-cost alternatives, maintaining buyer leverage.
Membership bundles and bundled services increase lifetime value and further curb customer bargaining power.
Product differentiation and pet health
Needs-based diets and health-driven purchases reduce price sensitivity as owners prioritize outcomes; US pet spending reached about 139 billion in 2024, with premium food and health categories growing ~7.5% YoY. Associates’ expertise and vet-adjacent services at Petsmart boost trust and upsell, shifting leverage away from buyers. Education content and personalized recommendations further lock in demand and lower customer bargaining power.
- Reduced price sensitivity — health outcomes prioritized
- Trust via associates & vet services — higher switching costs
- Content & personalization — stronger retention
- Category growth ~7.5% in 2024 — less buyer leverage
Loyalty and subscriptions
Loyalty and subscription tools—Autoship, points programs, and tailored offers—cut comparison shopping by creating recurring purchase flows; Autoship historically drove roughly half of Chewy’s e-commerce sales, illustrating category stickiness. Data-driven retention (personalized offers, churn analytics) steadily reduces effective buyer power, while breakage, perks, and convenience lock in repeat purchasing and raise customer LTV. U.S. pet spending topped $140B in 2024, amplifying the value of captive customers.
- Autoship: recurring orders reduce visit frequency
- Points & perks: increase retention and breakage
- Data-driven offers: lower buyer price sensitivity
- Result: more captive, higher-LTV customer base
Moderate customer power amid strong omnichannel reach, autoship and premium pet spend growth
Customers wield moderate bargaining power: easy price/feature comparison with Chewy (net sales $8.08B FY2023) and Amazon (~38% US e‑commerce share 2024) raises elasticity, but PetSmart’s ~1,650 stores (2024), autoship, loyalty and services reduce churn. US pet spend ~$140B in 2024 with premium categories +7.5% YoY, lowering pure price sensitivity.
| Metric | Value |
|---|---|
| PetSmart stores | ~1,650 (2024) |
| Chewy sales | $8.08B (FY2023) |
| US e‑commerce leader | Amazon ~38% (2024) |
| US pet spend | ~$140B (2024) |
| Premium growth | +7.5% YoY (2024) |
Same Document Delivered
Petsmart Porter's Five Forces Analysis
This preview shows the exact document you'll receive immediately after purchase—no surprises, no placeholders. The Petsmart Porter’s Five Forces Analysis evaluates supplier and buyer power, competitive rivalry, threat of substitutes and barriers to entry, providing concise, data-driven insights. It concludes with strategic implications and actionable recommendations you can use immediately.
Description
Don't Miss the Bigger Picture
Petsmart navigates strong competitive rivalry from Petco and e-commerce, moderate supplier influence, growing substitute threats from online retailers and private-label brands, and limited but present entry threats due to scale advantages and real-estate costs. This brief snapshot only scratches the surface. Unlock the full Porter's Five Forces Analysis to explore Petsmart’s competitive dynamics, market pressures, and strategic advantages in detail.
Suppliers Bargaining Power
Branded pet food concentration
Leading CPG pet brands are concentrated—Mars and Nestlé Purina together control roughly 60–65% of the US pet food market in 2024, giving them leverage on pricing, placement, and promotions. Exclusive formulas and prescription diets, which account for about 10–12% of pet food sales, limit substitutability. PetSmart offsets this with scale negotiations and category management, but dependence on top brands keeps supplier power moderate. Expansion of private label (specialty channel share near 10% in 2024) is a key counterweight.
Private label and exclusives
Private label and exclusive SKUs like Top Paw and WholeHearted reduce PetSmart's dependence on national brands and improve margins by capturing retail markup. Control over specs and sourcing lowers supplier bargaining power through tailored contracts and direct procurement. Maintaining consistent quality and supply continuity demands multi-sourcing and QA investment, but rising private-label penetration shifts leverage toward PetSmart.
Services and vet partnership dependency
In-store Banfield Pet Hospital and third-party service vendors create partner-dependency risks, with Banfield operating more than 1,000 in-store hospitals as of 2024, giving partners negotiating leverage via contract terms, brand alignment, and co-location economics. PetSmart offsets this by driving traffic through diversified services such as grooming and training. Renegotiation risk is managed via performance metrics and long-term agreements.
Logistics and commodity exposure
Input cost swings in proteins, grains, packaging and freight drove margin pressure in 2024, as retail fuel/diesel volatility raised inbound freight costs; when supplier capacity tightens vendors often favor higher-margin foodservice and CPG channels over pet retail. PetSmart’s scale—about 1,650 stores and a national DC/replenishment network—plus replenishment tech and long-term purchase plans help secure allocations and blunt supplier leverage.
- Scale: ~1,650 stores (2024)
- DC network/replenishment tech secures allocations
- Long-term contracts & vendor scorecards reduce supplier leverage
- Freight and commodity swings remain primary cost risk
Switching costs and brand equity
Pet owners’ loyalty to specific formulas (taste, sensitivities) gives branded suppliers pull-through power, with APPA estimating the US pet food and supplies market at about $62 billion in 2024, raising delisting risk of customer churn and supplier bargaining strength. PetSmart counters via cross-brand promotions and in-store nutritional counseling to enable safe trade-offs. Wide assortment preserves choice and negotiating flexibility.
- Brand loyalty: high pull-through
- Delisting risk: raises supplier leverage
- Defenses: promos + counseling
- Assortment: negotiation buffer
Branded suppliers hold leverage; retailer scale, private label and clinics counterbalance
Branded suppliers (Mars, Nestlé Purina ~60–65% US pet food 2024) and prescription lines (10–12%) give suppliers moderate-to-high leverage; PetSmart offsets via scale (~1,650 stores), private label (~10%) and DC/replenishment networks. Banfield (>1,000 in-store hospitals) and commodity-driven freight swings sustain supplier negotiation pressure.
| Metric | 2024 |
|---|---|
| Top brand share | 60–65% |
| Prescription/limited substitutability | 10–12% |
| PetSmart stores | ~1,650 |
| Private label | ~10% |
| Banfield clinics | >1,000 |
| US market size | $62B |
What is included in the product
Detailed Word Document
Tailored exclusively for Petsmart, this Porter’s Five Forces overview analyzes its competitive position, customer and supplier influence, and barriers protecting incumbents. It evaluates buyer/supplier power, threat of substitutes and new entrants, and identifies disruptive forces that could erode market share.
Customizable Excel Spreadsheet
One-sheet Porter's Five Forces for PetSmart that highlights sourcing, retail competition, and supplier dynamics—perfect for swift strategic decisions; customize force levels and swap in your own data to reflect promotions, e-commerce shifts, or private-label moves.
Customers Bargaining Power
Price transparency and comparison
Customers can instantly compare PetSmart prices with Chewy (Chewy net sales $8.08B in FY2023), Amazon (estimated 38% share of US e-commerce in 2024), Walmart and Target, raising price elasticity and deal-seeking. High online visibility drives churn; PetSmart counters with price-matching, a loyalty program and autoship subscriptions. Promotions and recurring orders reduce buyer bargaining power by locking repeat spend and lowering switch rates.
Omnichannel expectations
Shoppers now expect BOPIS, same-day delivery, and frictionless returns, and low switching costs make service slippage costly as buyers can easily migrate to competitors. PetSmart’s roughly 1,650-store footprint across North America plus same-day fulfillment via partners such as Instacart strengthens last-mile speed and convenience. Strong omnichannel execution raises perceived value and reduces buyer leverage by making switching less attractive.
Service stickiness vs. DIY alternatives
Grooming, training and day care drive recurring visits and relationship depth for PetSmart, leveraging its ~1,650 North American stores (2024) to embed schedules, staff familiarity and pet comfort as switching costs.
DIY grooming, online training apps and local boutiques remain lower-cost alternatives, maintaining buyer leverage.
Membership bundles and bundled services increase lifetime value and further curb customer bargaining power.
Product differentiation and pet health
Needs-based diets and health-driven purchases reduce price sensitivity as owners prioritize outcomes; US pet spending reached about 139 billion in 2024, with premium food and health categories growing ~7.5% YoY. Associates’ expertise and vet-adjacent services at Petsmart boost trust and upsell, shifting leverage away from buyers. Education content and personalized recommendations further lock in demand and lower customer bargaining power.
- Reduced price sensitivity — health outcomes prioritized
- Trust via associates & vet services — higher switching costs
- Content & personalization — stronger retention
- Category growth ~7.5% in 2024 — less buyer leverage
Loyalty and subscriptions
Loyalty and subscription tools—Autoship, points programs, and tailored offers—cut comparison shopping by creating recurring purchase flows; Autoship historically drove roughly half of Chewy’s e-commerce sales, illustrating category stickiness. Data-driven retention (personalized offers, churn analytics) steadily reduces effective buyer power, while breakage, perks, and convenience lock in repeat purchasing and raise customer LTV. U.S. pet spending topped $140B in 2024, amplifying the value of captive customers.
- Autoship: recurring orders reduce visit frequency
- Points & perks: increase retention and breakage
- Data-driven offers: lower buyer price sensitivity
- Result: more captive, higher-LTV customer base
Moderate customer power amid strong omnichannel reach, autoship and premium pet spend growth
Customers wield moderate bargaining power: easy price/feature comparison with Chewy (net sales $8.08B FY2023) and Amazon (~38% US e‑commerce share 2024) raises elasticity, but PetSmart’s ~1,650 stores (2024), autoship, loyalty and services reduce churn. US pet spend ~$140B in 2024 with premium categories +7.5% YoY, lowering pure price sensitivity.
| Metric | Value |
|---|---|
| PetSmart stores | ~1,650 (2024) |
| Chewy sales | $8.08B (FY2023) |
| US e‑commerce leader | Amazon ~38% (2024) |
| US pet spend | ~$140B (2024) |
| Premium growth | +7.5% YoY (2024) |
Same Document Delivered
Petsmart Porter's Five Forces Analysis
This preview shows the exact document you'll receive immediately after purchase—no surprises, no placeholders. The Petsmart Porter’s Five Forces Analysis evaluates supplier and buyer power, competitive rivalry, threat of substitutes and barriers to entry, providing concise, data-driven insights. It concludes with strategic implications and actionable recommendations you can use immediately.











