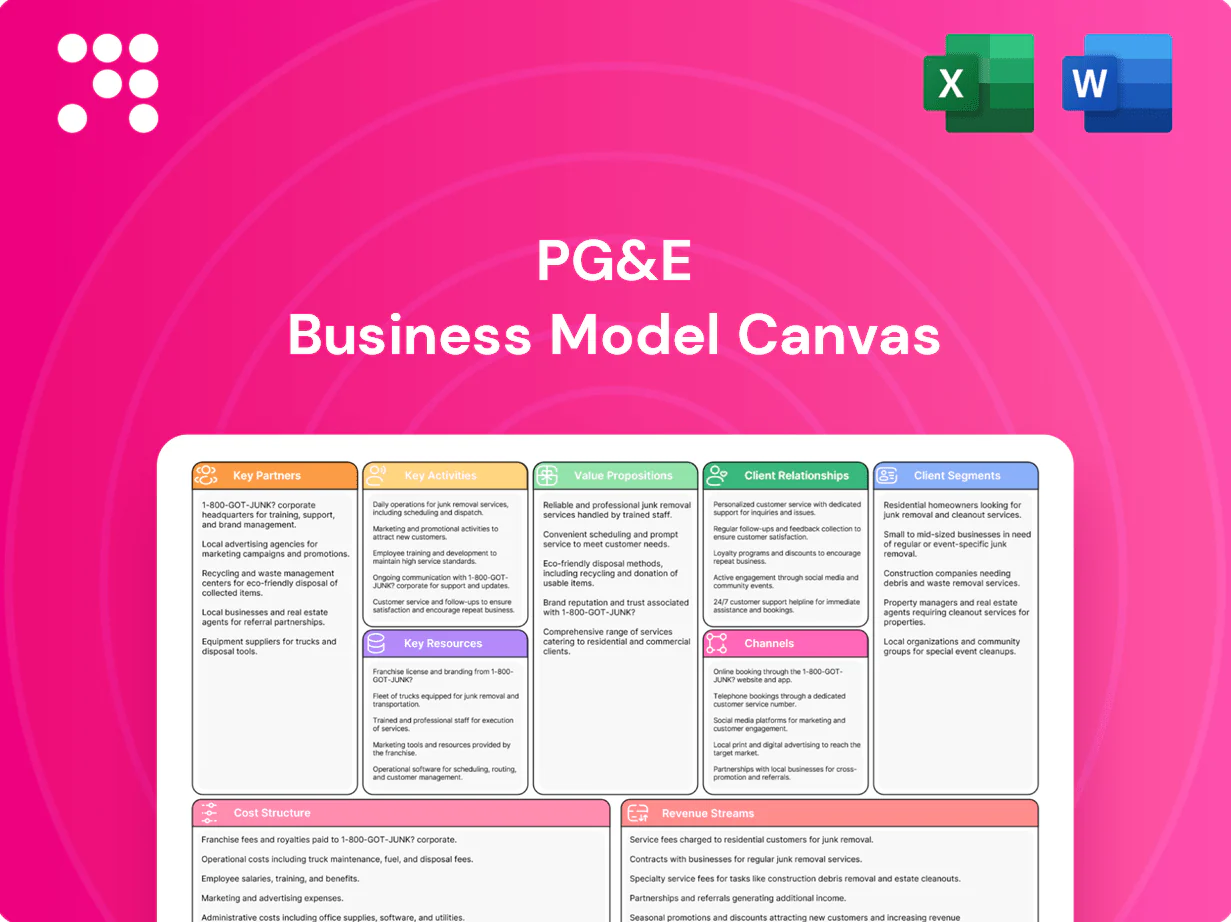
PG&E Business Model Canvas

Unlock the strategic blueprint of a major utility: value creation, risk, and revenue models
Unlock the full strategic blueprint behind PG&E’s business model. This concise Business Model Canvas reveals how PG&E creates value, manages infrastructure and regulatory risk, and monetizes services across customer segments. Ideal for investors, consultants, and founders—download the complete Word/Excel canvas to benchmark, adapt, and act.
Partnerships

Regulators & System Operators
Partnerships with CPUC, FERC and CAISO shape PG&E rates, reliability standards and real-time grid dispatch; PG&E serves ~16 million people and ~5.5 million electric customers, while CAISO manages roughly 80% of California load. Regulatory collaboration secures cost recovery for safety and grid investments and enforces compliance. System operator coordination balances supply/demand and integrates renewables, underpinning the utility’s license to operate.
Renewable & Conventional IPPs
Independent power producers supply energy to PG&E under PPAs to help meet load for its ~5.5 million customers and California’s RPS target of 60% by 2030.
Diverse counterparties reduce supply risk and enable flexible procurement across market conditions.
Long-term contracts stabilize prices and hedge fuel volatility while collaboration accelerates decarbonization and preserves reliability.

Equipment Vendors & EPC Contractors
Manufacturers and EPC firms deliver substations, transformers, line reconductoring and pipeline upgrades, executing PG&E’s large-scale projects. Strategic sourcing governs quality, safety and on-time delivery across the supply chain. These partnerships underpin PG&E’s 2024 capital plan of about $5.3 billion for grid modernization. Vendor ecosystems enable technology refresh at scale, supporting equipment standardization and lifecycle replacement.

Technology & Data Providers
Technology and data partnerships—AMI, DERMS, EMS/SCADA, cybersecurity and analytics—power PG&Es digital grid operations, leveraging over 5.5 million smart meters across a customer base serving about 16 million people (2024). Data platforms enable outage management, asset health monitoring and wildfire risk modeling; cloud and edge solutions boost situational awareness and automation, reducing response times and improving customer experience.
- AMI: 5.5 million smart meters
- DERMS/SCADA: real-time control for distributed resources
- Cybersecurity: protects grid integrity
- Cloud/edge: faster automation and visibility
Municipalities & Emergency Services
Coordination with cities, counties and fire agencies manages public safety power shutoffs and wildfire response for PG&E, which serves about 5.5 million customer accounts and roughly 16 million people in Northern and Central California. Joint planning streamlines permitting and right-of-way access for faster infrastructure hardening and vegetation management. Community partnerships improve resilience and emergency communication, reducing restoration time and overall customer impacts.
- Customer base: 5.5 million accounts / ~16 million people
- Focus: PSPS coordination, wildfire response, vegetation management
- Benefit: Faster permitting, ROW access, reduced outages
- Outcome: Improved emergency comms and lower customer impact
Regulators, IPPs, vendors and tech secure grid reliability, 60% RPS and $5.3B capex
Regulators (CPUC, FERC, CAISO) set rates, reliability and dispatch affecting PG&E’s service to ~5.5M accounts (~16M people) in 2024.
IPPs and PPAs secure generation to meet California’s 60% RPS-by-2030 target and hedge volatility.
Vendors execute a $5.3B 2024 capital plan for grid hardening and equipment lifecycle.
Tech partners enable 5.5M smart meters, DER integration, outage and wildfire analytics.
| Partner | Role | 2024 metric |
|---|---|---|
| Regulators/ISO | Rates, dispatch | 16M people served |
| IPPs/PPAs | Supply, RPS | 60% RPS target |
| Vendors | Construction | $5.3B capex |
| Tech | Grid ops | 5.5M smart meters |
What is included in the product
 Detailed Word Document
A concise, pre-written Business Model Canvas for PG&E that maps its 9 classic blocks—customer segments, value propositions, channels, customer relationships, revenue streams, key resources, key activities, key partners, and cost structure—while reflecting regulated utility operations, asset-heavy infrastructure, wildfire and regulatory risks, competitive advantages, and investor-grade insights for presentations and strategic decision-making.

 Customizable Excel Spreadsheet
High-level view of PG&E’s business model with editable cells that quickly highlights regulatory, operational, and customer pain points to streamline strategic planning. Clean, shareable layout saves hours and enables team collaboration for faster risk mitigation and decision-making.
Activities

Generation & Energy Procurement
Operate owned nuclear (Diablo Canyon 2,256 MW), hydro and solar assets while contracting additional supply to serve ~5.5 million electric customers. Optimize dispatch and financial hedges to meet load reliably and limit peak exposure. Manage fuel, water and emissions constraints across units. Align portfolio with California mandates (60% RPS by 2030, SB100 target 100% clean by 2045).
Transmission & Distribution Operations
PG&E runs high-voltage transmission and local distribution networks 24/7 for roughly 5.5 million electric customers (about 16 million people), monitoring grid conditions and executing switching, maintenance and restoration in real time. Operations integrate distributed energy resources and rising EV load — California had over 1.5 million EVs and ~1.6 million distributed PV systems by 2024 — while maintaining power quality. PG&E coordinates continuously with CAISO for reliability and congestion management.

Wildfire Mitigation & Safety
Execute vegetation management, system hardening, and covered conductor deployments across PG&E’s network serving 5.5 million electric customers (about 16 million people), using dense weather stations, probabilistic risk modeling and PSPS protocols refined since 2019. Enhance inspection cycles with drones and LiDAR for targeted repairs, while training crews and auditing compliance rigorously.

Regulatory Management & Rate Cases
Regulatory management and rate cases drive filings to recover prudent costs and authorize capital plans, with PG&E pursuing 2024 filings to align revenue recovery with capital needs and multi-year frameworks. The team engages stakeholders and answers CPUC/FERC data requests, tracks compliance with CPUC decisions and FERC tariffs, and aligns investments to approved multi-year rate plans and forecasts.
- 2024 filings to recover costs and authorize capital
- Stakeholder engagement and data-response workflows
- Compliance tracking: CPUC decisions and FERC tariffs
- Investment alignment with approved multi-year frameworks
Customer Service & Programs
PG&E operates billing, collections and multi-channel support while delivering energy-efficiency, demand-response and EV charging programs, serving about 16 million Californians (≈5.5M electric, ≈4.5M gas customers in 2024); it provides targeted aid to low-income and medically vulnerable customers and issues outage, safety and pricing communications.
- Customers: ≈16M (≈5.5M electric, ≈4.5M gas)
- Services: billing, collections, omni-channel support
- Programs: energy efficiency, demand response, EV charging
- Assistance: low-income, medically vulnerable
- Comms: outages, safety, pricing changes
Operate 2,256 MW nuclear, serve ≈5.5M customers; integrate ≈1.5M EVs & ≈1.6M PVs
Operate generation (Diablo Canyon 2,256 MW), procure contracts and hedge to serve ≈5.5M electric customers; run 24/7 transmission/distribution and integrate ≈1.5M EVs and ≈1.6M PV systems (2024). Execute vegetation management, PSPS mitigation and regulatory filings to recover costs and align with 60% RPS by 2030, SB100 by 2045.
| Metric | 2024 |
|---|---|
| Electric customers | ≈5.5M |
| Gas customers | ≈4.5M |
| Diablo Canyon | 2,256 MW |
| EVs | ≈1.5M |
What You See Is What You Get
Business Model Canvas
The PG&E Business Model Canvas shown here is the exact document you will receive after purchase, not a mockup. This preview includes live content and structure identical to the final file. Upon ordering you’ll download the complete, editable deliverable ready for use in Word and Excel. No surprises—what you see is what you get.

Unlock the strategic blueprint of a major utility: value creation, risk, and revenue models
Unlock the full strategic blueprint behind PG&E’s business model. This concise Business Model Canvas reveals how PG&E creates value, manages infrastructure and regulatory risk, and monetizes services across customer segments. Ideal for investors, consultants, and founders—download the complete Word/Excel canvas to benchmark, adapt, and act.
Partnerships
Regulators & System Operators
Partnerships with CPUC, FERC and CAISO shape PG&E rates, reliability standards and real-time grid dispatch; PG&E serves ~16 million people and ~5.5 million electric customers, while CAISO manages roughly 80% of California load. Regulatory collaboration secures cost recovery for safety and grid investments and enforces compliance. System operator coordination balances supply/demand and integrates renewables, underpinning the utility’s license to operate.
Renewable & Conventional IPPs
Independent power producers supply energy to PG&E under PPAs to help meet load for its ~5.5 million customers and California’s RPS target of 60% by 2030.
Diverse counterparties reduce supply risk and enable flexible procurement across market conditions.
Long-term contracts stabilize prices and hedge fuel volatility while collaboration accelerates decarbonization and preserves reliability.
Equipment Vendors & EPC Contractors
Manufacturers and EPC firms deliver substations, transformers, line reconductoring and pipeline upgrades, executing PG&E’s large-scale projects. Strategic sourcing governs quality, safety and on-time delivery across the supply chain. These partnerships underpin PG&E’s 2024 capital plan of about $5.3 billion for grid modernization. Vendor ecosystems enable technology refresh at scale, supporting equipment standardization and lifecycle replacement.
Technology & Data Providers
Technology and data partnerships—AMI, DERMS, EMS/SCADA, cybersecurity and analytics—power PG&Es digital grid operations, leveraging over 5.5 million smart meters across a customer base serving about 16 million people (2024). Data platforms enable outage management, asset health monitoring and wildfire risk modeling; cloud and edge solutions boost situational awareness and automation, reducing response times and improving customer experience.
- AMI: 5.5 million smart meters
- DERMS/SCADA: real-time control for distributed resources
- Cybersecurity: protects grid integrity
- Cloud/edge: faster automation and visibility
Municipalities & Emergency Services
Coordination with cities, counties and fire agencies manages public safety power shutoffs and wildfire response for PG&E, which serves about 5.5 million customer accounts and roughly 16 million people in Northern and Central California. Joint planning streamlines permitting and right-of-way access for faster infrastructure hardening and vegetation management. Community partnerships improve resilience and emergency communication, reducing restoration time and overall customer impacts.
- Customer base: 5.5 million accounts / ~16 million people
- Focus: PSPS coordination, wildfire response, vegetation management
- Benefit: Faster permitting, ROW access, reduced outages
- Outcome: Improved emergency comms and lower customer impact
Regulators, IPPs, vendors and tech secure grid reliability, 60% RPS and $5.3B capex
Regulators (CPUC, FERC, CAISO) set rates, reliability and dispatch affecting PG&E’s service to ~5.5M accounts (~16M people) in 2024.
IPPs and PPAs secure generation to meet California’s 60% RPS-by-2030 target and hedge volatility.
Vendors execute a $5.3B 2024 capital plan for grid hardening and equipment lifecycle.
Tech partners enable 5.5M smart meters, DER integration, outage and wildfire analytics.
| Partner | Role | 2024 metric |
|---|---|---|
| Regulators/ISO | Rates, dispatch | 16M people served |
| IPPs/PPAs | Supply, RPS | 60% RPS target |
| Vendors | Construction | $5.3B capex |
| Tech | Grid ops | 5.5M smart meters |
What is included in the product
Detailed Word Document
A concise, pre-written Business Model Canvas for PG&E that maps its 9 classic blocks—customer segments, value propositions, channels, customer relationships, revenue streams, key resources, key activities, key partners, and cost structure—while reflecting regulated utility operations, asset-heavy infrastructure, wildfire and regulatory risks, competitive advantages, and investor-grade insights for presentations and strategic decision-making.
Customizable Excel Spreadsheet
High-level view of PG&E’s business model with editable cells that quickly highlights regulatory, operational, and customer pain points to streamline strategic planning. Clean, shareable layout saves hours and enables team collaboration for faster risk mitigation and decision-making.
Activities
Generation & Energy Procurement
Operate owned nuclear (Diablo Canyon 2,256 MW), hydro and solar assets while contracting additional supply to serve ~5.5 million electric customers. Optimize dispatch and financial hedges to meet load reliably and limit peak exposure. Manage fuel, water and emissions constraints across units. Align portfolio with California mandates (60% RPS by 2030, SB100 target 100% clean by 2045).
Transmission & Distribution Operations
PG&E runs high-voltage transmission and local distribution networks 24/7 for roughly 5.5 million electric customers (about 16 million people), monitoring grid conditions and executing switching, maintenance and restoration in real time. Operations integrate distributed energy resources and rising EV load — California had over 1.5 million EVs and ~1.6 million distributed PV systems by 2024 — while maintaining power quality. PG&E coordinates continuously with CAISO for reliability and congestion management.
Wildfire Mitigation & Safety
Execute vegetation management, system hardening, and covered conductor deployments across PG&E’s network serving 5.5 million electric customers (about 16 million people), using dense weather stations, probabilistic risk modeling and PSPS protocols refined since 2019. Enhance inspection cycles with drones and LiDAR for targeted repairs, while training crews and auditing compliance rigorously.
Regulatory Management & Rate Cases
Regulatory management and rate cases drive filings to recover prudent costs and authorize capital plans, with PG&E pursuing 2024 filings to align revenue recovery with capital needs and multi-year frameworks. The team engages stakeholders and answers CPUC/FERC data requests, tracks compliance with CPUC decisions and FERC tariffs, and aligns investments to approved multi-year rate plans and forecasts.
- 2024 filings to recover costs and authorize capital
- Stakeholder engagement and data-response workflows
- Compliance tracking: CPUC decisions and FERC tariffs
- Investment alignment with approved multi-year frameworks
Customer Service & Programs
PG&E operates billing, collections and multi-channel support while delivering energy-efficiency, demand-response and EV charging programs, serving about 16 million Californians (≈5.5M electric, ≈4.5M gas customers in 2024); it provides targeted aid to low-income and medically vulnerable customers and issues outage, safety and pricing communications.
- Customers: ≈16M (≈5.5M electric, ≈4.5M gas)
- Services: billing, collections, omni-channel support
- Programs: energy efficiency, demand response, EV charging
- Assistance: low-income, medically vulnerable
- Comms: outages, safety, pricing changes
Operate 2,256 MW nuclear, serve ≈5.5M customers; integrate ≈1.5M EVs & ≈1.6M PVs
Operate generation (Diablo Canyon 2,256 MW), procure contracts and hedge to serve ≈5.5M electric customers; run 24/7 transmission/distribution and integrate ≈1.5M EVs and ≈1.6M PV systems (2024). Execute vegetation management, PSPS mitigation and regulatory filings to recover costs and align with 60% RPS by 2030, SB100 by 2045.
| Metric | 2024 |
|---|---|
| Electric customers | ≈5.5M |
| Gas customers | ≈4.5M |
| Diablo Canyon | 2,256 MW |
| EVs | ≈1.5M |
What You See Is What You Get
Business Model Canvas
The PG&E Business Model Canvas shown here is the exact document you will receive after purchase, not a mockup. This preview includes live content and structure identical to the final file. Upon ordering you’ll download the complete, editable deliverable ready for use in Word and Excel. No surprises—what you see is what you get.
Original: $10.00
-65%$10.00
$3.50Description
Unlock the strategic blueprint of a major utility: value creation, risk, and revenue models
Unlock the full strategic blueprint behind PG&E’s business model. This concise Business Model Canvas reveals how PG&E creates value, manages infrastructure and regulatory risk, and monetizes services across customer segments. Ideal for investors, consultants, and founders—download the complete Word/Excel canvas to benchmark, adapt, and act.
Partnerships
Regulators & System Operators
Partnerships with CPUC, FERC and CAISO shape PG&E rates, reliability standards and real-time grid dispatch; PG&E serves ~16 million people and ~5.5 million electric customers, while CAISO manages roughly 80% of California load. Regulatory collaboration secures cost recovery for safety and grid investments and enforces compliance. System operator coordination balances supply/demand and integrates renewables, underpinning the utility’s license to operate.
Renewable & Conventional IPPs
Independent power producers supply energy to PG&E under PPAs to help meet load for its ~5.5 million customers and California’s RPS target of 60% by 2030.
Diverse counterparties reduce supply risk and enable flexible procurement across market conditions.
Long-term contracts stabilize prices and hedge fuel volatility while collaboration accelerates decarbonization and preserves reliability.
Equipment Vendors & EPC Contractors
Manufacturers and EPC firms deliver substations, transformers, line reconductoring and pipeline upgrades, executing PG&E’s large-scale projects. Strategic sourcing governs quality, safety and on-time delivery across the supply chain. These partnerships underpin PG&E’s 2024 capital plan of about $5.3 billion for grid modernization. Vendor ecosystems enable technology refresh at scale, supporting equipment standardization and lifecycle replacement.
Technology & Data Providers
Technology and data partnerships—AMI, DERMS, EMS/SCADA, cybersecurity and analytics—power PG&Es digital grid operations, leveraging over 5.5 million smart meters across a customer base serving about 16 million people (2024). Data platforms enable outage management, asset health monitoring and wildfire risk modeling; cloud and edge solutions boost situational awareness and automation, reducing response times and improving customer experience.
- AMI: 5.5 million smart meters
- DERMS/SCADA: real-time control for distributed resources
- Cybersecurity: protects grid integrity
- Cloud/edge: faster automation and visibility
Municipalities & Emergency Services
Coordination with cities, counties and fire agencies manages public safety power shutoffs and wildfire response for PG&E, which serves about 5.5 million customer accounts and roughly 16 million people in Northern and Central California. Joint planning streamlines permitting and right-of-way access for faster infrastructure hardening and vegetation management. Community partnerships improve resilience and emergency communication, reducing restoration time and overall customer impacts.
- Customer base: 5.5 million accounts / ~16 million people
- Focus: PSPS coordination, wildfire response, vegetation management
- Benefit: Faster permitting, ROW access, reduced outages
- Outcome: Improved emergency comms and lower customer impact
Regulators, IPPs, vendors and tech secure grid reliability, 60% RPS and $5.3B capex
Regulators (CPUC, FERC, CAISO) set rates, reliability and dispatch affecting PG&E’s service to ~5.5M accounts (~16M people) in 2024.
IPPs and PPAs secure generation to meet California’s 60% RPS-by-2030 target and hedge volatility.
Vendors execute a $5.3B 2024 capital plan for grid hardening and equipment lifecycle.
Tech partners enable 5.5M smart meters, DER integration, outage and wildfire analytics.
| Partner | Role | 2024 metric |
|---|---|---|
| Regulators/ISO | Rates, dispatch | 16M people served |
| IPPs/PPAs | Supply, RPS | 60% RPS target |
| Vendors | Construction | $5.3B capex |
| Tech | Grid ops | 5.5M smart meters |
What is included in the product
Detailed Word Document
A concise, pre-written Business Model Canvas for PG&E that maps its 9 classic blocks—customer segments, value propositions, channels, customer relationships, revenue streams, key resources, key activities, key partners, and cost structure—while reflecting regulated utility operations, asset-heavy infrastructure, wildfire and regulatory risks, competitive advantages, and investor-grade insights for presentations and strategic decision-making.
Customizable Excel Spreadsheet
High-level view of PG&E’s business model with editable cells that quickly highlights regulatory, operational, and customer pain points to streamline strategic planning. Clean, shareable layout saves hours and enables team collaboration for faster risk mitigation and decision-making.
Activities
Generation & Energy Procurement
Operate owned nuclear (Diablo Canyon 2,256 MW), hydro and solar assets while contracting additional supply to serve ~5.5 million electric customers. Optimize dispatch and financial hedges to meet load reliably and limit peak exposure. Manage fuel, water and emissions constraints across units. Align portfolio with California mandates (60% RPS by 2030, SB100 target 100% clean by 2045).
Transmission & Distribution Operations
PG&E runs high-voltage transmission and local distribution networks 24/7 for roughly 5.5 million electric customers (about 16 million people), monitoring grid conditions and executing switching, maintenance and restoration in real time. Operations integrate distributed energy resources and rising EV load — California had over 1.5 million EVs and ~1.6 million distributed PV systems by 2024 — while maintaining power quality. PG&E coordinates continuously with CAISO for reliability and congestion management.
Wildfire Mitigation & Safety
Execute vegetation management, system hardening, and covered conductor deployments across PG&E’s network serving 5.5 million electric customers (about 16 million people), using dense weather stations, probabilistic risk modeling and PSPS protocols refined since 2019. Enhance inspection cycles with drones and LiDAR for targeted repairs, while training crews and auditing compliance rigorously.
Regulatory Management & Rate Cases
Regulatory management and rate cases drive filings to recover prudent costs and authorize capital plans, with PG&E pursuing 2024 filings to align revenue recovery with capital needs and multi-year frameworks. The team engages stakeholders and answers CPUC/FERC data requests, tracks compliance with CPUC decisions and FERC tariffs, and aligns investments to approved multi-year rate plans and forecasts.
- 2024 filings to recover costs and authorize capital
- Stakeholder engagement and data-response workflows
- Compliance tracking: CPUC decisions and FERC tariffs
- Investment alignment with approved multi-year frameworks
Customer Service & Programs
PG&E operates billing, collections and multi-channel support while delivering energy-efficiency, demand-response and EV charging programs, serving about 16 million Californians (≈5.5M electric, ≈4.5M gas customers in 2024); it provides targeted aid to low-income and medically vulnerable customers and issues outage, safety and pricing communications.
- Customers: ≈16M (≈5.5M electric, ≈4.5M gas)
- Services: billing, collections, omni-channel support
- Programs: energy efficiency, demand response, EV charging
- Assistance: low-income, medically vulnerable
- Comms: outages, safety, pricing changes
Operate 2,256 MW nuclear, serve ≈5.5M customers; integrate ≈1.5M EVs & ≈1.6M PVs
Operate generation (Diablo Canyon 2,256 MW), procure contracts and hedge to serve ≈5.5M electric customers; run 24/7 transmission/distribution and integrate ≈1.5M EVs and ≈1.6M PV systems (2024). Execute vegetation management, PSPS mitigation and regulatory filings to recover costs and align with 60% RPS by 2030, SB100 by 2045.
| Metric | 2024 |
|---|---|
| Electric customers | ≈5.5M |
| Gas customers | ≈4.5M |
| Diablo Canyon | 2,256 MW |
| EVs | ≈1.5M |
What You See Is What You Get
Business Model Canvas
The PG&E Business Model Canvas shown here is the exact document you will receive after purchase, not a mockup. This preview includes live content and structure identical to the final file. Upon ordering you’ll download the complete, editable deliverable ready for use in Word and Excel. No surprises—what you see is what you get.











