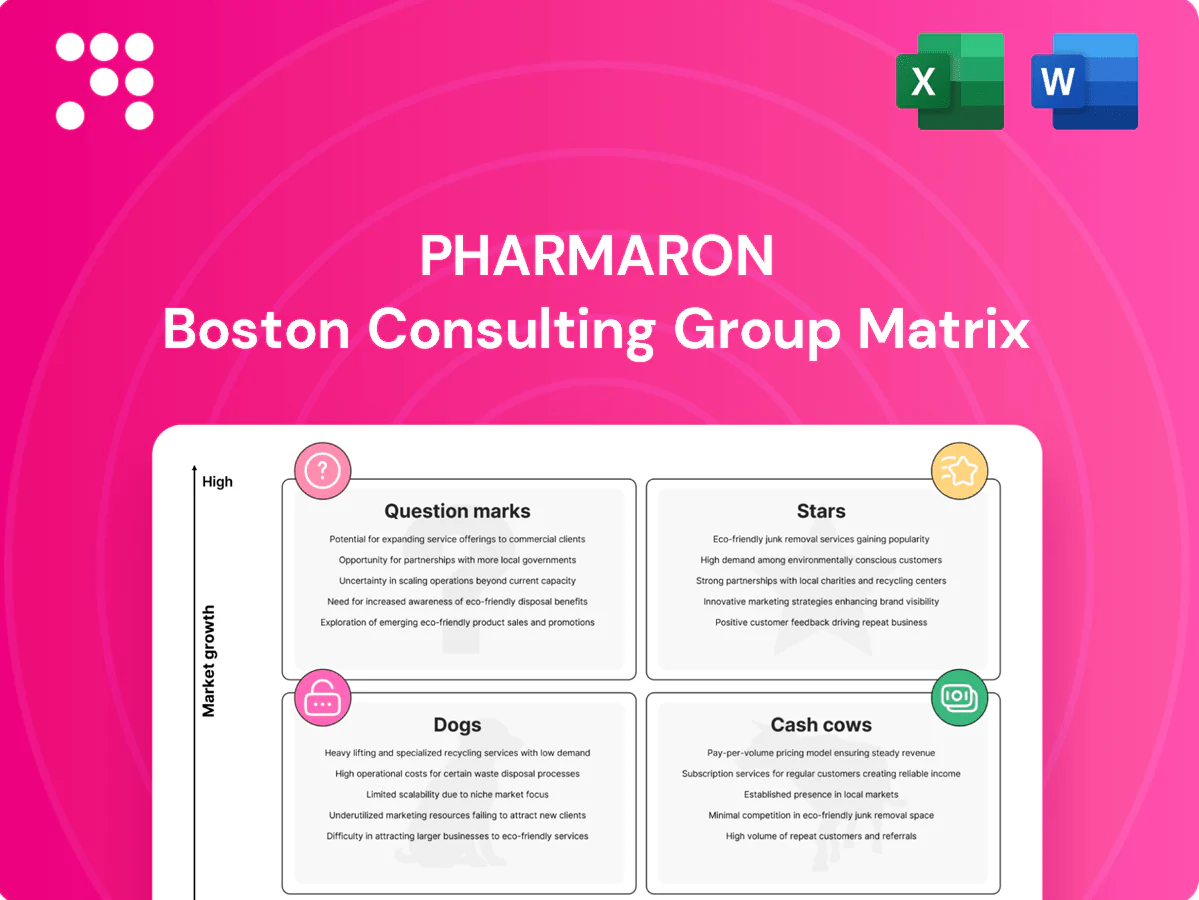
Pharmaron Boston Consulting Group Matrix

Actionable Strategy Starts Here
Curious where Pharmaron’s products really sit—Stars, Cash Cows, Dogs or Question Marks? This preview scratches the surface; buy the full BCG Matrix for quadrant-by-quadrant placement, data-backed recommendations, and a practical roadmap to reallocate capital and boost growth. You’ll get a polished Word report plus an editable Excel summary, ready to present to your team. Purchase now and skip the guesswork—get clear, actionable strategy in minutes.
Stars

Integrated discovery CRO platforms
High-growth biotech funding cycles in 2024 kept discovery pipelines active, and Pharmaron’s broad service set captures meaningful share in integrated discovery CROs. Chemistry, DMPK and biology under one roof shorten cycle time, driving higher repeat-program conversion and client retention. Heavy reinvestment soaks up cash for talent and tech, but the integrated flywheel drives downstream program wins. Hold share here and it compounds into later-stage revenue streams.
Preclinical safety & tox services
Regulatory demand is relentless and sponsors prize speed plus compliance, so Pharmaron’s preclinical safety & tox capacity — with reported utilization north of 85% in 2024 — is a clear draw; cross-sell from discovery labs continues to fuel volume and shorten sales cycles. Capital intensity is high, but double-digit growth and industry-leading reputation position Pharmaron as a market leader; continued investment is needed to lock preferred-provider status.

Biologics development & analytical
Biologics pipelines are expanding faster than small molecules, with biologics comprising about 48% of active pipelines in 2024 and the global biologics market near $330B; quality CMC expertise remains scarce. Pharmaron’s integrated development plus deep analytics wins complex programs early, translating into strong growth and selective competition. Market share can climb if Pharmaron keeps scaling talent and high-end assays to stay front of the pack.

Cell & gene therapy CDMO build-out
Pharmaron as a Star: cell & gene therapy CDMO build-out targets a market where 2,000+ active CGT trials globally in 2024 create demand that outpaces qualified capacity; sponsors prioritize reliability over lowest price, favoring partners with viral vector, process development, and QC strength. The build is capital-intensive—cleanrooms, QA, training—but pipeline momentum and premium pricing justify investment; land lighthouse programs, then standardize.
- Demand: 2,000+ active CGT trials (2024)
- Value prop: reliability > rock-bottom price
- Capabilities: viral vectors, process dev, QC
- Capex: cleanrooms, QA, workforce
- Go-to: secure lighthouse programs, scale SOPs
End-to-end program orchestration
Clients value a single accountable partner from hit-to-IND-to-commercial; Pharmaron’s integrated stack turns early wins into multi-year contracts and captures share in a global CRO market exceeding $60 billion in 2024. Its coordination engine—PMO-led program governance, digital traceability, and seamless tech transfer—is hard to replicate and strengthens with each program, improving retention and revenue visibility. Investment in PMO and digital transfer keeps the moat wide.
- single-partner accountability
- multi-year contracts
- coordination engine scale
- PMO + digital traceability
- seamless tech transfer
Integrated discovery-to-CMC platform captures >$60B CRO tailwind with >85% preclinical use
Pharmaron’s discovery-to-CMC integrated stack is a Star: 2024 CRO market >$60B, biologics ~48% of pipelines, and CGT trials 2,000+ drive demand that outpaces capacity. Preclinical utilization >85% and cross-sell shorten cycles, boosting retention. Heavy capex required, but premium pricing and repeat programs justify reinvestment.
| Metric | 2024 |
|---|---|
| Global CRO market | >$60B |
| Biologics share | ~48% |
| CGT trials | 2,000+ |
| Preclinical util. | >85% |
What is included in the product
 Detailed Word Document
BCG snapshot of Pharmaron’s portfolio: Stars, Cash Cows, Question Marks, Dogs with clear invest/hold/divest guidance and trend context.

 Customizable Excel Spreadsheet
One-page Pharmaron BCG Matrix locating each business unit to cut confusion and highlight growth vs. cash cows for quick decisions
Cash Cows

Commercial small-molecule API manufacturing
Commercial small-molecule API manufacturing sits in a mature market with stable end-market demand and strong share on proven assets; once validated, batches generate steady cash with predictable margins typically in the mid-teens to low-twenties percent. Capex is concentrated on upkeep and debottlenecking rather than large greenfield investments, keeping annual maintenance capex modest relative to expansion spend. Focus on milk consistency: protect quality and lock multi-year supply deals (commonly 3–5 years) to preserve cash flow predictability.
Process chemistry & scale-up (CMC)
Process chemistry & scale-up (CMC) is a core strength with repeatable workflows and consistently high utilization, generating reliable cash flow. Margins expand as know-how, templates and incremental yield gains reduce cost per batch. Growth is modest but predictable; reinvest in automation and PAT to squeeze throughput and further improve unit economics.

Routine bioanalysis and DMPK assays
Routine bioanalysis and DMPK assays are standard-panel services with high repeat rates and sticky clients; in 2024 low growth and low variance make them cash cows that fund riskier R&D. Pricing stays competitive, but margin comes from efficiency and volume—scale and SOP excellence sustain profitability. Maintain fast turnaround to prevent price erosion and preserve client retention.

Solid oral dose and formulation services
Solid oral dose and formulation services are cash cows for Pharmaron, operating in well-trodden territory with steady project flow; oral solids represented about 60% of global dosage-form volumes in 2024, keeping utilization high. Deep process know-how cuts rework and lifts batch success rates, often reducing deviation rates toward near-zero and trimming OPEX. Not flashy but very bankable—consistent margins and predictable revenue streams support cash generation.
Clinical trial support and logistics add-ons
Clinical trial support and logistics add-ons are ancillary services that piggyback on Pharmaron core programs, delivering predictable cash flow with low market growth but high cross-sell potential; the global CRO market exceeded about $60 billion in 2024, anchoring demand. Minimal incremental investment is needed once the network is built; standardize SLAs and bundle into master service agreements to lock margins and retention.
- Low growth, high cash generation
- High cross-sell potential (25–40% attach rates typical)
- Low incremental capex after network setup
- SLA standardization + MSAs = margin protection
Oral solids ≈ 60% vol; mid‑teens–low‑20s% margins; CRO add‑ons 25–40% attach
Commercial APIs, CMC scale-up, routine bioanalysis and oral solids are cash cows for Pharmaron: steady demand (oral solids ≈60% of dosage volumes in 2024), predictable margins (mid‑teens–low‑20s %), low incremental capex and high utilization. CRO/clinical add-ons boost cross‑sell (25–40% attach) within a >$60bn 2024 CRO market, funding R&D.
| Service | 2024 metric | Margin |
|---|---|---|
| Oral solids/APIs | 60% vol | 15–22% |
Full Transparency, Always
Pharmaron BCG Matrix
The file you're previewing is the exact Pharmaron BCG Matrix you'll receive after purchase. No watermarks, no demo text—just a fully formatted, analysis-ready report built for strategic clarity. It’s crafted with market-backed insights and ready to edit, print, or present the minute you download. Buy once, get the final file sent straight to your inbox—no surprises, no extra work.

Actionable Strategy Starts Here
Curious where Pharmaron’s products really sit—Stars, Cash Cows, Dogs or Question Marks? This preview scratches the surface; buy the full BCG Matrix for quadrant-by-quadrant placement, data-backed recommendations, and a practical roadmap to reallocate capital and boost growth. You’ll get a polished Word report plus an editable Excel summary, ready to present to your team. Purchase now and skip the guesswork—get clear, actionable strategy in minutes.
Stars
Integrated discovery CRO platforms
High-growth biotech funding cycles in 2024 kept discovery pipelines active, and Pharmaron’s broad service set captures meaningful share in integrated discovery CROs. Chemistry, DMPK and biology under one roof shorten cycle time, driving higher repeat-program conversion and client retention. Heavy reinvestment soaks up cash for talent and tech, but the integrated flywheel drives downstream program wins. Hold share here and it compounds into later-stage revenue streams.
Preclinical safety & tox services
Regulatory demand is relentless and sponsors prize speed plus compliance, so Pharmaron’s preclinical safety & tox capacity — with reported utilization north of 85% in 2024 — is a clear draw; cross-sell from discovery labs continues to fuel volume and shorten sales cycles. Capital intensity is high, but double-digit growth and industry-leading reputation position Pharmaron as a market leader; continued investment is needed to lock preferred-provider status.
Biologics development & analytical
Biologics pipelines are expanding faster than small molecules, with biologics comprising about 48% of active pipelines in 2024 and the global biologics market near $330B; quality CMC expertise remains scarce. Pharmaron’s integrated development plus deep analytics wins complex programs early, translating into strong growth and selective competition. Market share can climb if Pharmaron keeps scaling talent and high-end assays to stay front of the pack.
Cell & gene therapy CDMO build-out
Pharmaron as a Star: cell & gene therapy CDMO build-out targets a market where 2,000+ active CGT trials globally in 2024 create demand that outpaces qualified capacity; sponsors prioritize reliability over lowest price, favoring partners with viral vector, process development, and QC strength. The build is capital-intensive—cleanrooms, QA, training—but pipeline momentum and premium pricing justify investment; land lighthouse programs, then standardize.
- Demand: 2,000+ active CGT trials (2024)
- Value prop: reliability > rock-bottom price
- Capabilities: viral vectors, process dev, QC
- Capex: cleanrooms, QA, workforce
- Go-to: secure lighthouse programs, scale SOPs
End-to-end program orchestration
Clients value a single accountable partner from hit-to-IND-to-commercial; Pharmaron’s integrated stack turns early wins into multi-year contracts and captures share in a global CRO market exceeding $60 billion in 2024. Its coordination engine—PMO-led program governance, digital traceability, and seamless tech transfer—is hard to replicate and strengthens with each program, improving retention and revenue visibility. Investment in PMO and digital transfer keeps the moat wide.
- single-partner accountability
- multi-year contracts
- coordination engine scale
- PMO + digital traceability
- seamless tech transfer
Integrated discovery-to-CMC platform captures >$60B CRO tailwind with >85% preclinical use
Pharmaron’s discovery-to-CMC integrated stack is a Star: 2024 CRO market >$60B, biologics ~48% of pipelines, and CGT trials 2,000+ drive demand that outpaces capacity. Preclinical utilization >85% and cross-sell shorten cycles, boosting retention. Heavy capex required, but premium pricing and repeat programs justify reinvestment.
| Metric | 2024 |
|---|---|
| Global CRO market | >$60B |
| Biologics share | ~48% |
| CGT trials | 2,000+ |
| Preclinical util. | >85% |
What is included in the product
Detailed Word Document
BCG snapshot of Pharmaron’s portfolio: Stars, Cash Cows, Question Marks, Dogs with clear invest/hold/divest guidance and trend context.
Customizable Excel Spreadsheet
One-page Pharmaron BCG Matrix locating each business unit to cut confusion and highlight growth vs. cash cows for quick decisions
Cash Cows
Commercial small-molecule API manufacturing
Commercial small-molecule API manufacturing sits in a mature market with stable end-market demand and strong share on proven assets; once validated, batches generate steady cash with predictable margins typically in the mid-teens to low-twenties percent. Capex is concentrated on upkeep and debottlenecking rather than large greenfield investments, keeping annual maintenance capex modest relative to expansion spend. Focus on milk consistency: protect quality and lock multi-year supply deals (commonly 3–5 years) to preserve cash flow predictability.
Process chemistry & scale-up (CMC)
Process chemistry & scale-up (CMC) is a core strength with repeatable workflows and consistently high utilization, generating reliable cash flow. Margins expand as know-how, templates and incremental yield gains reduce cost per batch. Growth is modest but predictable; reinvest in automation and PAT to squeeze throughput and further improve unit economics.
Routine bioanalysis and DMPK assays
Routine bioanalysis and DMPK assays are standard-panel services with high repeat rates and sticky clients; in 2024 low growth and low variance make them cash cows that fund riskier R&D. Pricing stays competitive, but margin comes from efficiency and volume—scale and SOP excellence sustain profitability. Maintain fast turnaround to prevent price erosion and preserve client retention.
Solid oral dose and formulation services
Solid oral dose and formulation services are cash cows for Pharmaron, operating in well-trodden territory with steady project flow; oral solids represented about 60% of global dosage-form volumes in 2024, keeping utilization high. Deep process know-how cuts rework and lifts batch success rates, often reducing deviation rates toward near-zero and trimming OPEX. Not flashy but very bankable—consistent margins and predictable revenue streams support cash generation.
Clinical trial support and logistics add-ons
Clinical trial support and logistics add-ons are ancillary services that piggyback on Pharmaron core programs, delivering predictable cash flow with low market growth but high cross-sell potential; the global CRO market exceeded about $60 billion in 2024, anchoring demand. Minimal incremental investment is needed once the network is built; standardize SLAs and bundle into master service agreements to lock margins and retention.
- Low growth, high cash generation
- High cross-sell potential (25–40% attach rates typical)
- Low incremental capex after network setup
- SLA standardization + MSAs = margin protection
Oral solids ≈ 60% vol; mid‑teens–low‑20s% margins; CRO add‑ons 25–40% attach
Commercial APIs, CMC scale-up, routine bioanalysis and oral solids are cash cows for Pharmaron: steady demand (oral solids ≈60% of dosage volumes in 2024), predictable margins (mid‑teens–low‑20s %), low incremental capex and high utilization. CRO/clinical add-ons boost cross‑sell (25–40% attach) within a >$60bn 2024 CRO market, funding R&D.
| Service | 2024 metric | Margin |
|---|---|---|
| Oral solids/APIs | 60% vol | 15–22% |
Full Transparency, Always
Pharmaron BCG Matrix
The file you're previewing is the exact Pharmaron BCG Matrix you'll receive after purchase. No watermarks, no demo text—just a fully formatted, analysis-ready report built for strategic clarity. It’s crafted with market-backed insights and ready to edit, print, or present the minute you download. Buy once, get the final file sent straight to your inbox—no surprises, no extra work.
Original: $10.00
-65%$10.00
$3.50Description
Actionable Strategy Starts Here
Curious where Pharmaron’s products really sit—Stars, Cash Cows, Dogs or Question Marks? This preview scratches the surface; buy the full BCG Matrix for quadrant-by-quadrant placement, data-backed recommendations, and a practical roadmap to reallocate capital and boost growth. You’ll get a polished Word report plus an editable Excel summary, ready to present to your team. Purchase now and skip the guesswork—get clear, actionable strategy in minutes.
Stars
Integrated discovery CRO platforms
High-growth biotech funding cycles in 2024 kept discovery pipelines active, and Pharmaron’s broad service set captures meaningful share in integrated discovery CROs. Chemistry, DMPK and biology under one roof shorten cycle time, driving higher repeat-program conversion and client retention. Heavy reinvestment soaks up cash for talent and tech, but the integrated flywheel drives downstream program wins. Hold share here and it compounds into later-stage revenue streams.
Preclinical safety & tox services
Regulatory demand is relentless and sponsors prize speed plus compliance, so Pharmaron’s preclinical safety & tox capacity — with reported utilization north of 85% in 2024 — is a clear draw; cross-sell from discovery labs continues to fuel volume and shorten sales cycles. Capital intensity is high, but double-digit growth and industry-leading reputation position Pharmaron as a market leader; continued investment is needed to lock preferred-provider status.
Biologics development & analytical
Biologics pipelines are expanding faster than small molecules, with biologics comprising about 48% of active pipelines in 2024 and the global biologics market near $330B; quality CMC expertise remains scarce. Pharmaron’s integrated development plus deep analytics wins complex programs early, translating into strong growth and selective competition. Market share can climb if Pharmaron keeps scaling talent and high-end assays to stay front of the pack.
Cell & gene therapy CDMO build-out
Pharmaron as a Star: cell & gene therapy CDMO build-out targets a market where 2,000+ active CGT trials globally in 2024 create demand that outpaces qualified capacity; sponsors prioritize reliability over lowest price, favoring partners with viral vector, process development, and QC strength. The build is capital-intensive—cleanrooms, QA, training—but pipeline momentum and premium pricing justify investment; land lighthouse programs, then standardize.
- Demand: 2,000+ active CGT trials (2024)
- Value prop: reliability > rock-bottom price
- Capabilities: viral vectors, process dev, QC
- Capex: cleanrooms, QA, workforce
- Go-to: secure lighthouse programs, scale SOPs
End-to-end program orchestration
Clients value a single accountable partner from hit-to-IND-to-commercial; Pharmaron’s integrated stack turns early wins into multi-year contracts and captures share in a global CRO market exceeding $60 billion in 2024. Its coordination engine—PMO-led program governance, digital traceability, and seamless tech transfer—is hard to replicate and strengthens with each program, improving retention and revenue visibility. Investment in PMO and digital transfer keeps the moat wide.
- single-partner accountability
- multi-year contracts
- coordination engine scale
- PMO + digital traceability
- seamless tech transfer
Integrated discovery-to-CMC platform captures >$60B CRO tailwind with >85% preclinical use
Pharmaron’s discovery-to-CMC integrated stack is a Star: 2024 CRO market >$60B, biologics ~48% of pipelines, and CGT trials 2,000+ drive demand that outpaces capacity. Preclinical utilization >85% and cross-sell shorten cycles, boosting retention. Heavy capex required, but premium pricing and repeat programs justify reinvestment.
| Metric | 2024 |
|---|---|
| Global CRO market | >$60B |
| Biologics share | ~48% |
| CGT trials | 2,000+ |
| Preclinical util. | >85% |
What is included in the product
Detailed Word Document
BCG snapshot of Pharmaron’s portfolio: Stars, Cash Cows, Question Marks, Dogs with clear invest/hold/divest guidance and trend context.
Customizable Excel Spreadsheet
One-page Pharmaron BCG Matrix locating each business unit to cut confusion and highlight growth vs. cash cows for quick decisions
Cash Cows
Commercial small-molecule API manufacturing
Commercial small-molecule API manufacturing sits in a mature market with stable end-market demand and strong share on proven assets; once validated, batches generate steady cash with predictable margins typically in the mid-teens to low-twenties percent. Capex is concentrated on upkeep and debottlenecking rather than large greenfield investments, keeping annual maintenance capex modest relative to expansion spend. Focus on milk consistency: protect quality and lock multi-year supply deals (commonly 3–5 years) to preserve cash flow predictability.
Process chemistry & scale-up (CMC)
Process chemistry & scale-up (CMC) is a core strength with repeatable workflows and consistently high utilization, generating reliable cash flow. Margins expand as know-how, templates and incremental yield gains reduce cost per batch. Growth is modest but predictable; reinvest in automation and PAT to squeeze throughput and further improve unit economics.
Routine bioanalysis and DMPK assays
Routine bioanalysis and DMPK assays are standard-panel services with high repeat rates and sticky clients; in 2024 low growth and low variance make them cash cows that fund riskier R&D. Pricing stays competitive, but margin comes from efficiency and volume—scale and SOP excellence sustain profitability. Maintain fast turnaround to prevent price erosion and preserve client retention.
Solid oral dose and formulation services
Solid oral dose and formulation services are cash cows for Pharmaron, operating in well-trodden territory with steady project flow; oral solids represented about 60% of global dosage-form volumes in 2024, keeping utilization high. Deep process know-how cuts rework and lifts batch success rates, often reducing deviation rates toward near-zero and trimming OPEX. Not flashy but very bankable—consistent margins and predictable revenue streams support cash generation.
Clinical trial support and logistics add-ons
Clinical trial support and logistics add-ons are ancillary services that piggyback on Pharmaron core programs, delivering predictable cash flow with low market growth but high cross-sell potential; the global CRO market exceeded about $60 billion in 2024, anchoring demand. Minimal incremental investment is needed once the network is built; standardize SLAs and bundle into master service agreements to lock margins and retention.
- Low growth, high cash generation
- High cross-sell potential (25–40% attach rates typical)
- Low incremental capex after network setup
- SLA standardization + MSAs = margin protection
Oral solids ≈ 60% vol; mid‑teens–low‑20s% margins; CRO add‑ons 25–40% attach
Commercial APIs, CMC scale-up, routine bioanalysis and oral solids are cash cows for Pharmaron: steady demand (oral solids ≈60% of dosage volumes in 2024), predictable margins (mid‑teens–low‑20s %), low incremental capex and high utilization. CRO/clinical add-ons boost cross‑sell (25–40% attach) within a >$60bn 2024 CRO market, funding R&D.
| Service | 2024 metric | Margin |
|---|---|---|
| Oral solids/APIs | 60% vol | 15–22% |
Full Transparency, Always
Pharmaron BCG Matrix
The file you're previewing is the exact Pharmaron BCG Matrix you'll receive after purchase. No watermarks, no demo text—just a fully formatted, analysis-ready report built for strategic clarity. It’s crafted with market-backed insights and ready to edit, print, or present the minute you download. Buy once, get the final file sent straight to your inbox—no surprises, no extra work.











