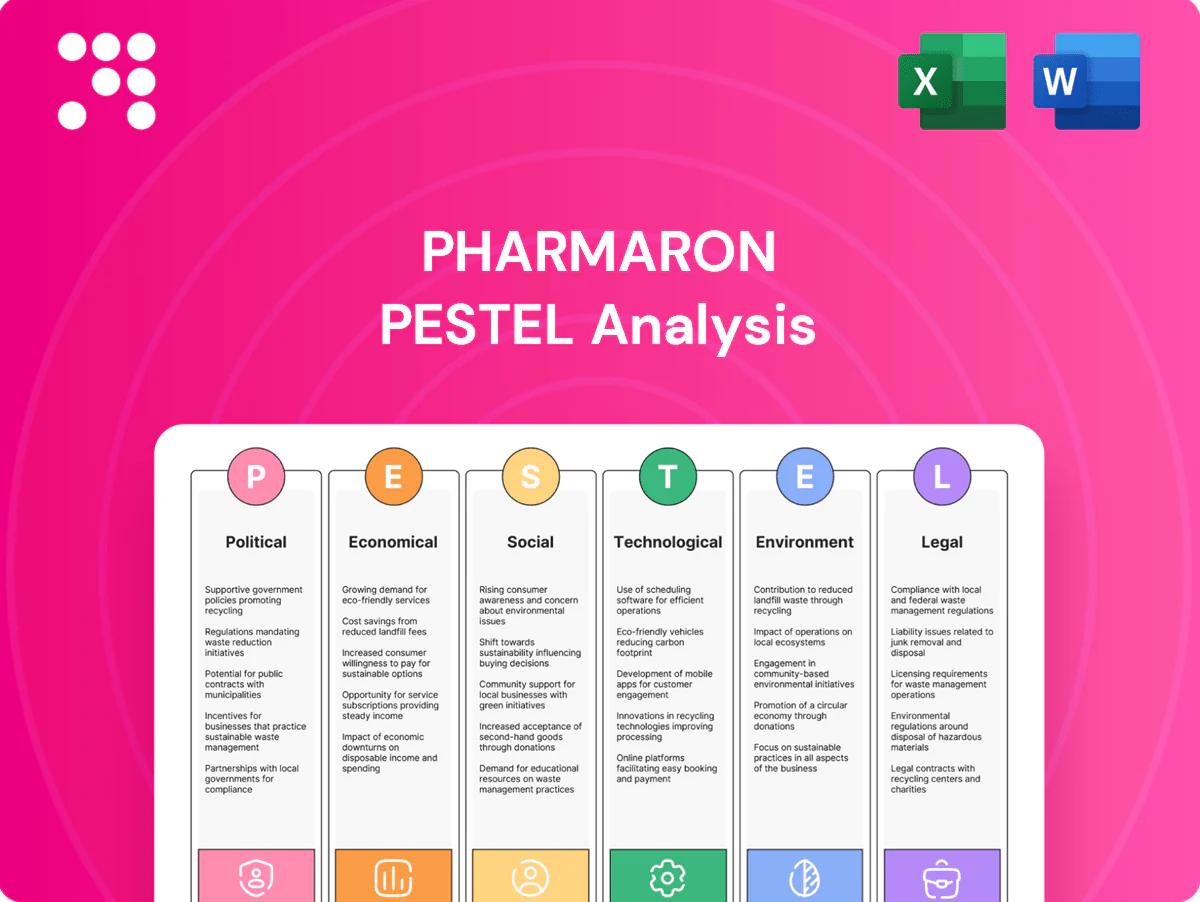
Pharmaron PESTLE Analysis

Plan Smarter. Present Sharper. Compete Stronger.
Gain a competitive edge with our Pharmaron PESTLE Analysis—concise, research-backed insights into political, economic, social, technological, legal, and environmental forces shaping the company. Ideal for investors and strategists; buy the full report for actionable intelligence and ready-to-use charts.
Political factors

Geopolitical tensions and supply chain
US–China–EU frictions increasingly disrupt cross-border projects, inspections and sourcing for global CRO/CDMOs; with about half of drug development activities outsourced, delays ripple widely. Since 2020 regulatory tightening and export-controls on advanced biotech and precursor chemicals have slowed tech transfer and narrowed project scope. Diversifying sites and suppliers reduces disruption risk, while proactive client communication preserves delivery confidence.
Healthcare and drug pricing policy
Government cost-containment measures can squeeze pharma budgets and shift outsourcing demand; CBO estimated Medicare drug price negotiation could save about 100 billion USD over a decade, pressuring upstream spend.
Pricing reforms force clients to reprioritize pipelines, altering project mix and volume, while IQVIA projects global medicine spend to reach 1.6 trillion USD by 2027, supporting long-term CDMO contracts.
Rapid policy shifts require Pharmaron to maintain flexible capacity planning and modular facilities to absorb sudden demand changes.

Public R&D funding and incentives
Grants, tax credits and innovation zones in China, the US and UK — including China’s multi‑billion‑CNY R&D push, the US NIH budget near $49B (FY2024) and UK R&D relief costing ~£8bn annually — materially lower Pharmaron’s capital costs and accelerate investments in new modalities and facilities. Loss of these incentives would reduce projected IRRs on expansion projects; monitoring local programs helps optimize site selection and timing.

Trade tariffs and customs
Tariffs on lab equipment, reagents and APIs (including US Section 301 duties up to 25% on some Chinese imports) raise input costs and can extend procurement lead times; customs clearance variability commonly adds 1–4 weeks to clinical-material schedules. Preferential trade agreements such as RCEP and EU free-trade deals can cut or eliminate tariffs, while standardized logistics playbooks improve predictability and reduce schedule risk.
- Tariff pressure: Section 301 duties up to 25%
- Customs delay: typical 1–4 week impact
- Mitigation: RCEP/EU FTAs reduce tariffs
- Operational fix: standardized logistics playbooks
Local content and industrial policy
Host countries increasingly favor domestic manufacturing and clinical capacity; China supplies about 40% of global APIs, and regulators reward localization with faster approvals and public procurement preferences. Aligning Pharmaron with localization can unlock partnerships and market access, while misalignment risks permitting delays and tender losses. Co-investments and joint labs—already used in China and India—can strengthen policy fit.
- Local manufacturing unlocks approvals
- Misalignment risks permitting delays
- Co-investments/joint labs mitigate policy risk
Geopolitical frictions, export controls and pricing reforms causing 1–4 week pharma delays
Political risks: US–China–EU frictions and export controls disrupt tech transfer and sourcing, adding typical 1–4 week delays; CBO’s Medicare negotiation estimate ~$100B/10yr and pricing reforms compress upstream spend even as IQVIA forecasts $1.6T global medicine spend by 2027; China multi‑bn CNY drives localization, US NIH ~$49B (FY2024) lowers capex.
| Factor | Metric |
|---|---|
| Tariffs/controls | Section 301 up to 25% |
| Customs delay | 1–4 weeks |
| Incentives | NIH ~$49B; IQVIA $1.6T by 2027 |
What is included in the product
 Detailed Word Document
Explores how external macro-environmental factors uniquely affect Pharmaron across six dimensions—Political, Economic, Social, Technological, Environmental, and Legal—providing data-backed, region- and industry-specific trends. Each section highlights threats and opportunities to support executives, investors, and strategists in scenario planning and decision-making.

 Customizable Excel Spreadsheet
A concise, visually segmented Pharmaron PESTLE summary that highlights regulatory, technological, economic and geopolitical pain points for rapid decision-making during meetings or client reports. Easily editable and shareable for quick alignment across teams, presentations, and strategic planning sessions.
Economic factors

Biopharma funding cycles
Biopharma funding cycles strongly affect Pharmaron: biotech VC and public financings plunged about 40% from 2021 peaks to 2023 lows, cutting early-stage discovery work, while 2024 showed a partial rebound (~20% rise YTD) expanding integrated programs. Big pharma R&D spend remains steadier—top 10 firms averaged ~$11–14B each in 2023—buffering revenue. A balanced client mix smooths volatility.
Currency and inflation
Pharmaron's multi-jurisdiction operations expose it to FX translation risk and input inflation, with RMB volatility versus the USD (~5% swing in 2024) amplifying P&L translation impacts.
Active FX hedging and increased local sourcing have been used to protect margins, while pricing escalators in MSAs allow partial recovery of input cost increases.
Persistent cost discipline—targeting productivity gains and SG&A control—remains critical to sustain competitiveness amid 2024–2025 inflationary pressures (China CPI ~0.8% in 2024).

Interest rates and capex
Elevated global policy rates (US federal funds 5.25–5.50% in mid‑2025) raise financing costs for Pharmaron’s new plants and equipment, increasing weighted average cost of capital and payback periods. Phased capacity additions limit upfront capex and balance‑sheet strain. Long‑term take‑or‑pay contracts de‑risk investments by securing cashflows. If rates fall, expansion can be accelerated and ROI horizons shorten.

Client consolidation and outsourcing trends
- Vendor consolidation increases supplier competitiveness
- FFS-to-FTE shifts favor scale, quality, reliability
- End-to-end CDMO revenues exceeded $100B (2023)
- Relationship depth acts as a strategic moat
Labor markets and productivity
Tight demand for chemists, biologists and GMP specialists is lifting pay and hiring pressure; the May 2023 BLS median annual wage for biochemists and biophysicists was 102,270, underscoring premium skills value. Pharmaron offsets costs by investing in training, automation and standardized platforms that raise throughput and lower per-sample cost. Near-shoring into lower-cost skilled hubs improves cost-to-skill ratios while targeted retention programs preserve critical know-how.
- Wage pressure: premium pay for GMP/biotech talent
- Capacity: automation + platforms increase throughput
- Near-shoring: optimizes cost-to-skill
- Retention: protects institutional know-how
Geopolitical frictions, export controls and pricing reforms causing 1–4 week pharma delays
Biopharma funding fell ~40% from 2021–23 then rebounded ~20% YTD 2024, while top‑10 pharma R&D averaged ~$11–14B in 2023, buffering demand. RMB swung ~5% in 2024 and China CPI was ~0.8% (2024), pressuring margins; US rates 5.25–5.50% mid‑2025 raise capex costs. Global CDMO revenue exceeded $100B in 2023; wage pressure (median biochemist pay $102,270 May 2023) increases OPEX.
| Metric | Value |
|---|---|
| Funding change 2021–23 | -40% |
| 2024 funding rebound | +20% YTD |
| Top‑10 pharma R&D (2023) | $11–14B |
| CDMO revenue (2023) | >$100B |
| RMB vol (2024) | ~5% |
| US rate (mid‑2025) | 5.25–5.50% |
Same Document Delivered
Pharmaron PESTLE Analysis
The Pharmaron PESTLE analysis preview shown here is the exact document you’ll receive after purchase—fully formatted and ready to use. The layout, content, and structure visible are identical to the final file, with no placeholders or teasers. After payment you’ll instantly download this professionally structured report.

Plan Smarter. Present Sharper. Compete Stronger.
Gain a competitive edge with our Pharmaron PESTLE Analysis—concise, research-backed insights into political, economic, social, technological, legal, and environmental forces shaping the company. Ideal for investors and strategists; buy the full report for actionable intelligence and ready-to-use charts.
Political factors
Geopolitical tensions and supply chain
US–China–EU frictions increasingly disrupt cross-border projects, inspections and sourcing for global CRO/CDMOs; with about half of drug development activities outsourced, delays ripple widely. Since 2020 regulatory tightening and export-controls on advanced biotech and precursor chemicals have slowed tech transfer and narrowed project scope. Diversifying sites and suppliers reduces disruption risk, while proactive client communication preserves delivery confidence.
Healthcare and drug pricing policy
Government cost-containment measures can squeeze pharma budgets and shift outsourcing demand; CBO estimated Medicare drug price negotiation could save about 100 billion USD over a decade, pressuring upstream spend.
Pricing reforms force clients to reprioritize pipelines, altering project mix and volume, while IQVIA projects global medicine spend to reach 1.6 trillion USD by 2027, supporting long-term CDMO contracts.
Rapid policy shifts require Pharmaron to maintain flexible capacity planning and modular facilities to absorb sudden demand changes.
Public R&D funding and incentives
Grants, tax credits and innovation zones in China, the US and UK — including China’s multi‑billion‑CNY R&D push, the US NIH budget near $49B (FY2024) and UK R&D relief costing ~£8bn annually — materially lower Pharmaron’s capital costs and accelerate investments in new modalities and facilities. Loss of these incentives would reduce projected IRRs on expansion projects; monitoring local programs helps optimize site selection and timing.
Trade tariffs and customs
Tariffs on lab equipment, reagents and APIs (including US Section 301 duties up to 25% on some Chinese imports) raise input costs and can extend procurement lead times; customs clearance variability commonly adds 1–4 weeks to clinical-material schedules. Preferential trade agreements such as RCEP and EU free-trade deals can cut or eliminate tariffs, while standardized logistics playbooks improve predictability and reduce schedule risk.
- Tariff pressure: Section 301 duties up to 25%
- Customs delay: typical 1–4 week impact
- Mitigation: RCEP/EU FTAs reduce tariffs
- Operational fix: standardized logistics playbooks
Local content and industrial policy
Host countries increasingly favor domestic manufacturing and clinical capacity; China supplies about 40% of global APIs, and regulators reward localization with faster approvals and public procurement preferences. Aligning Pharmaron with localization can unlock partnerships and market access, while misalignment risks permitting delays and tender losses. Co-investments and joint labs—already used in China and India—can strengthen policy fit.
- Local manufacturing unlocks approvals
- Misalignment risks permitting delays
- Co-investments/joint labs mitigate policy risk
Geopolitical frictions, export controls and pricing reforms causing 1–4 week pharma delays
Political risks: US–China–EU frictions and export controls disrupt tech transfer and sourcing, adding typical 1–4 week delays; CBO’s Medicare negotiation estimate ~$100B/10yr and pricing reforms compress upstream spend even as IQVIA forecasts $1.6T global medicine spend by 2027; China multi‑bn CNY drives localization, US NIH ~$49B (FY2024) lowers capex.
| Factor | Metric |
|---|---|
| Tariffs/controls | Section 301 up to 25% |
| Customs delay | 1–4 weeks |
| Incentives | NIH ~$49B; IQVIA $1.6T by 2027 |
What is included in the product
Detailed Word Document
Explores how external macro-environmental factors uniquely affect Pharmaron across six dimensions—Political, Economic, Social, Technological, Environmental, and Legal—providing data-backed, region- and industry-specific trends. Each section highlights threats and opportunities to support executives, investors, and strategists in scenario planning and decision-making.
Customizable Excel Spreadsheet
A concise, visually segmented Pharmaron PESTLE summary that highlights regulatory, technological, economic and geopolitical pain points for rapid decision-making during meetings or client reports. Easily editable and shareable for quick alignment across teams, presentations, and strategic planning sessions.
Economic factors
Biopharma funding cycles
Biopharma funding cycles strongly affect Pharmaron: biotech VC and public financings plunged about 40% from 2021 peaks to 2023 lows, cutting early-stage discovery work, while 2024 showed a partial rebound (~20% rise YTD) expanding integrated programs. Big pharma R&D spend remains steadier—top 10 firms averaged ~$11–14B each in 2023—buffering revenue. A balanced client mix smooths volatility.
Currency and inflation
Pharmaron's multi-jurisdiction operations expose it to FX translation risk and input inflation, with RMB volatility versus the USD (~5% swing in 2024) amplifying P&L translation impacts.
Active FX hedging and increased local sourcing have been used to protect margins, while pricing escalators in MSAs allow partial recovery of input cost increases.
Persistent cost discipline—targeting productivity gains and SG&A control—remains critical to sustain competitiveness amid 2024–2025 inflationary pressures (China CPI ~0.8% in 2024).
Interest rates and capex
Elevated global policy rates (US federal funds 5.25–5.50% in mid‑2025) raise financing costs for Pharmaron’s new plants and equipment, increasing weighted average cost of capital and payback periods. Phased capacity additions limit upfront capex and balance‑sheet strain. Long‑term take‑or‑pay contracts de‑risk investments by securing cashflows. If rates fall, expansion can be accelerated and ROI horizons shorten.
Client consolidation and outsourcing trends
- Vendor consolidation increases supplier competitiveness
- FFS-to-FTE shifts favor scale, quality, reliability
- End-to-end CDMO revenues exceeded $100B (2023)
- Relationship depth acts as a strategic moat
Labor markets and productivity
Tight demand for chemists, biologists and GMP specialists is lifting pay and hiring pressure; the May 2023 BLS median annual wage for biochemists and biophysicists was 102,270, underscoring premium skills value. Pharmaron offsets costs by investing in training, automation and standardized platforms that raise throughput and lower per-sample cost. Near-shoring into lower-cost skilled hubs improves cost-to-skill ratios while targeted retention programs preserve critical know-how.
- Wage pressure: premium pay for GMP/biotech talent
- Capacity: automation + platforms increase throughput
- Near-shoring: optimizes cost-to-skill
- Retention: protects institutional know-how
Geopolitical frictions, export controls and pricing reforms causing 1–4 week pharma delays
Biopharma funding fell ~40% from 2021–23 then rebounded ~20% YTD 2024, while top‑10 pharma R&D averaged ~$11–14B in 2023, buffering demand. RMB swung ~5% in 2024 and China CPI was ~0.8% (2024), pressuring margins; US rates 5.25–5.50% mid‑2025 raise capex costs. Global CDMO revenue exceeded $100B in 2023; wage pressure (median biochemist pay $102,270 May 2023) increases OPEX.
| Metric | Value |
|---|---|
| Funding change 2021–23 | -40% |
| 2024 funding rebound | +20% YTD |
| Top‑10 pharma R&D (2023) | $11–14B |
| CDMO revenue (2023) | >$100B |
| RMB vol (2024) | ~5% |
| US rate (mid‑2025) | 5.25–5.50% |
Same Document Delivered
Pharmaron PESTLE Analysis
The Pharmaron PESTLE analysis preview shown here is the exact document you’ll receive after purchase—fully formatted and ready to use. The layout, content, and structure visible are identical to the final file, with no placeholders or teasers. After payment you’ll instantly download this professionally structured report.
Original: $10.00
-65%$10.00
$3.50Description
Plan Smarter. Present Sharper. Compete Stronger.
Gain a competitive edge with our Pharmaron PESTLE Analysis—concise, research-backed insights into political, economic, social, technological, legal, and environmental forces shaping the company. Ideal for investors and strategists; buy the full report for actionable intelligence and ready-to-use charts.
Political factors
Geopolitical tensions and supply chain
US–China–EU frictions increasingly disrupt cross-border projects, inspections and sourcing for global CRO/CDMOs; with about half of drug development activities outsourced, delays ripple widely. Since 2020 regulatory tightening and export-controls on advanced biotech and precursor chemicals have slowed tech transfer and narrowed project scope. Diversifying sites and suppliers reduces disruption risk, while proactive client communication preserves delivery confidence.
Healthcare and drug pricing policy
Government cost-containment measures can squeeze pharma budgets and shift outsourcing demand; CBO estimated Medicare drug price negotiation could save about 100 billion USD over a decade, pressuring upstream spend.
Pricing reforms force clients to reprioritize pipelines, altering project mix and volume, while IQVIA projects global medicine spend to reach 1.6 trillion USD by 2027, supporting long-term CDMO contracts.
Rapid policy shifts require Pharmaron to maintain flexible capacity planning and modular facilities to absorb sudden demand changes.
Public R&D funding and incentives
Grants, tax credits and innovation zones in China, the US and UK — including China’s multi‑billion‑CNY R&D push, the US NIH budget near $49B (FY2024) and UK R&D relief costing ~£8bn annually — materially lower Pharmaron’s capital costs and accelerate investments in new modalities and facilities. Loss of these incentives would reduce projected IRRs on expansion projects; monitoring local programs helps optimize site selection and timing.
Trade tariffs and customs
Tariffs on lab equipment, reagents and APIs (including US Section 301 duties up to 25% on some Chinese imports) raise input costs and can extend procurement lead times; customs clearance variability commonly adds 1–4 weeks to clinical-material schedules. Preferential trade agreements such as RCEP and EU free-trade deals can cut or eliminate tariffs, while standardized logistics playbooks improve predictability and reduce schedule risk.
- Tariff pressure: Section 301 duties up to 25%
- Customs delay: typical 1–4 week impact
- Mitigation: RCEP/EU FTAs reduce tariffs
- Operational fix: standardized logistics playbooks
Local content and industrial policy
Host countries increasingly favor domestic manufacturing and clinical capacity; China supplies about 40% of global APIs, and regulators reward localization with faster approvals and public procurement preferences. Aligning Pharmaron with localization can unlock partnerships and market access, while misalignment risks permitting delays and tender losses. Co-investments and joint labs—already used in China and India—can strengthen policy fit.
- Local manufacturing unlocks approvals
- Misalignment risks permitting delays
- Co-investments/joint labs mitigate policy risk
Geopolitical frictions, export controls and pricing reforms causing 1–4 week pharma delays
Political risks: US–China–EU frictions and export controls disrupt tech transfer and sourcing, adding typical 1–4 week delays; CBO’s Medicare negotiation estimate ~$100B/10yr and pricing reforms compress upstream spend even as IQVIA forecasts $1.6T global medicine spend by 2027; China multi‑bn CNY drives localization, US NIH ~$49B (FY2024) lowers capex.
| Factor | Metric |
|---|---|
| Tariffs/controls | Section 301 up to 25% |
| Customs delay | 1–4 weeks |
| Incentives | NIH ~$49B; IQVIA $1.6T by 2027 |
What is included in the product
Detailed Word Document
Explores how external macro-environmental factors uniquely affect Pharmaron across six dimensions—Political, Economic, Social, Technological, Environmental, and Legal—providing data-backed, region- and industry-specific trends. Each section highlights threats and opportunities to support executives, investors, and strategists in scenario planning and decision-making.
Customizable Excel Spreadsheet
A concise, visually segmented Pharmaron PESTLE summary that highlights regulatory, technological, economic and geopolitical pain points for rapid decision-making during meetings or client reports. Easily editable and shareable for quick alignment across teams, presentations, and strategic planning sessions.
Economic factors
Biopharma funding cycles
Biopharma funding cycles strongly affect Pharmaron: biotech VC and public financings plunged about 40% from 2021 peaks to 2023 lows, cutting early-stage discovery work, while 2024 showed a partial rebound (~20% rise YTD) expanding integrated programs. Big pharma R&D spend remains steadier—top 10 firms averaged ~$11–14B each in 2023—buffering revenue. A balanced client mix smooths volatility.
Currency and inflation
Pharmaron's multi-jurisdiction operations expose it to FX translation risk and input inflation, with RMB volatility versus the USD (~5% swing in 2024) amplifying P&L translation impacts.
Active FX hedging and increased local sourcing have been used to protect margins, while pricing escalators in MSAs allow partial recovery of input cost increases.
Persistent cost discipline—targeting productivity gains and SG&A control—remains critical to sustain competitiveness amid 2024–2025 inflationary pressures (China CPI ~0.8% in 2024).
Interest rates and capex
Elevated global policy rates (US federal funds 5.25–5.50% in mid‑2025) raise financing costs for Pharmaron’s new plants and equipment, increasing weighted average cost of capital and payback periods. Phased capacity additions limit upfront capex and balance‑sheet strain. Long‑term take‑or‑pay contracts de‑risk investments by securing cashflows. If rates fall, expansion can be accelerated and ROI horizons shorten.
Client consolidation and outsourcing trends
- Vendor consolidation increases supplier competitiveness
- FFS-to-FTE shifts favor scale, quality, reliability
- End-to-end CDMO revenues exceeded $100B (2023)
- Relationship depth acts as a strategic moat
Labor markets and productivity
Tight demand for chemists, biologists and GMP specialists is lifting pay and hiring pressure; the May 2023 BLS median annual wage for biochemists and biophysicists was 102,270, underscoring premium skills value. Pharmaron offsets costs by investing in training, automation and standardized platforms that raise throughput and lower per-sample cost. Near-shoring into lower-cost skilled hubs improves cost-to-skill ratios while targeted retention programs preserve critical know-how.
- Wage pressure: premium pay for GMP/biotech talent
- Capacity: automation + platforms increase throughput
- Near-shoring: optimizes cost-to-skill
- Retention: protects institutional know-how
Geopolitical frictions, export controls and pricing reforms causing 1–4 week pharma delays
Biopharma funding fell ~40% from 2021–23 then rebounded ~20% YTD 2024, while top‑10 pharma R&D averaged ~$11–14B in 2023, buffering demand. RMB swung ~5% in 2024 and China CPI was ~0.8% (2024), pressuring margins; US rates 5.25–5.50% mid‑2025 raise capex costs. Global CDMO revenue exceeded $100B in 2023; wage pressure (median biochemist pay $102,270 May 2023) increases OPEX.
| Metric | Value |
|---|---|
| Funding change 2021–23 | -40% |
| 2024 funding rebound | +20% YTD |
| Top‑10 pharma R&D (2023) | $11–14B |
| CDMO revenue (2023) | >$100B |
| RMB vol (2024) | ~5% |
| US rate (mid‑2025) | 5.25–5.50% |
Same Document Delivered
Pharmaron PESTLE Analysis
The Pharmaron PESTLE analysis preview shown here is the exact document you’ll receive after purchase—fully formatted and ready to use. The layout, content, and structure visible are identical to the final file, with no placeholders or teasers. After payment you’ll instantly download this professionally structured report.











