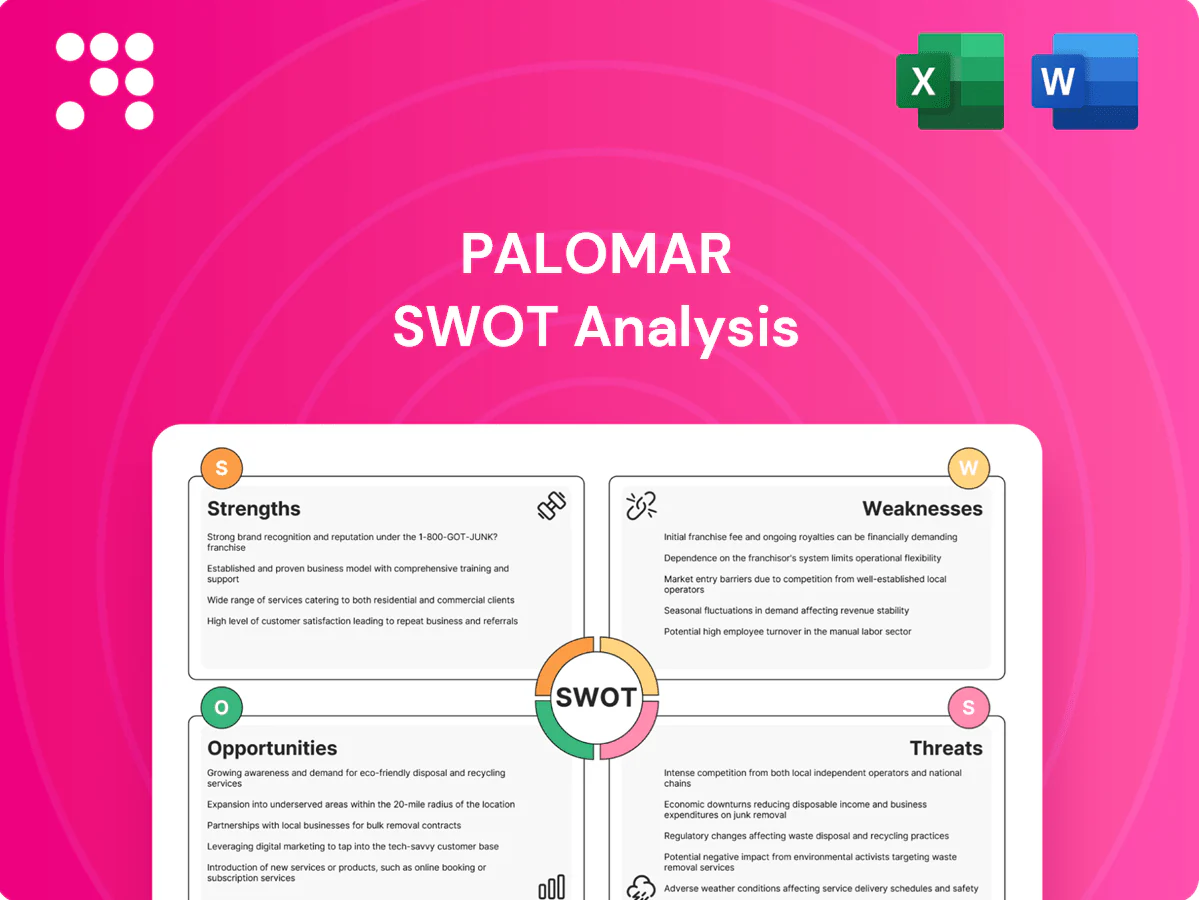
Palomar SWOT Analysis

Make Insightful Decisions Backed by Expert Research
Palomar’s SWOT preview highlights competitive strengths, market threats, and tactical opportunities shaping near-term performance. For actionable strategies, financial context, and editable tools, purchase the full SWOT analysis—ideal for investors, consultants, and executives seeking a research-backed, presentation-ready report. Unlock the complete package today.
Strengths

Catastrophe underwriting expertise
Deep specialization in earthquake, flood and wind gives Palomar disciplined risk selection, leveraging experience as global insured catastrophe losses reached about 120 billion USD in 2023 (Swiss Re). Proprietary models and active portfolio management help balance severity and frequency risks, improving loss-cost accuracy. This technical edge supports competitive pricing and targeted capacity allocation, differentiating Palomar from generalist carriers.
Data-driven pricing and portfolio analytics
Palomar leverages advanced catastrophe models and granular geospatial data to set rate adequacy with greater precision, aligning pricing to exposure characteristics observed in 2024. Dynamic exposure management limits accumulation in peak zones, reducing aggregation risk and supporting stable capital deployment. Analytics have measurably improved loss-ratio predictability over time and strengthen confidence among regulators and reinsurance partners.

Diverse catastrophe product suite
Palomar’s residential and commercial earthquake, flood and wind offerings spread peril risk across property lines, enabling cross-selling that can increase customer lifetime value and retention by roughly 20–30% in specialty-insurance channels. Product breadth lets the firm target underserved niches—commercial earthquake and coastal flood segments—reducing dependence on any single peril cycle and smoothing loss volatility.

Reinsurance partnerships and risk transfer
Palomar's robust reinsurance programs cap tail risk and smooth earnings, leveraging access to global reinsurers and the roughly USD100bn ILS market in 2024 to optimize cost of capital. Structured layers and event limits reduce loss volatility and protect solvency, supporting disciplined growth while preserving capital metrics.
- Caps tail risk via layered reinsurance
- Access to global reinsurers and ~USD100bn ILS (2024)
- Event limits protect capital and earnings stability
National distribution across brokers and MGAs
Palomar’s national distribution through brokers and MGAs expands its addressable market, letting it originate niche risks efficiently via partner channels and scale capital-light across states; this flexibility speeds entry into underserved regions and supports repeatable growth.
- Multi-state footprint broadens market
- Broker/MGA channels enable niche origination
- Distribution flexibility accelerates regional entry
- Supports scalable, capital-light growth
Proprietary catastrophe models and ILS access reduce tail risk and lift CLV 20-30%
Deep technical specialization in earthquake, flood and wind improves risk selection and pricing; proprietary catastrophe models and active exposure management reduce loss-ratio volatility and aggregation risk. Cross-selling raises customer lifetime value ~20–30%; layered reinsurance and access to the ~USD100bn ILS market (2024) cap tail risk and support scalable national distribution.
| Metric | Value |
|---|---|
| Insured cat losses (2023) | ~USD120bn (Swiss Re) |
| ILS market (2024) | ~USD100bn |
| CLV uplift | 20–30% |
What is included in the product
 Detailed Word Document
Delivers a strategic overview of Palomar’s internal and external business factors, outlining strengths, weaknesses, opportunities, and threats to inform competitive positioning and future risks.

 Customizable Excel Spreadsheet
Provides a focused Palomar SWOT matrix for fast strategy alignment and rapid identification/remediation of key pain points.
Weaknesses

Concentration in catastrophe-exposed segments
Palomar's heavy focus on earthquake, flood and wind re/insurance heightens tail-risk exposure and sensitivity to model and accumulation errors. 2023 saw 28 U.S. billion-dollar weather/climate disasters totaling $64.4 billion (NOAA), underscoring frequency of large losses. Concentration with limited diversification into non-cat lines allows losses to cluster across regions during active seasons, amplifying earnings volatility and reserve strain.
Dependence on reinsurance cost and capacity
Program economics hinge on renewal terms and retro availability; hardening reinsurance markets can compress margins or cap growth if retro capacity tightens. Counterparty concentration—reliance on a few reinsurers—heightens exposure to rating or capacity shocks. Pricing must adjust quickly to preserve returns as renewal cycles and retro settlements drive profitability.

Smaller scale versus national incumbents
Smaller balance sheet scale reduces Palomar's shock-absorption capacity, limiting ability to retain large losses and forcing reliance on reinsurance. Larger national peers often secure more favorable reinsurance structures and stronger distribution clout, widening cost and access gaps. Narrower brand recognition in several markets can raise customer acquisition costs and slow premium growth.

Geographic and peril aggregation risk
Exposures can still accumulate in high‑risk ZIP codes despite controls, creating concentrated loss potential; correlated events can breach modeled scenarios and produce losses beyond expectations. Managing micro‑aggregation requires constant pruning of portfolios and underwriting maps to prevent build‑ups. Data or model error can magnify outcomes and produce underestimation of tail risk.
- ZIP concentration risk
- Correlated-cat tail exposure
- Ongoing micro-aggregation cleanup
- Model/data amplification
Narrow product breadth beyond property cat
Palomar's product set remains concentrated in property catastrophe and a few adjacent property lines, leaving earnings exposed to underwriting cycles and large-cat events; management noted a majority exposure to property-related risks in recent filings. Limited expansion into adjacent specialty lines constrains cross-cycle diversification and reduces potential multi-line bundling benefits.
- Reliance on few lines heightens cycle sensitivity
- Cross-cycle earnings diversification constrained
- Expansion into adjacent specialty lines limited
- Restricts multi-line bundling advantages
Property cat concentration raises tail risk; 2023: 28 / $64.4B
Heavy concentration in property cat lines raises tail-risk and volatility; 2023 saw 28 U.S. billion‑dollar weather/climate disasters totaling $64.4B (NOAA). Reliance on reinsurance and limited scale constrain capacity to retain large losses and widen cost gaps versus larger peers. ZIP-code accumulation and model/data amplification remain material operational risks.
| Metric | Value | Source |
|---|---|---|
| US billion‑$ disasters (2023) | 28 / $64.4B | NOAA 2023 |
Full Version Awaits
Palomar SWOT Analysis
This is the actual Palomar SWOT analysis document you’ll receive upon purchase—no surprises, just professional quality. The preview below is taken directly from the full report you'll get; buy now to unlock the complete, editable version.

Make Insightful Decisions Backed by Expert Research
Palomar’s SWOT preview highlights competitive strengths, market threats, and tactical opportunities shaping near-term performance. For actionable strategies, financial context, and editable tools, purchase the full SWOT analysis—ideal for investors, consultants, and executives seeking a research-backed, presentation-ready report. Unlock the complete package today.
Strengths
Catastrophe underwriting expertise
Deep specialization in earthquake, flood and wind gives Palomar disciplined risk selection, leveraging experience as global insured catastrophe losses reached about 120 billion USD in 2023 (Swiss Re). Proprietary models and active portfolio management help balance severity and frequency risks, improving loss-cost accuracy. This technical edge supports competitive pricing and targeted capacity allocation, differentiating Palomar from generalist carriers.
Data-driven pricing and portfolio analytics
Palomar leverages advanced catastrophe models and granular geospatial data to set rate adequacy with greater precision, aligning pricing to exposure characteristics observed in 2024. Dynamic exposure management limits accumulation in peak zones, reducing aggregation risk and supporting stable capital deployment. Analytics have measurably improved loss-ratio predictability over time and strengthen confidence among regulators and reinsurance partners.
Diverse catastrophe product suite
Palomar’s residential and commercial earthquake, flood and wind offerings spread peril risk across property lines, enabling cross-selling that can increase customer lifetime value and retention by roughly 20–30% in specialty-insurance channels. Product breadth lets the firm target underserved niches—commercial earthquake and coastal flood segments—reducing dependence on any single peril cycle and smoothing loss volatility.
Reinsurance partnerships and risk transfer
Palomar's robust reinsurance programs cap tail risk and smooth earnings, leveraging access to global reinsurers and the roughly USD100bn ILS market in 2024 to optimize cost of capital. Structured layers and event limits reduce loss volatility and protect solvency, supporting disciplined growth while preserving capital metrics.
- Caps tail risk via layered reinsurance
- Access to global reinsurers and ~USD100bn ILS (2024)
- Event limits protect capital and earnings stability
National distribution across brokers and MGAs
Palomar’s national distribution through brokers and MGAs expands its addressable market, letting it originate niche risks efficiently via partner channels and scale capital-light across states; this flexibility speeds entry into underserved regions and supports repeatable growth.
- Multi-state footprint broadens market
- Broker/MGA channels enable niche origination
- Distribution flexibility accelerates regional entry
- Supports scalable, capital-light growth
Proprietary catastrophe models and ILS access reduce tail risk and lift CLV 20-30%
Deep technical specialization in earthquake, flood and wind improves risk selection and pricing; proprietary catastrophe models and active exposure management reduce loss-ratio volatility and aggregation risk. Cross-selling raises customer lifetime value ~20–30%; layered reinsurance and access to the ~USD100bn ILS market (2024) cap tail risk and support scalable national distribution.
| Metric | Value |
|---|---|
| Insured cat losses (2023) | ~USD120bn (Swiss Re) |
| ILS market (2024) | ~USD100bn |
| CLV uplift | 20–30% |
What is included in the product
Detailed Word Document
Delivers a strategic overview of Palomar’s internal and external business factors, outlining strengths, weaknesses, opportunities, and threats to inform competitive positioning and future risks.
Customizable Excel Spreadsheet
Provides a focused Palomar SWOT matrix for fast strategy alignment and rapid identification/remediation of key pain points.
Weaknesses
Concentration in catastrophe-exposed segments
Palomar's heavy focus on earthquake, flood and wind re/insurance heightens tail-risk exposure and sensitivity to model and accumulation errors. 2023 saw 28 U.S. billion-dollar weather/climate disasters totaling $64.4 billion (NOAA), underscoring frequency of large losses. Concentration with limited diversification into non-cat lines allows losses to cluster across regions during active seasons, amplifying earnings volatility and reserve strain.
Dependence on reinsurance cost and capacity
Program economics hinge on renewal terms and retro availability; hardening reinsurance markets can compress margins or cap growth if retro capacity tightens. Counterparty concentration—reliance on a few reinsurers—heightens exposure to rating or capacity shocks. Pricing must adjust quickly to preserve returns as renewal cycles and retro settlements drive profitability.
Smaller scale versus national incumbents
Smaller balance sheet scale reduces Palomar's shock-absorption capacity, limiting ability to retain large losses and forcing reliance on reinsurance. Larger national peers often secure more favorable reinsurance structures and stronger distribution clout, widening cost and access gaps. Narrower brand recognition in several markets can raise customer acquisition costs and slow premium growth.
Geographic and peril aggregation risk
Exposures can still accumulate in high‑risk ZIP codes despite controls, creating concentrated loss potential; correlated events can breach modeled scenarios and produce losses beyond expectations. Managing micro‑aggregation requires constant pruning of portfolios and underwriting maps to prevent build‑ups. Data or model error can magnify outcomes and produce underestimation of tail risk.
- ZIP concentration risk
- Correlated-cat tail exposure
- Ongoing micro-aggregation cleanup
- Model/data amplification
Narrow product breadth beyond property cat
Palomar's product set remains concentrated in property catastrophe and a few adjacent property lines, leaving earnings exposed to underwriting cycles and large-cat events; management noted a majority exposure to property-related risks in recent filings. Limited expansion into adjacent specialty lines constrains cross-cycle diversification and reduces potential multi-line bundling benefits.
- Reliance on few lines heightens cycle sensitivity
- Cross-cycle earnings diversification constrained
- Expansion into adjacent specialty lines limited
- Restricts multi-line bundling advantages
Property cat concentration raises tail risk; 2023: 28 / $64.4B
Heavy concentration in property cat lines raises tail-risk and volatility; 2023 saw 28 U.S. billion‑dollar weather/climate disasters totaling $64.4B (NOAA). Reliance on reinsurance and limited scale constrain capacity to retain large losses and widen cost gaps versus larger peers. ZIP-code accumulation and model/data amplification remain material operational risks.
| Metric | Value | Source |
|---|---|---|
| US billion‑$ disasters (2023) | 28 / $64.4B | NOAA 2023 |
Full Version Awaits
Palomar SWOT Analysis
This is the actual Palomar SWOT analysis document you’ll receive upon purchase—no surprises, just professional quality. The preview below is taken directly from the full report you'll get; buy now to unlock the complete, editable version.
Original: $10.00
-65%$10.00
$3.50Description
Make Insightful Decisions Backed by Expert Research
Palomar’s SWOT preview highlights competitive strengths, market threats, and tactical opportunities shaping near-term performance. For actionable strategies, financial context, and editable tools, purchase the full SWOT analysis—ideal for investors, consultants, and executives seeking a research-backed, presentation-ready report. Unlock the complete package today.
Strengths
Catastrophe underwriting expertise
Deep specialization in earthquake, flood and wind gives Palomar disciplined risk selection, leveraging experience as global insured catastrophe losses reached about 120 billion USD in 2023 (Swiss Re). Proprietary models and active portfolio management help balance severity and frequency risks, improving loss-cost accuracy. This technical edge supports competitive pricing and targeted capacity allocation, differentiating Palomar from generalist carriers.
Data-driven pricing and portfolio analytics
Palomar leverages advanced catastrophe models and granular geospatial data to set rate adequacy with greater precision, aligning pricing to exposure characteristics observed in 2024. Dynamic exposure management limits accumulation in peak zones, reducing aggregation risk and supporting stable capital deployment. Analytics have measurably improved loss-ratio predictability over time and strengthen confidence among regulators and reinsurance partners.
Diverse catastrophe product suite
Palomar’s residential and commercial earthquake, flood and wind offerings spread peril risk across property lines, enabling cross-selling that can increase customer lifetime value and retention by roughly 20–30% in specialty-insurance channels. Product breadth lets the firm target underserved niches—commercial earthquake and coastal flood segments—reducing dependence on any single peril cycle and smoothing loss volatility.
Reinsurance partnerships and risk transfer
Palomar's robust reinsurance programs cap tail risk and smooth earnings, leveraging access to global reinsurers and the roughly USD100bn ILS market in 2024 to optimize cost of capital. Structured layers and event limits reduce loss volatility and protect solvency, supporting disciplined growth while preserving capital metrics.
- Caps tail risk via layered reinsurance
- Access to global reinsurers and ~USD100bn ILS (2024)
- Event limits protect capital and earnings stability
National distribution across brokers and MGAs
Palomar’s national distribution through brokers and MGAs expands its addressable market, letting it originate niche risks efficiently via partner channels and scale capital-light across states; this flexibility speeds entry into underserved regions and supports repeatable growth.
- Multi-state footprint broadens market
- Broker/MGA channels enable niche origination
- Distribution flexibility accelerates regional entry
- Supports scalable, capital-light growth
Proprietary catastrophe models and ILS access reduce tail risk and lift CLV 20-30%
Deep technical specialization in earthquake, flood and wind improves risk selection and pricing; proprietary catastrophe models and active exposure management reduce loss-ratio volatility and aggregation risk. Cross-selling raises customer lifetime value ~20–30%; layered reinsurance and access to the ~USD100bn ILS market (2024) cap tail risk and support scalable national distribution.
| Metric | Value |
|---|---|
| Insured cat losses (2023) | ~USD120bn (Swiss Re) |
| ILS market (2024) | ~USD100bn |
| CLV uplift | 20–30% |
What is included in the product
Detailed Word Document
Delivers a strategic overview of Palomar’s internal and external business factors, outlining strengths, weaknesses, opportunities, and threats to inform competitive positioning and future risks.
Customizable Excel Spreadsheet
Provides a focused Palomar SWOT matrix for fast strategy alignment and rapid identification/remediation of key pain points.
Weaknesses
Concentration in catastrophe-exposed segments
Palomar's heavy focus on earthquake, flood and wind re/insurance heightens tail-risk exposure and sensitivity to model and accumulation errors. 2023 saw 28 U.S. billion-dollar weather/climate disasters totaling $64.4 billion (NOAA), underscoring frequency of large losses. Concentration with limited diversification into non-cat lines allows losses to cluster across regions during active seasons, amplifying earnings volatility and reserve strain.
Dependence on reinsurance cost and capacity
Program economics hinge on renewal terms and retro availability; hardening reinsurance markets can compress margins or cap growth if retro capacity tightens. Counterparty concentration—reliance on a few reinsurers—heightens exposure to rating or capacity shocks. Pricing must adjust quickly to preserve returns as renewal cycles and retro settlements drive profitability.
Smaller scale versus national incumbents
Smaller balance sheet scale reduces Palomar's shock-absorption capacity, limiting ability to retain large losses and forcing reliance on reinsurance. Larger national peers often secure more favorable reinsurance structures and stronger distribution clout, widening cost and access gaps. Narrower brand recognition in several markets can raise customer acquisition costs and slow premium growth.
Geographic and peril aggregation risk
Exposures can still accumulate in high‑risk ZIP codes despite controls, creating concentrated loss potential; correlated events can breach modeled scenarios and produce losses beyond expectations. Managing micro‑aggregation requires constant pruning of portfolios and underwriting maps to prevent build‑ups. Data or model error can magnify outcomes and produce underestimation of tail risk.
- ZIP concentration risk
- Correlated-cat tail exposure
- Ongoing micro-aggregation cleanup
- Model/data amplification
Narrow product breadth beyond property cat
Palomar's product set remains concentrated in property catastrophe and a few adjacent property lines, leaving earnings exposed to underwriting cycles and large-cat events; management noted a majority exposure to property-related risks in recent filings. Limited expansion into adjacent specialty lines constrains cross-cycle diversification and reduces potential multi-line bundling benefits.
- Reliance on few lines heightens cycle sensitivity
- Cross-cycle earnings diversification constrained
- Expansion into adjacent specialty lines limited
- Restricts multi-line bundling advantages
Property cat concentration raises tail risk; 2023: 28 / $64.4B
Heavy concentration in property cat lines raises tail-risk and volatility; 2023 saw 28 U.S. billion‑dollar weather/climate disasters totaling $64.4B (NOAA). Reliance on reinsurance and limited scale constrain capacity to retain large losses and widen cost gaps versus larger peers. ZIP-code accumulation and model/data amplification remain material operational risks.
| Metric | Value | Source |
|---|---|---|
| US billion‑$ disasters (2023) | 28 / $64.4B | NOAA 2023 |
Full Version Awaits
Palomar SWOT Analysis
This is the actual Palomar SWOT analysis document you’ll receive upon purchase—no surprises, just professional quality. The preview below is taken directly from the full report you'll get; buy now to unlock the complete, editable version.











