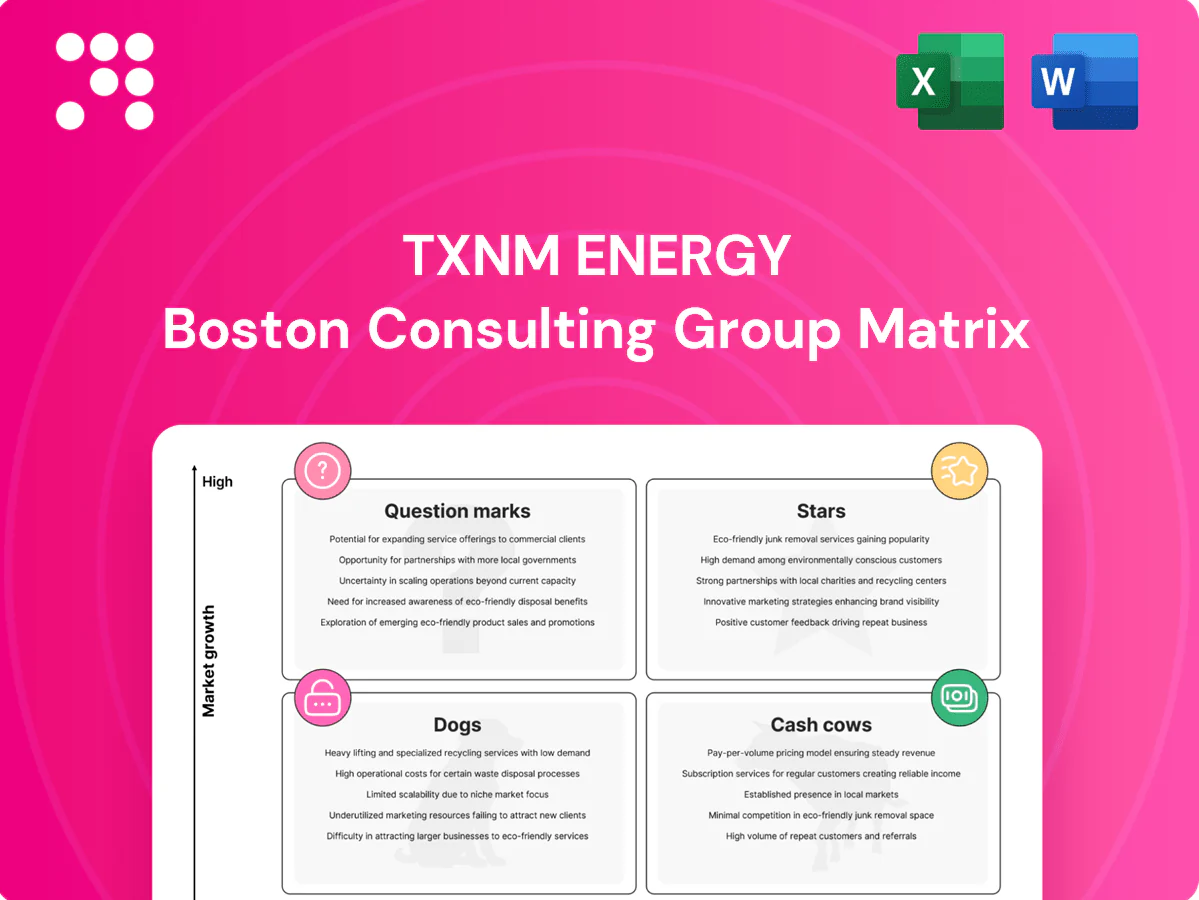
TXNM Energy Boston Consulting Group Matrix

Actionable Strategy Starts Here
TXNM Energy’s BCG Matrix preview shows where flagship offerings sit in the market — which are pulling ahead, which need reinvention, and which quietly cost you cash and focus. Want the full picture with quadrant-by-quadrant placement, data-driven recommendations, and tactical moves you can use right away? Purchase the complete BCG Matrix to get a polished Word report plus an Excel summary, ready to present and act on. Skip the guesswork—buy now and turn insight into smarter investment and product decisions.
Stars

Utility‑scale renewables buildout
PNM’s utility‑scale wind and solar capacity scaled to roughly 1 GW operational with a >2 GW pipeline in 2024, cementing its incumbent share across its service territory.
Policy drivers and corporate offtake kept the pipeline hot throughout 2024, sustaining high project velocity and signed PPAs.
Interconnection and PPA payments still consume cash in 2024, but the growth trajectory justifies continued investment to lock in future cash‑cow returns.
Grid‑scale battery storage
Grid‑scale battery storage smooths variable renewables and secures reliability, aligning with 2024 regulatory pushes to prioritize dispatchable capacity in utility plans. As incumbent, PNM retains the retail relationship and proprietary dispatch/customer usage data, creating a competitive edge for site selection and aggregation. Capex is front‑loaded today, but prevailing rate‑recovery practices and recognized capacity value make economics viable. Targeted investments at high‑value nodes cut peak costs and boost ROI.

Renewable energy tariffs/green rider programs
Large C&I customers demand clean megawatt‑hours with contractual certainty; PNM can bundle PPAs plus renewable credits and keep those loads on‑system, driving high attach rates amid growing demand. ERCOT reached roughly 35% wind and solar generation in 2023, signaling market momentum. Local competition is limited, so scaling offerings and streamlining approvals will capture share and lift margins.

Transmission to unlock renewables
New lines and upgrades enable more wind and solar to flow, with growth tied to regional interconnect needs. PNM’s footprint gives it first call on routing and cost recovery. Long lead times typically 5–10 years, but once in rate base assets deliver durable regulated returns over 30–40+ years. Prioritize high-congestion corridors to reduce curtailment and unlock capacity.
- Tag: lead-time 5–10 years
- Tag: asset-life 30–40+ years
- Tag: first-call routing and cost recovery
- Tag: prioritize high-congestion corridors
EV load programs (make‑ready + rates)
Transport electrification is accelerating from fleets to multifamily, with US light‑duty EV market share rising to about 8.5% in 2024; TXNM Energy’s EV load is a Star as demand and charging density expand. PNM’s make‑ready and managed charging rates capture growth by subsidizing infrastructure and shifting load via TOU to keep peaks controlled. Double down on fleets, depots, and highway corridors to maximize utilization and revenue.
- PNM make‑ready + managed rates
- TOU keeps peaks down
- Focus: fleets, depots, corridors
- 2024 US EV share ~8.5%
~1 GW operating, >2 GW pipeline — batteries, retail data and ~8.5% EV load drive growth
PNM utility wind+solar ~1 GW operational, >2 GW pipeline in 2024; growth driven by policy and corporate offtake. Interconnection/PPA costs are front‑loaded but rate recovery and capacity value justify investment. Grid batteries and retail data create dispatch/selection edge. EV load (~8.5% US LDV share 2024) and make‑ready rates are high‑growth Stars.
| Metric | 2024 |
|---|---|
| Operational wind+solar | ~1 GW |
| Pipeline | >2 GW |
| ERCOT renewables | ~35% |
| US EV LDV share | ~8.5% |
| Lead time | 5–10 yrs |
| Asset life | 30–40+ yrs |
What is included in the product
 Detailed Word Document
BCG Matrix review of TXNM Energy mapping Stars, Cash Cows, Question Marks and Dogs with strategic actions.

 Customizable Excel Spreadsheet
One-page TXNM Energy BCG Matrix mapping units to quadrants for fast strategic clarity and stakeholder-ready presentations.
Cash Cows

Regulated electric distribution
Regulated electric distribution is a mature, high‑share cash cow for TXNM, delivering steady returns under the rate‑base model with allowed ROE near 9–10% in 2024. Ongoing O&M and targeted smart‑grid upgrades raise operational efficiency and reliability. Low promotional spend keeps cash generation predictable. Milk while optimizing SAIDI/SAIFI performance.
Transmission rate base (existing)
TXNM’s existing transmission rate base delivered regulated returns in 2024 with modest rate-base growth, driven by steady demand and cost-recovery mechanisms. Ongoing maintenance and targeted incremental upgrades kept capital expenditure predictable and within budget. Revenues remained stable in 2024, hedging commodity cycles while strong SAIDI/SAIFI performance and tight cost control preserved margins.

Residential & small C&I retail service
Residential & small C&I retail service is a stable core customer book with low churn (~8% in 2024) and baked‑in demand; margins track approved rates and decoupling where applicable. Limited marketing spend needed; focus on service quality and billing accuracy (>99% billed correctly in 2024) to sustain trust.

Natural gas distribution (core territory)
Natural gas distribution in core territory is a mature, high-share business with predictable winter load profiles and stable throughput, supporting reliable cash generation; safety and leak-reduction programs improve operational efficiency and regulatory goodwill. Capex is disciplined, focused on maintaining pipelines and modernization where clear ROI exists, preserving solid free cash flow.
- High market share, stable winter demand
- Safety-driven efficiency & regulatory goodwill
- Disciplined capex; prioritize ROI
- Maintain & modernize pipelines
Billing, metering, and customer operations
Billing, metering, and customer operations are stable, scaled platforms supporting TXNM Energy’s entire book; advanced metering infrastructure (AMI) cuts truck rolls and non-technical losses by roughly 40–60%, anchoring margin stability despite low revenue growth. Incremental automation (robotic process automation, predictive analytics) can lift cash conversion and lower O&M, squeezing additional free cash flow.
- Stable platform: enterprise-wide billing backbone
- AMI impact: ~40–60% reduction in truck rolls/losses
- Growth: low; Margin: high/stable
- Automation: up to ~10–15% incremental cash uplift
Regulated grid: steady cash flow, allowed ROE 9–10%, AMI + automation upside
Regulated distribution and transmission are mature cash cows for TXNM, delivering allowed ROE ~9–10% in 2024 with predictable rate‑base returns; residential churn ~8% and billing accuracy >99% sustain cash flow. AMI reduced truck rolls ~40–60% in 2024; targeted automation can add ~10–15% cash uplift. Capex disciplined; focus on pipeline modernization and reliability metrics.
| Metric | 2024 |
|---|---|
| Allowed ROE | 9–10% |
| Residential churn | ~8% |
| Billing accuracy | >99% |
| AMI truck-roll reduction | 40–60% |
| Automation cash uplift | 10–15% |
What You See Is What You Get
TXNM Energy BCG Matrix
The file you're previewing here is the exact TXNM Energy BCG Matrix report you'll receive after purchase — no watermarks, no placeholders, just the finished, fully formatted analysis. Crafted for clarity and strategic action, it’s ready to edit, print, or present to investors and your team. Once bought, the final file lands in your inbox immediately. No surprises — just plug-and-play strategy.

Actionable Strategy Starts Here
TXNM Energy’s BCG Matrix preview shows where flagship offerings sit in the market — which are pulling ahead, which need reinvention, and which quietly cost you cash and focus. Want the full picture with quadrant-by-quadrant placement, data-driven recommendations, and tactical moves you can use right away? Purchase the complete BCG Matrix to get a polished Word report plus an Excel summary, ready to present and act on. Skip the guesswork—buy now and turn insight into smarter investment and product decisions.
Stars
Utility‑scale renewables buildout
PNM’s utility‑scale wind and solar capacity scaled to roughly 1 GW operational with a >2 GW pipeline in 2024, cementing its incumbent share across its service territory.
Policy drivers and corporate offtake kept the pipeline hot throughout 2024, sustaining high project velocity and signed PPAs.
Interconnection and PPA payments still consume cash in 2024, but the growth trajectory justifies continued investment to lock in future cash‑cow returns.
Grid‑scale battery storage
Grid‑scale battery storage smooths variable renewables and secures reliability, aligning with 2024 regulatory pushes to prioritize dispatchable capacity in utility plans. As incumbent, PNM retains the retail relationship and proprietary dispatch/customer usage data, creating a competitive edge for site selection and aggregation. Capex is front‑loaded today, but prevailing rate‑recovery practices and recognized capacity value make economics viable. Targeted investments at high‑value nodes cut peak costs and boost ROI.
Renewable energy tariffs/green rider programs
Large C&I customers demand clean megawatt‑hours with contractual certainty; PNM can bundle PPAs plus renewable credits and keep those loads on‑system, driving high attach rates amid growing demand. ERCOT reached roughly 35% wind and solar generation in 2023, signaling market momentum. Local competition is limited, so scaling offerings and streamlining approvals will capture share and lift margins.
Transmission to unlock renewables
New lines and upgrades enable more wind and solar to flow, with growth tied to regional interconnect needs. PNM’s footprint gives it first call on routing and cost recovery. Long lead times typically 5–10 years, but once in rate base assets deliver durable regulated returns over 30–40+ years. Prioritize high-congestion corridors to reduce curtailment and unlock capacity.
- Tag: lead-time 5–10 years
- Tag: asset-life 30–40+ years
- Tag: first-call routing and cost recovery
- Tag: prioritize high-congestion corridors
EV load programs (make‑ready + rates)
Transport electrification is accelerating from fleets to multifamily, with US light‑duty EV market share rising to about 8.5% in 2024; TXNM Energy’s EV load is a Star as demand and charging density expand. PNM’s make‑ready and managed charging rates capture growth by subsidizing infrastructure and shifting load via TOU to keep peaks controlled. Double down on fleets, depots, and highway corridors to maximize utilization and revenue.
- PNM make‑ready + managed rates
- TOU keeps peaks down
- Focus: fleets, depots, corridors
- 2024 US EV share ~8.5%
~1 GW operating, >2 GW pipeline — batteries, retail data and ~8.5% EV load drive growth
PNM utility wind+solar ~1 GW operational, >2 GW pipeline in 2024; growth driven by policy and corporate offtake. Interconnection/PPA costs are front‑loaded but rate recovery and capacity value justify investment. Grid batteries and retail data create dispatch/selection edge. EV load (~8.5% US LDV share 2024) and make‑ready rates are high‑growth Stars.
| Metric | 2024 |
|---|---|
| Operational wind+solar | ~1 GW |
| Pipeline | >2 GW |
| ERCOT renewables | ~35% |
| US EV LDV share | ~8.5% |
| Lead time | 5–10 yrs |
| Asset life | 30–40+ yrs |
What is included in the product
Detailed Word Document
BCG Matrix review of TXNM Energy mapping Stars, Cash Cows, Question Marks and Dogs with strategic actions.
Customizable Excel Spreadsheet
One-page TXNM Energy BCG Matrix mapping units to quadrants for fast strategic clarity and stakeholder-ready presentations.
Cash Cows
Regulated electric distribution
Regulated electric distribution is a mature, high‑share cash cow for TXNM, delivering steady returns under the rate‑base model with allowed ROE near 9–10% in 2024. Ongoing O&M and targeted smart‑grid upgrades raise operational efficiency and reliability. Low promotional spend keeps cash generation predictable. Milk while optimizing SAIDI/SAIFI performance.
Transmission rate base (existing)
TXNM’s existing transmission rate base delivered regulated returns in 2024 with modest rate-base growth, driven by steady demand and cost-recovery mechanisms. Ongoing maintenance and targeted incremental upgrades kept capital expenditure predictable and within budget. Revenues remained stable in 2024, hedging commodity cycles while strong SAIDI/SAIFI performance and tight cost control preserved margins.
Residential & small C&I retail service
Residential & small C&I retail service is a stable core customer book with low churn (~8% in 2024) and baked‑in demand; margins track approved rates and decoupling where applicable. Limited marketing spend needed; focus on service quality and billing accuracy (>99% billed correctly in 2024) to sustain trust.
Natural gas distribution (core territory)
Natural gas distribution in core territory is a mature, high-share business with predictable winter load profiles and stable throughput, supporting reliable cash generation; safety and leak-reduction programs improve operational efficiency and regulatory goodwill. Capex is disciplined, focused on maintaining pipelines and modernization where clear ROI exists, preserving solid free cash flow.
- High market share, stable winter demand
- Safety-driven efficiency & regulatory goodwill
- Disciplined capex; prioritize ROI
- Maintain & modernize pipelines
Billing, metering, and customer operations
Billing, metering, and customer operations are stable, scaled platforms supporting TXNM Energy’s entire book; advanced metering infrastructure (AMI) cuts truck rolls and non-technical losses by roughly 40–60%, anchoring margin stability despite low revenue growth. Incremental automation (robotic process automation, predictive analytics) can lift cash conversion and lower O&M, squeezing additional free cash flow.
- Stable platform: enterprise-wide billing backbone
- AMI impact: ~40–60% reduction in truck rolls/losses
- Growth: low; Margin: high/stable
- Automation: up to ~10–15% incremental cash uplift
Regulated grid: steady cash flow, allowed ROE 9–10%, AMI + automation upside
Regulated distribution and transmission are mature cash cows for TXNM, delivering allowed ROE ~9–10% in 2024 with predictable rate‑base returns; residential churn ~8% and billing accuracy >99% sustain cash flow. AMI reduced truck rolls ~40–60% in 2024; targeted automation can add ~10–15% cash uplift. Capex disciplined; focus on pipeline modernization and reliability metrics.
| Metric | 2024 |
|---|---|
| Allowed ROE | 9–10% |
| Residential churn | ~8% |
| Billing accuracy | >99% |
| AMI truck-roll reduction | 40–60% |
| Automation cash uplift | 10–15% |
What You See Is What You Get
TXNM Energy BCG Matrix
The file you're previewing here is the exact TXNM Energy BCG Matrix report you'll receive after purchase — no watermarks, no placeholders, just the finished, fully formatted analysis. Crafted for clarity and strategic action, it’s ready to edit, print, or present to investors and your team. Once bought, the final file lands in your inbox immediately. No surprises — just plug-and-play strategy.
Original: $10.00
-65%$10.00
$3.50Description
Actionable Strategy Starts Here
TXNM Energy’s BCG Matrix preview shows where flagship offerings sit in the market — which are pulling ahead, which need reinvention, and which quietly cost you cash and focus. Want the full picture with quadrant-by-quadrant placement, data-driven recommendations, and tactical moves you can use right away? Purchase the complete BCG Matrix to get a polished Word report plus an Excel summary, ready to present and act on. Skip the guesswork—buy now and turn insight into smarter investment and product decisions.
Stars
Utility‑scale renewables buildout
PNM’s utility‑scale wind and solar capacity scaled to roughly 1 GW operational with a >2 GW pipeline in 2024, cementing its incumbent share across its service territory.
Policy drivers and corporate offtake kept the pipeline hot throughout 2024, sustaining high project velocity and signed PPAs.
Interconnection and PPA payments still consume cash in 2024, but the growth trajectory justifies continued investment to lock in future cash‑cow returns.
Grid‑scale battery storage
Grid‑scale battery storage smooths variable renewables and secures reliability, aligning with 2024 regulatory pushes to prioritize dispatchable capacity in utility plans. As incumbent, PNM retains the retail relationship and proprietary dispatch/customer usage data, creating a competitive edge for site selection and aggregation. Capex is front‑loaded today, but prevailing rate‑recovery practices and recognized capacity value make economics viable. Targeted investments at high‑value nodes cut peak costs and boost ROI.
Renewable energy tariffs/green rider programs
Large C&I customers demand clean megawatt‑hours with contractual certainty; PNM can bundle PPAs plus renewable credits and keep those loads on‑system, driving high attach rates amid growing demand. ERCOT reached roughly 35% wind and solar generation in 2023, signaling market momentum. Local competition is limited, so scaling offerings and streamlining approvals will capture share and lift margins.
Transmission to unlock renewables
New lines and upgrades enable more wind and solar to flow, with growth tied to regional interconnect needs. PNM’s footprint gives it first call on routing and cost recovery. Long lead times typically 5–10 years, but once in rate base assets deliver durable regulated returns over 30–40+ years. Prioritize high-congestion corridors to reduce curtailment and unlock capacity.
- Tag: lead-time 5–10 years
- Tag: asset-life 30–40+ years
- Tag: first-call routing and cost recovery
- Tag: prioritize high-congestion corridors
EV load programs (make‑ready + rates)
Transport electrification is accelerating from fleets to multifamily, with US light‑duty EV market share rising to about 8.5% in 2024; TXNM Energy’s EV load is a Star as demand and charging density expand. PNM’s make‑ready and managed charging rates capture growth by subsidizing infrastructure and shifting load via TOU to keep peaks controlled. Double down on fleets, depots, and highway corridors to maximize utilization and revenue.
- PNM make‑ready + managed rates
- TOU keeps peaks down
- Focus: fleets, depots, corridors
- 2024 US EV share ~8.5%
~1 GW operating, >2 GW pipeline — batteries, retail data and ~8.5% EV load drive growth
PNM utility wind+solar ~1 GW operational, >2 GW pipeline in 2024; growth driven by policy and corporate offtake. Interconnection/PPA costs are front‑loaded but rate recovery and capacity value justify investment. Grid batteries and retail data create dispatch/selection edge. EV load (~8.5% US LDV share 2024) and make‑ready rates are high‑growth Stars.
| Metric | 2024 |
|---|---|
| Operational wind+solar | ~1 GW |
| Pipeline | >2 GW |
| ERCOT renewables | ~35% |
| US EV LDV share | ~8.5% |
| Lead time | 5–10 yrs |
| Asset life | 30–40+ yrs |
What is included in the product
Detailed Word Document
BCG Matrix review of TXNM Energy mapping Stars, Cash Cows, Question Marks and Dogs with strategic actions.
Customizable Excel Spreadsheet
One-page TXNM Energy BCG Matrix mapping units to quadrants for fast strategic clarity and stakeholder-ready presentations.
Cash Cows
Regulated electric distribution
Regulated electric distribution is a mature, high‑share cash cow for TXNM, delivering steady returns under the rate‑base model with allowed ROE near 9–10% in 2024. Ongoing O&M and targeted smart‑grid upgrades raise operational efficiency and reliability. Low promotional spend keeps cash generation predictable. Milk while optimizing SAIDI/SAIFI performance.
Transmission rate base (existing)
TXNM’s existing transmission rate base delivered regulated returns in 2024 with modest rate-base growth, driven by steady demand and cost-recovery mechanisms. Ongoing maintenance and targeted incremental upgrades kept capital expenditure predictable and within budget. Revenues remained stable in 2024, hedging commodity cycles while strong SAIDI/SAIFI performance and tight cost control preserved margins.
Residential & small C&I retail service
Residential & small C&I retail service is a stable core customer book with low churn (~8% in 2024) and baked‑in demand; margins track approved rates and decoupling where applicable. Limited marketing spend needed; focus on service quality and billing accuracy (>99% billed correctly in 2024) to sustain trust.
Natural gas distribution (core territory)
Natural gas distribution in core territory is a mature, high-share business with predictable winter load profiles and stable throughput, supporting reliable cash generation; safety and leak-reduction programs improve operational efficiency and regulatory goodwill. Capex is disciplined, focused on maintaining pipelines and modernization where clear ROI exists, preserving solid free cash flow.
- High market share, stable winter demand
- Safety-driven efficiency & regulatory goodwill
- Disciplined capex; prioritize ROI
- Maintain & modernize pipelines
Billing, metering, and customer operations
Billing, metering, and customer operations are stable, scaled platforms supporting TXNM Energy’s entire book; advanced metering infrastructure (AMI) cuts truck rolls and non-technical losses by roughly 40–60%, anchoring margin stability despite low revenue growth. Incremental automation (robotic process automation, predictive analytics) can lift cash conversion and lower O&M, squeezing additional free cash flow.
- Stable platform: enterprise-wide billing backbone
- AMI impact: ~40–60% reduction in truck rolls/losses
- Growth: low; Margin: high/stable
- Automation: up to ~10–15% incremental cash uplift
Regulated grid: steady cash flow, allowed ROE 9–10%, AMI + automation upside
Regulated distribution and transmission are mature cash cows for TXNM, delivering allowed ROE ~9–10% in 2024 with predictable rate‑base returns; residential churn ~8% and billing accuracy >99% sustain cash flow. AMI reduced truck rolls ~40–60% in 2024; targeted automation can add ~10–15% cash uplift. Capex disciplined; focus on pipeline modernization and reliability metrics.
| Metric | 2024 |
|---|---|
| Allowed ROE | 9–10% |
| Residential churn | ~8% |
| Billing accuracy | >99% |
| AMI truck-roll reduction | 40–60% |
| Automation cash uplift | 10–15% |
What You See Is What You Get
TXNM Energy BCG Matrix
The file you're previewing here is the exact TXNM Energy BCG Matrix report you'll receive after purchase — no watermarks, no placeholders, just the finished, fully formatted analysis. Crafted for clarity and strategic action, it’s ready to edit, print, or present to investors and your team. Once bought, the final file lands in your inbox immediately. No surprises — just plug-and-play strategy.











