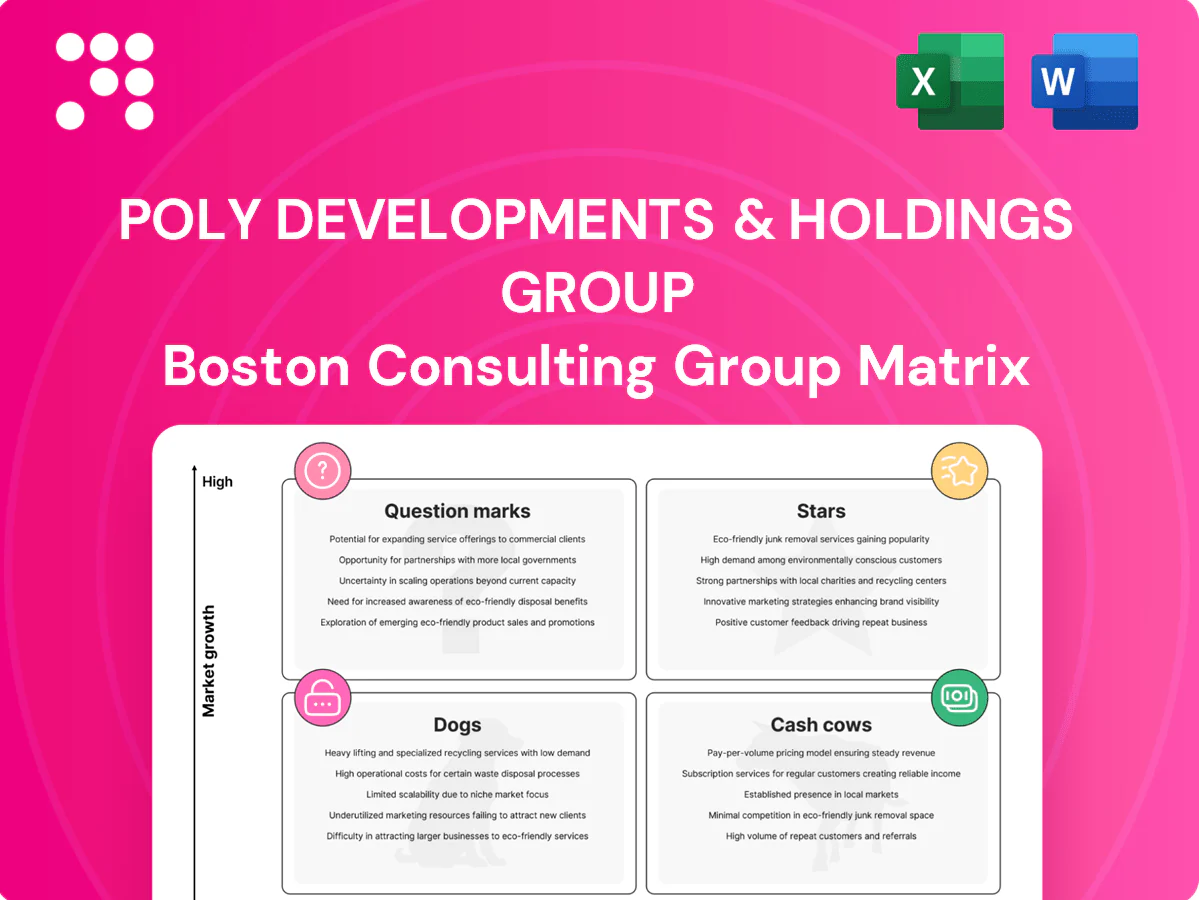
Poly Developments & Holdings Group Boston Consulting Group Matrix

Actionable Strategy Starts Here
Quick snapshot: Poly Developments & Holdings shows mixed momentum across segments—some assets behaving like Stars, others edging toward Cash Cows, and a couple that look like Question Marks you can’t ignore. This preview hints at allocation risks and growth levers; the full BCG Matrix gives quadrant-by-quadrant placements, hard data, and actionable moves to optimize cash flow and investment. Purchase the complete report for Word + Excel deliverables and a ready-to-use strategic roadmap you can implement this quarter.
Stars

Tier-1 mixed‑use flagships
Poly’s landmark mixed‑use flagships in Beijing, Shanghai and Shenzhen sit in fast‑growing urban cores with sustained high demand and lead their micro‑markets across retail, office and residential catchment. They generate strong cross‑segment footfall and brand spillovers but consume cash on leasing, activation and placemaking during rollout. With continued funding and operational focus, these assets are positioned to transition from investment drains into outsized cash generators.
GBA/YRD premium residential
High-end residential in the Greater Bay Area (population ~86 million) and Yangtze River Delta (~240 million) benefits from continued upgrade demand as China rebalanced consumption after 2023 GDP growth of 5.2%, supporting premium absorption in 2024.
Poly’s SOE backing and brand strength sustain pricing power and high sell-through versus peers, while aggressive marketing and land-premium loading compress near-term cash flow.
Maintaining share through cycles turns these star projects into durable cash cows as urbanization and rising incomes drive repeat upgrades.

Urban renewal PPPs
City-backed urban renewal PPPs unlock scarce core-district land with built-in demand; timelines commonly span 5–10 years, and Poly’s scale and government ties position it as a front-runner. Early phases absorb heavy cash for relocation, infrastructure and stakeholder work (often a material share of upfront spend). Once assets stabilize, the pipeline generates substantial, lower-risk operating cashflow.

Industrial/logistics parks
Industrial/logistics parks benefit from ongoing e-commerce and high-value manufacturing growth; in 2024 new parks in China’s growth corridors are leasing within 6–12 months while modern-node vacancy often sits below 8%, though initial capex per park can reach RMB 300–600 million.
Poly holds strong market share in selected nodes with scope to add logistics tech and 3PL services; invest now to secure leadership before demand growth moderates.
- Leasing velocity: 6–12 months (2024)
- Core-node vacancy: <8% (2024)
- Capex per park: RMB 300–600m
- Value-add: logistics tech, 3PL, cold-chain
Smart community services
Smart community services at Poly are scaling via embedded digital bundles for access, energy and amenities; industry reports show mid-single-digit to double-digit attach-rate uplift per handover in 2023–24, deepening lock-in and recurring revenue. Growth requires sustained product, tech and ops spend to reach delivery standards; if share holds, it converts to a low-churn profit engine.
- Embedded bundles: access, energy, amenities
- Attach-rate uplift: mid-single to double-digit (2023–24)
- Requires product/tech/ops investment
- Potential outcome: low-churn, high-margin recurring revenue
Urban flagships ~92% occupied; GBA/YRD luxury +6% YoY; logistics 8% vacancy, capex drain
Poly’s star mixed‑use flagships in Beijing/Shanghai/Shenzhen show ~92% occupancy and strong cross‑segment spillovers but need continued capex and leasing spend to stabilize cashflow. GBA/YRD high‑end residential absorption rose ~6% YoY (2024) supported by 2023 GDP rebound. Logistics nodes report ~8% vacancy and RMB300–600m capex per park; smart‑services lift attach rates mid‑single to double digits.
| Metric | 2024 |
|---|---|
| Urban flagship occupancy | 92% |
| GBA/YRD premium absorption | +6% YoY |
| Logistics vacancy | 8% |
| Capex per park | RMB300–600m |
What is included in the product
 Detailed Word Document
Comprehensive BCG analysis of Poly Developments' portfolio, identifying Stars, Cash Cows, Question Marks and Dogs with strategic recommendations.

 Customizable Excel Spreadsheet
One-page BCG matrix for Poly Developments & Holdings — each business unit in a quadrant, clarity for fast strategic decisions.
Cash Cows

Property management fees
Poly's property management fees are a stable cash cow: a large installed base across Chinese cities delivers recurring revenue with low churn and predictable cash flows as of 2024. Operations are highly standardized and margins rise with scale and digital tools, improving operating margin headroom. Growth is modest, typically mid-single digits, but cash conversion remains strong, so prioritize heavy cash returns while investing selectively in efficiency.
Mature residential inventories
Mature residential inventories in established cities act as cash cows for Poly Developments, selling steadily at mid-market prices with minimal promotional pressure. Earlier-landbanking supports defensible gross margins and low incremental cost, so growth is limited but sales collections and modest maintenance capex generate strong free cash flow. Management should maintain sales pace, avoid discount wars, and harvest cash for deleveraging or strategic reinvestment.

Stabilized commercial rents
Leased-up retail and offices in core districts generate steady NOI, with portfolio performance holding through 2024 despite muted market growth. Capex remains maintenance-level and leasing is repeatable with an established tenant base. Occupancy and rents have proved resilient, allowing proceeds to fund next-wave growth or de-lever.

Parking and ancillary income
Parking, storage and small-format services across Poly Developments are sticky, high-margin cash cows requiring minimal marketing and driven by operational discipline; 2024 company disclosures highlight steady ancillary cash flows supporting liquidity. Growth is incremental but cumulative cash generation is material—centralize billing, squeeze efficiency and keep the drip steady to maximize ROI.
- Low-touch, high-margin recurring income
- Operational discipline > marketing
- Centralize billing; improve efficiency
Hotel/serviced apartments (core)
Hotel/serviced apartments (core) are central, stabilized assets where RevPAR has returned to near‑prepandemic levels in 2024 (STR reported China RevPAR recovery), costs are predictable and brand pull delivers steady occupancy; not hyper‑growth but reliable free cash flow and manageable rolling capex cycles. Maintain high operational standards and harvest the run‑rate.
- Stable RevPAR: 2024 recovery (STR)
- Predictable Opex, steady FCF
- Rolling capex, harvest strategy
Cash-harvest focus: 28% prop mgmt, 22% residential, steady NOI & RevPAR
Poly's cash cows—property management, mature residential sales, core retail/offices, parking and hotels—delivered stable cash conversion in 2024: property management margins ~28%, residential gross margin ~22%, core NOI growth ~3–4% YoY, RevPAR ~95% of 2019. Prioritize cash harvest, centralize billing and selective capex to fund deleveraging.
| Segment | 2024 Metric | Cash yield |
|---|---|---|
| Prop mgmt | Margin 28% | High |
| Residential | Gross 22% | High |
| Retail/Office | NNI +3–4% YoY | Moderate |
| Hotels | RevPAR 95% of 2019 | Moderate |
What You See Is What You Get
Poly Developments & Holdings Group BCG Matrix
The file you're previewing is the final Poly Developments & Holdings BCG Matrix you'll receive after purchase. No watermarks or demo content—just a polished, ready-to-use strategic report. It arrives immediately for download or email, fully editable and formatted to present to investors, boards, or your leadership team.

Actionable Strategy Starts Here
Quick snapshot: Poly Developments & Holdings shows mixed momentum across segments—some assets behaving like Stars, others edging toward Cash Cows, and a couple that look like Question Marks you can’t ignore. This preview hints at allocation risks and growth levers; the full BCG Matrix gives quadrant-by-quadrant placements, hard data, and actionable moves to optimize cash flow and investment. Purchase the complete report for Word + Excel deliverables and a ready-to-use strategic roadmap you can implement this quarter.
Stars
Tier-1 mixed‑use flagships
Poly’s landmark mixed‑use flagships in Beijing, Shanghai and Shenzhen sit in fast‑growing urban cores with sustained high demand and lead their micro‑markets across retail, office and residential catchment. They generate strong cross‑segment footfall and brand spillovers but consume cash on leasing, activation and placemaking during rollout. With continued funding and operational focus, these assets are positioned to transition from investment drains into outsized cash generators.
GBA/YRD premium residential
High-end residential in the Greater Bay Area (population ~86 million) and Yangtze River Delta (~240 million) benefits from continued upgrade demand as China rebalanced consumption after 2023 GDP growth of 5.2%, supporting premium absorption in 2024.
Poly’s SOE backing and brand strength sustain pricing power and high sell-through versus peers, while aggressive marketing and land-premium loading compress near-term cash flow.
Maintaining share through cycles turns these star projects into durable cash cows as urbanization and rising incomes drive repeat upgrades.
Urban renewal PPPs
City-backed urban renewal PPPs unlock scarce core-district land with built-in demand; timelines commonly span 5–10 years, and Poly’s scale and government ties position it as a front-runner. Early phases absorb heavy cash for relocation, infrastructure and stakeholder work (often a material share of upfront spend). Once assets stabilize, the pipeline generates substantial, lower-risk operating cashflow.
Industrial/logistics parks
Industrial/logistics parks benefit from ongoing e-commerce and high-value manufacturing growth; in 2024 new parks in China’s growth corridors are leasing within 6–12 months while modern-node vacancy often sits below 8%, though initial capex per park can reach RMB 300–600 million.
Poly holds strong market share in selected nodes with scope to add logistics tech and 3PL services; invest now to secure leadership before demand growth moderates.
- Leasing velocity: 6–12 months (2024)
- Core-node vacancy: <8% (2024)
- Capex per park: RMB 300–600m
- Value-add: logistics tech, 3PL, cold-chain
Smart community services
Smart community services at Poly are scaling via embedded digital bundles for access, energy and amenities; industry reports show mid-single-digit to double-digit attach-rate uplift per handover in 2023–24, deepening lock-in and recurring revenue. Growth requires sustained product, tech and ops spend to reach delivery standards; if share holds, it converts to a low-churn profit engine.
- Embedded bundles: access, energy, amenities
- Attach-rate uplift: mid-single to double-digit (2023–24)
- Requires product/tech/ops investment
- Potential outcome: low-churn, high-margin recurring revenue
Urban flagships ~92% occupied; GBA/YRD luxury +6% YoY; logistics 8% vacancy, capex drain
Poly’s star mixed‑use flagships in Beijing/Shanghai/Shenzhen show ~92% occupancy and strong cross‑segment spillovers but need continued capex and leasing spend to stabilize cashflow. GBA/YRD high‑end residential absorption rose ~6% YoY (2024) supported by 2023 GDP rebound. Logistics nodes report ~8% vacancy and RMB300–600m capex per park; smart‑services lift attach rates mid‑single to double digits.
| Metric | 2024 |
|---|---|
| Urban flagship occupancy | 92% |
| GBA/YRD premium absorption | +6% YoY |
| Logistics vacancy | 8% |
| Capex per park | RMB300–600m |
What is included in the product
Detailed Word Document
Comprehensive BCG analysis of Poly Developments' portfolio, identifying Stars, Cash Cows, Question Marks and Dogs with strategic recommendations.
Customizable Excel Spreadsheet
One-page BCG matrix for Poly Developments & Holdings — each business unit in a quadrant, clarity for fast strategic decisions.
Cash Cows
Property management fees
Poly's property management fees are a stable cash cow: a large installed base across Chinese cities delivers recurring revenue with low churn and predictable cash flows as of 2024. Operations are highly standardized and margins rise with scale and digital tools, improving operating margin headroom. Growth is modest, typically mid-single digits, but cash conversion remains strong, so prioritize heavy cash returns while investing selectively in efficiency.
Mature residential inventories
Mature residential inventories in established cities act as cash cows for Poly Developments, selling steadily at mid-market prices with minimal promotional pressure. Earlier-landbanking supports defensible gross margins and low incremental cost, so growth is limited but sales collections and modest maintenance capex generate strong free cash flow. Management should maintain sales pace, avoid discount wars, and harvest cash for deleveraging or strategic reinvestment.
Stabilized commercial rents
Leased-up retail and offices in core districts generate steady NOI, with portfolio performance holding through 2024 despite muted market growth. Capex remains maintenance-level and leasing is repeatable with an established tenant base. Occupancy and rents have proved resilient, allowing proceeds to fund next-wave growth or de-lever.
Parking and ancillary income
Parking, storage and small-format services across Poly Developments are sticky, high-margin cash cows requiring minimal marketing and driven by operational discipline; 2024 company disclosures highlight steady ancillary cash flows supporting liquidity. Growth is incremental but cumulative cash generation is material—centralize billing, squeeze efficiency and keep the drip steady to maximize ROI.
- Low-touch, high-margin recurring income
- Operational discipline > marketing
- Centralize billing; improve efficiency
Hotel/serviced apartments (core)
Hotel/serviced apartments (core) are central, stabilized assets where RevPAR has returned to near‑prepandemic levels in 2024 (STR reported China RevPAR recovery), costs are predictable and brand pull delivers steady occupancy; not hyper‑growth but reliable free cash flow and manageable rolling capex cycles. Maintain high operational standards and harvest the run‑rate.
- Stable RevPAR: 2024 recovery (STR)
- Predictable Opex, steady FCF
- Rolling capex, harvest strategy
Cash-harvest focus: 28% prop mgmt, 22% residential, steady NOI & RevPAR
Poly's cash cows—property management, mature residential sales, core retail/offices, parking and hotels—delivered stable cash conversion in 2024: property management margins ~28%, residential gross margin ~22%, core NOI growth ~3–4% YoY, RevPAR ~95% of 2019. Prioritize cash harvest, centralize billing and selective capex to fund deleveraging.
| Segment | 2024 Metric | Cash yield |
|---|---|---|
| Prop mgmt | Margin 28% | High |
| Residential | Gross 22% | High |
| Retail/Office | NNI +3–4% YoY | Moderate |
| Hotels | RevPAR 95% of 2019 | Moderate |
What You See Is What You Get
Poly Developments & Holdings Group BCG Matrix
The file you're previewing is the final Poly Developments & Holdings BCG Matrix you'll receive after purchase. No watermarks or demo content—just a polished, ready-to-use strategic report. It arrives immediately for download or email, fully editable and formatted to present to investors, boards, or your leadership team.
Description
Actionable Strategy Starts Here
Quick snapshot: Poly Developments & Holdings shows mixed momentum across segments—some assets behaving like Stars, others edging toward Cash Cows, and a couple that look like Question Marks you can’t ignore. This preview hints at allocation risks and growth levers; the full BCG Matrix gives quadrant-by-quadrant placements, hard data, and actionable moves to optimize cash flow and investment. Purchase the complete report for Word + Excel deliverables and a ready-to-use strategic roadmap you can implement this quarter.
Stars
Tier-1 mixed‑use flagships
Poly’s landmark mixed‑use flagships in Beijing, Shanghai and Shenzhen sit in fast‑growing urban cores with sustained high demand and lead their micro‑markets across retail, office and residential catchment. They generate strong cross‑segment footfall and brand spillovers but consume cash on leasing, activation and placemaking during rollout. With continued funding and operational focus, these assets are positioned to transition from investment drains into outsized cash generators.
GBA/YRD premium residential
High-end residential in the Greater Bay Area (population ~86 million) and Yangtze River Delta (~240 million) benefits from continued upgrade demand as China rebalanced consumption after 2023 GDP growth of 5.2%, supporting premium absorption in 2024.
Poly’s SOE backing and brand strength sustain pricing power and high sell-through versus peers, while aggressive marketing and land-premium loading compress near-term cash flow.
Maintaining share through cycles turns these star projects into durable cash cows as urbanization and rising incomes drive repeat upgrades.
Urban renewal PPPs
City-backed urban renewal PPPs unlock scarce core-district land with built-in demand; timelines commonly span 5–10 years, and Poly’s scale and government ties position it as a front-runner. Early phases absorb heavy cash for relocation, infrastructure and stakeholder work (often a material share of upfront spend). Once assets stabilize, the pipeline generates substantial, lower-risk operating cashflow.
Industrial/logistics parks
Industrial/logistics parks benefit from ongoing e-commerce and high-value manufacturing growth; in 2024 new parks in China’s growth corridors are leasing within 6–12 months while modern-node vacancy often sits below 8%, though initial capex per park can reach RMB 300–600 million.
Poly holds strong market share in selected nodes with scope to add logistics tech and 3PL services; invest now to secure leadership before demand growth moderates.
- Leasing velocity: 6–12 months (2024)
- Core-node vacancy: <8% (2024)
- Capex per park: RMB 300–600m
- Value-add: logistics tech, 3PL, cold-chain
Smart community services
Smart community services at Poly are scaling via embedded digital bundles for access, energy and amenities; industry reports show mid-single-digit to double-digit attach-rate uplift per handover in 2023–24, deepening lock-in and recurring revenue. Growth requires sustained product, tech and ops spend to reach delivery standards; if share holds, it converts to a low-churn profit engine.
- Embedded bundles: access, energy, amenities
- Attach-rate uplift: mid-single to double-digit (2023–24)
- Requires product/tech/ops investment
- Potential outcome: low-churn, high-margin recurring revenue
Urban flagships ~92% occupied; GBA/YRD luxury +6% YoY; logistics 8% vacancy, capex drain
Poly’s star mixed‑use flagships in Beijing/Shanghai/Shenzhen show ~92% occupancy and strong cross‑segment spillovers but need continued capex and leasing spend to stabilize cashflow. GBA/YRD high‑end residential absorption rose ~6% YoY (2024) supported by 2023 GDP rebound. Logistics nodes report ~8% vacancy and RMB300–600m capex per park; smart‑services lift attach rates mid‑single to double digits.
| Metric | 2024 |
|---|---|
| Urban flagship occupancy | 92% |
| GBA/YRD premium absorption | +6% YoY |
| Logistics vacancy | 8% |
| Capex per park | RMB300–600m |
What is included in the product
Detailed Word Document
Comprehensive BCG analysis of Poly Developments' portfolio, identifying Stars, Cash Cows, Question Marks and Dogs with strategic recommendations.
Customizable Excel Spreadsheet
One-page BCG matrix for Poly Developments & Holdings — each business unit in a quadrant, clarity for fast strategic decisions.
Cash Cows
Property management fees
Poly's property management fees are a stable cash cow: a large installed base across Chinese cities delivers recurring revenue with low churn and predictable cash flows as of 2024. Operations are highly standardized and margins rise with scale and digital tools, improving operating margin headroom. Growth is modest, typically mid-single digits, but cash conversion remains strong, so prioritize heavy cash returns while investing selectively in efficiency.
Mature residential inventories
Mature residential inventories in established cities act as cash cows for Poly Developments, selling steadily at mid-market prices with minimal promotional pressure. Earlier-landbanking supports defensible gross margins and low incremental cost, so growth is limited but sales collections and modest maintenance capex generate strong free cash flow. Management should maintain sales pace, avoid discount wars, and harvest cash for deleveraging or strategic reinvestment.
Stabilized commercial rents
Leased-up retail and offices in core districts generate steady NOI, with portfolio performance holding through 2024 despite muted market growth. Capex remains maintenance-level and leasing is repeatable with an established tenant base. Occupancy and rents have proved resilient, allowing proceeds to fund next-wave growth or de-lever.
Parking and ancillary income
Parking, storage and small-format services across Poly Developments are sticky, high-margin cash cows requiring minimal marketing and driven by operational discipline; 2024 company disclosures highlight steady ancillary cash flows supporting liquidity. Growth is incremental but cumulative cash generation is material—centralize billing, squeeze efficiency and keep the drip steady to maximize ROI.
- Low-touch, high-margin recurring income
- Operational discipline > marketing
- Centralize billing; improve efficiency
Hotel/serviced apartments (core)
Hotel/serviced apartments (core) are central, stabilized assets where RevPAR has returned to near‑prepandemic levels in 2024 (STR reported China RevPAR recovery), costs are predictable and brand pull delivers steady occupancy; not hyper‑growth but reliable free cash flow and manageable rolling capex cycles. Maintain high operational standards and harvest the run‑rate.
- Stable RevPAR: 2024 recovery (STR)
- Predictable Opex, steady FCF
- Rolling capex, harvest strategy
Cash-harvest focus: 28% prop mgmt, 22% residential, steady NOI & RevPAR
Poly's cash cows—property management, mature residential sales, core retail/offices, parking and hotels—delivered stable cash conversion in 2024: property management margins ~28%, residential gross margin ~22%, core NOI growth ~3–4% YoY, RevPAR ~95% of 2019. Prioritize cash harvest, centralize billing and selective capex to fund deleveraging.
| Segment | 2024 Metric | Cash yield |
|---|---|---|
| Prop mgmt | Margin 28% | High |
| Residential | Gross 22% | High |
| Retail/Office | NNI +3–4% YoY | Moderate |
| Hotels | RevPAR 95% of 2019 | Moderate |
What You See Is What You Get
Poly Developments & Holdings Group BCG Matrix
The file you're previewing is the final Poly Developments & Holdings BCG Matrix you'll receive after purchase. No watermarks or demo content—just a polished, ready-to-use strategic report. It arrives immediately for download or email, fully editable and formatted to present to investors, boards, or your leadership team.











