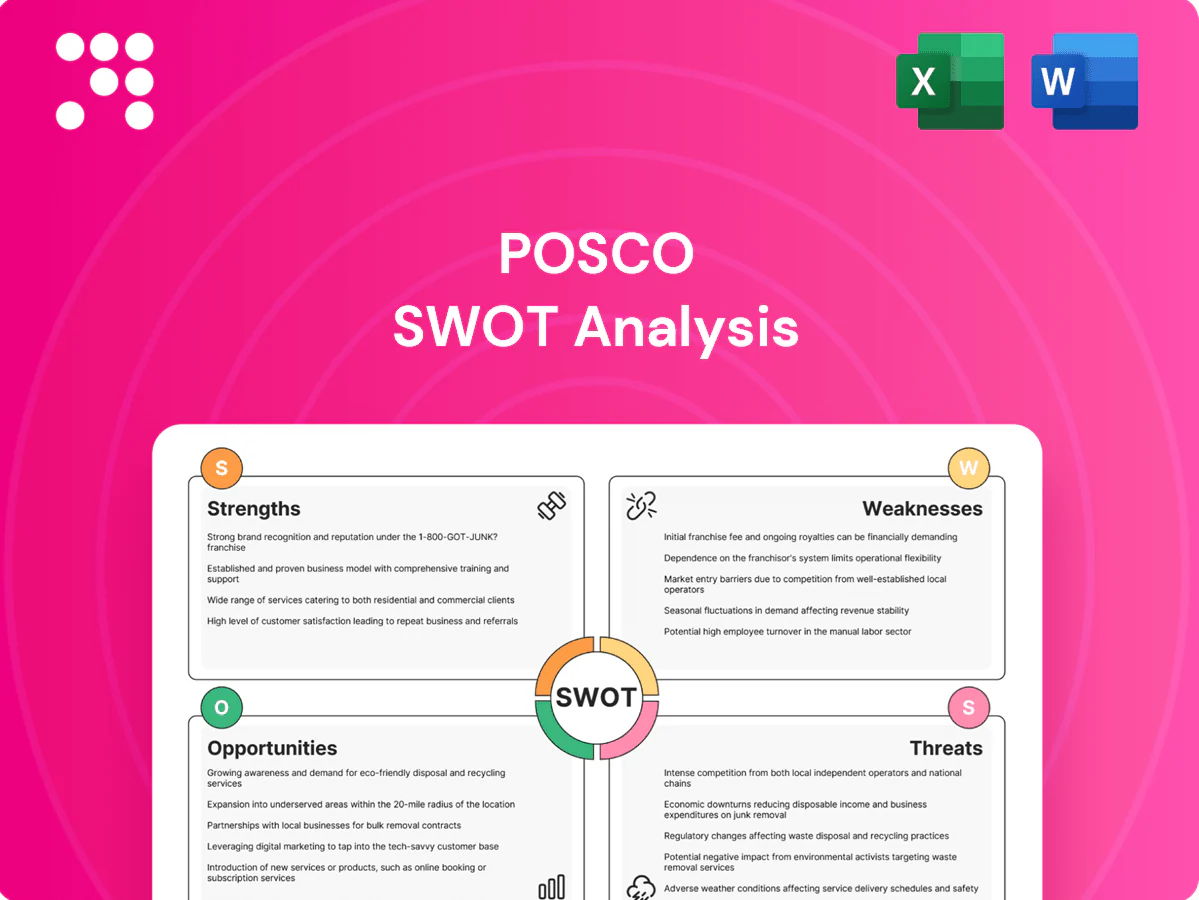
Posco SWOT Analysis

Elevate Your Analysis with the Complete SWOT Report
POSCO’s robust integrated steel platform, global footprint, and vertical integration underpin strong margins, while cyclical demand, raw material volatility, and decarbonization costs pose clear risks; growth hinges on downstream diversification and green steel initiatives. Want the full strategic picture? Purchase the complete SWOT for a research-backed Word report and editable Excel matrix to plan and pitch with confidence.
Strengths

Global scale and cost leadership
POSCO operates large, efficient integrated mills that drive low unit costs and reliable throughput.
As a top-5 global steelmaker, its scale secures procurement power for iron ore and coking coal and leverage in shipping and logistics.
That scale underpins competitive pricing across hot-rolled, cold-rolled, plate and stainless products and buffers margins in downcycles versus smaller rivals.
Diversified portfolio beyond steel
POSCO's holdings span steel, POSCO E&C (construction), POSCO Energy, and materials units (POSCO Chemical, POSCO Future M), producing consolidated revenue of about KRW 74 trillion in 2024; this mix reduces reliance on any single profit pool, smooths cash flow through adjacent businesses and cross-selling to industrial customers, and lets materials/energy units supply the core steel business to capture upstream value and bolster resilience across cycles.

Strong OEM and industrial relationships
Deep ties with Hyundai Motor Group and leading shipyards anchor long-term demand and secure repeat contracts across automotive, shipbuilding and construction.
Co-development of advanced grades like AHSS and high-strength ship plate embeds POSCO in customers’ product roadmaps, improving product mix and pricing power versus commodity-only producers.
This relationship raises switching costs, supports higher margins, and drives steady aftermarket and multi-year supply agreements.

Technology and process excellence
Continuous R&D and process innovation at POSCO measurably improve yield, quality and energy efficiency, while deep expertise in specialty steels and advanced surface treatments secures higher-value automotive and electronics applications; digitalization and automation raise productivity and cut downtime, giving POSCO a technology edge in stringent end markets.
- R&D-driven yield & energy gains
- Specialty steels for premium markets
- Digitalization reduces downtime
- Technology depth = market differentiation
Advancing low-carbon trajectory
POSCO's investments in energy efficiency, recycling and hydrogen-based pathways position it to meet rising green-steel demand; the company has committed to net-zero emissions by 2050. Early deployment can capture green premiums and satisfy OEM sustainability mandates. Progress on emissions intensity reduces exposure to carbon pricing and strengthens ESG credentials with investors and lenders.
- Energy efficiency, recycling, hydrogen focus
- Net-zero by 2050 commitment
- Captures green premiums and OEM demand
- Mitigates carbon-pricing risk; boosts ESG access to capital
Top-5 global steelmaker: KRW 74 trillion revenue (2024), net-zero by 2050
POSCO runs large, efficient integrated mills that drive low unit costs and reliable throughput; scale secures procurement leverage and shipping efficiencies. As a top-5 global steelmaker, it delivered about KRW 74 trillion revenue in 2024 and supplies advanced grades (AHSS, high-strength plate) to automotive and shipbuilding partners, raising switching costs and margins. Ongoing R&D, digitalization and a net-zero-by-2050 pledge strengthen green credentials and product differentiation.
| Metric | Value |
|---|---|
| Revenue (2024) | KRW 74 trillion |
| Global rank | Top-5 steelmaker |
| Net-zero target | 2050 |
What is included in the product
 Detailed Word Document
Provides a clear SWOT framework analyzing Posco’s strengths, weaknesses, opportunities, and threats, highlighting its operational capabilities, growth drivers in steel and green initiatives, and market and regulatory risks shaping its strategic position.

 Customizable Excel Spreadsheet
Provides a concise Posco SWOT matrix for fast, visual strategy alignment across steel operations and supply-chain risk mitigation.
Weaknesses

Cyclical earnings volatility
POSCOs earnings are highly cyclical—around 75% of sales come from steel, so HRC price swings and demand shifts in autos, construction and shipbuilding directly move revenue and margins; steel spreads plunged in 2023–24, pushing operating margins from double digits into low single digits and fixed-cost intensity magnifies downside, complicating 2024–25 planning and investor visibility.
High capex and capital intensity
High capex for blast furnaces, plate mills and decarbonization upgrades drives ongoing spend — annual investments ran around 5 trillion KRW in 2024 (≈$3.8bn), exposing POSCO to execution and payback risk on large projects if steel prices or demand shift. Elevated reinvestment needs can squeeze free cash flow in weak cycles, so strict balance sheet discipline and liquidity management are critical to avoid financial strain.

Carbon footprint and compliance risk
Integrated blast-furnace steelmaking emits roughly 1.8–2.0 tCO2 per tonne of steel, exposing POSCO to tightening regulation and rising carbon costs as EU ETS prices averaged about €85/t in 2024. Emerging schemes like CBAM (phased to apply fully from 2026) increase compliance and potential border-tax exposure on exports. Transition options—green hydrogen and CCUS—costly at ~€3–5/kg H2 and high CAPEX, remain unscaled. Failure to decarbonize risks losing competitiveness in carbon-sensitive export markets.

Commodity input exposure
Earnings remain highly sensitive to iron ore, coking coal and energy price swings; seaborne iron ore is dominated by Vale, Rio Tinto and BHP (roughly 70% market share), so supplier concentration and freight or supply shocks can sharply squeeze POSCO margins despite scale. Hedging reduces headline volatility but cannot remove basis and timing risks, leaving profits exposed to sudden commodity or freight disruptions.
- Commodity dependency: iron ore/coking coal/energy
- Supplier concentration: top miners ~70% seaborne share
- Hedging limits: basis & timing risk
- Freight/supply shocks can quickly compress margins
Product mix pressure
Commodity flat products face intense price competition from China, which produced about 1.02 billion tonnes of crude steel in 2024, pressuring ASPs; a lower share of premium, differentiated grades compresses POSCOs margins. Upgrading the mix needs sustained R&D and customer co‑qualification cycles typically lasting 2–4 years, while capacity transitions are time‑consuming and often require capex in the hundreds of millions to low billions of USD.
- China steel output 2024 ~1.02bn t
- Premium grades often +10–30% ASP
- R&D/co‑qualification 2–4 years
- Transition capex: hundreds of M to low B USD
Steel-centric firm: margin squeeze, heavy capex and rising carbon costs threaten exports
High cyclicality: ~75% revenue from steel makes POSCO vulnerable to HRC price swings; margins fell to low single digits in 2023–24. Heavy capex (≈5 trillion KRW in 2024, ≈$3.8bn) and blast‑furnace footprint raise execution and cash‑flow risk. Carbon intensity (~1.8–2.0 tCO2/t) plus EU ETS (~€85/t in 2024) and CBAM threaten export competitiveness.
| Metric | Value |
|---|---|
| Steel share of sales | ~75% |
| 2024 capex | ≈5 T KRW (~$3.8bn) |
| CO2 intensity | 1.8–2.0 tCO2/t |
| EU ETS 2024 | ≈€85/t |
| China crude steel 2024 | ~1.02bn t |
What You See Is What You Get
Posco SWOT Analysis
This is the actual SWOT analysis document for Posco you’ll receive upon purchase—no surprises, just professional quality. The preview below is taken directly from the full SWOT report and reflects strengths, weaknesses, opportunities, and threats in concise, actionable form. Once purchased, the complete, editable version is available immediately.

Elevate Your Analysis with the Complete SWOT Report
POSCO’s robust integrated steel platform, global footprint, and vertical integration underpin strong margins, while cyclical demand, raw material volatility, and decarbonization costs pose clear risks; growth hinges on downstream diversification and green steel initiatives. Want the full strategic picture? Purchase the complete SWOT for a research-backed Word report and editable Excel matrix to plan and pitch with confidence.
Strengths
Global scale and cost leadership
POSCO operates large, efficient integrated mills that drive low unit costs and reliable throughput.
As a top-5 global steelmaker, its scale secures procurement power for iron ore and coking coal and leverage in shipping and logistics.
That scale underpins competitive pricing across hot-rolled, cold-rolled, plate and stainless products and buffers margins in downcycles versus smaller rivals.
Diversified portfolio beyond steel
POSCO's holdings span steel, POSCO E&C (construction), POSCO Energy, and materials units (POSCO Chemical, POSCO Future M), producing consolidated revenue of about KRW 74 trillion in 2024; this mix reduces reliance on any single profit pool, smooths cash flow through adjacent businesses and cross-selling to industrial customers, and lets materials/energy units supply the core steel business to capture upstream value and bolster resilience across cycles.
Strong OEM and industrial relationships
Deep ties with Hyundai Motor Group and leading shipyards anchor long-term demand and secure repeat contracts across automotive, shipbuilding and construction.
Co-development of advanced grades like AHSS and high-strength ship plate embeds POSCO in customers’ product roadmaps, improving product mix and pricing power versus commodity-only producers.
This relationship raises switching costs, supports higher margins, and drives steady aftermarket and multi-year supply agreements.
Technology and process excellence
Continuous R&D and process innovation at POSCO measurably improve yield, quality and energy efficiency, while deep expertise in specialty steels and advanced surface treatments secures higher-value automotive and electronics applications; digitalization and automation raise productivity and cut downtime, giving POSCO a technology edge in stringent end markets.
- R&D-driven yield & energy gains
- Specialty steels for premium markets
- Digitalization reduces downtime
- Technology depth = market differentiation
Advancing low-carbon trajectory
POSCO's investments in energy efficiency, recycling and hydrogen-based pathways position it to meet rising green-steel demand; the company has committed to net-zero emissions by 2050. Early deployment can capture green premiums and satisfy OEM sustainability mandates. Progress on emissions intensity reduces exposure to carbon pricing and strengthens ESG credentials with investors and lenders.
- Energy efficiency, recycling, hydrogen focus
- Net-zero by 2050 commitment
- Captures green premiums and OEM demand
- Mitigates carbon-pricing risk; boosts ESG access to capital
Top-5 global steelmaker: KRW 74 trillion revenue (2024), net-zero by 2050
POSCO runs large, efficient integrated mills that drive low unit costs and reliable throughput; scale secures procurement leverage and shipping efficiencies. As a top-5 global steelmaker, it delivered about KRW 74 trillion revenue in 2024 and supplies advanced grades (AHSS, high-strength plate) to automotive and shipbuilding partners, raising switching costs and margins. Ongoing R&D, digitalization and a net-zero-by-2050 pledge strengthen green credentials and product differentiation.
| Metric | Value |
|---|---|
| Revenue (2024) | KRW 74 trillion |
| Global rank | Top-5 steelmaker |
| Net-zero target | 2050 |
What is included in the product
Detailed Word Document
Provides a clear SWOT framework analyzing Posco’s strengths, weaknesses, opportunities, and threats, highlighting its operational capabilities, growth drivers in steel and green initiatives, and market and regulatory risks shaping its strategic position.
Customizable Excel Spreadsheet
Provides a concise Posco SWOT matrix for fast, visual strategy alignment across steel operations and supply-chain risk mitigation.
Weaknesses
Cyclical earnings volatility
POSCOs earnings are highly cyclical—around 75% of sales come from steel, so HRC price swings and demand shifts in autos, construction and shipbuilding directly move revenue and margins; steel spreads plunged in 2023–24, pushing operating margins from double digits into low single digits and fixed-cost intensity magnifies downside, complicating 2024–25 planning and investor visibility.
High capex and capital intensity
High capex for blast furnaces, plate mills and decarbonization upgrades drives ongoing spend — annual investments ran around 5 trillion KRW in 2024 (≈$3.8bn), exposing POSCO to execution and payback risk on large projects if steel prices or demand shift. Elevated reinvestment needs can squeeze free cash flow in weak cycles, so strict balance sheet discipline and liquidity management are critical to avoid financial strain.
Carbon footprint and compliance risk
Integrated blast-furnace steelmaking emits roughly 1.8–2.0 tCO2 per tonne of steel, exposing POSCO to tightening regulation and rising carbon costs as EU ETS prices averaged about €85/t in 2024. Emerging schemes like CBAM (phased to apply fully from 2026) increase compliance and potential border-tax exposure on exports. Transition options—green hydrogen and CCUS—costly at ~€3–5/kg H2 and high CAPEX, remain unscaled. Failure to decarbonize risks losing competitiveness in carbon-sensitive export markets.
Commodity input exposure
Earnings remain highly sensitive to iron ore, coking coal and energy price swings; seaborne iron ore is dominated by Vale, Rio Tinto and BHP (roughly 70% market share), so supplier concentration and freight or supply shocks can sharply squeeze POSCO margins despite scale. Hedging reduces headline volatility but cannot remove basis and timing risks, leaving profits exposed to sudden commodity or freight disruptions.
- Commodity dependency: iron ore/coking coal/energy
- Supplier concentration: top miners ~70% seaborne share
- Hedging limits: basis & timing risk
- Freight/supply shocks can quickly compress margins
Product mix pressure
Commodity flat products face intense price competition from China, which produced about 1.02 billion tonnes of crude steel in 2024, pressuring ASPs; a lower share of premium, differentiated grades compresses POSCOs margins. Upgrading the mix needs sustained R&D and customer co‑qualification cycles typically lasting 2–4 years, while capacity transitions are time‑consuming and often require capex in the hundreds of millions to low billions of USD.
- China steel output 2024 ~1.02bn t
- Premium grades often +10–30% ASP
- R&D/co‑qualification 2–4 years
- Transition capex: hundreds of M to low B USD
Steel-centric firm: margin squeeze, heavy capex and rising carbon costs threaten exports
High cyclicality: ~75% revenue from steel makes POSCO vulnerable to HRC price swings; margins fell to low single digits in 2023–24. Heavy capex (≈5 trillion KRW in 2024, ≈$3.8bn) and blast‑furnace footprint raise execution and cash‑flow risk. Carbon intensity (~1.8–2.0 tCO2/t) plus EU ETS (~€85/t in 2024) and CBAM threaten export competitiveness.
| Metric | Value |
|---|---|
| Steel share of sales | ~75% |
| 2024 capex | ≈5 T KRW (~$3.8bn) |
| CO2 intensity | 1.8–2.0 tCO2/t |
| EU ETS 2024 | ≈€85/t |
| China crude steel 2024 | ~1.02bn t |
What You See Is What You Get
Posco SWOT Analysis
This is the actual SWOT analysis document for Posco you’ll receive upon purchase—no surprises, just professional quality. The preview below is taken directly from the full SWOT report and reflects strengths, weaknesses, opportunities, and threats in concise, actionable form. Once purchased, the complete, editable version is available immediately.
Original: $10.00
-65%$10.00
$3.50Description
Elevate Your Analysis with the Complete SWOT Report
POSCO’s robust integrated steel platform, global footprint, and vertical integration underpin strong margins, while cyclical demand, raw material volatility, and decarbonization costs pose clear risks; growth hinges on downstream diversification and green steel initiatives. Want the full strategic picture? Purchase the complete SWOT for a research-backed Word report and editable Excel matrix to plan and pitch with confidence.
Strengths
Global scale and cost leadership
POSCO operates large, efficient integrated mills that drive low unit costs and reliable throughput.
As a top-5 global steelmaker, its scale secures procurement power for iron ore and coking coal and leverage in shipping and logistics.
That scale underpins competitive pricing across hot-rolled, cold-rolled, plate and stainless products and buffers margins in downcycles versus smaller rivals.
Diversified portfolio beyond steel
POSCO's holdings span steel, POSCO E&C (construction), POSCO Energy, and materials units (POSCO Chemical, POSCO Future M), producing consolidated revenue of about KRW 74 trillion in 2024; this mix reduces reliance on any single profit pool, smooths cash flow through adjacent businesses and cross-selling to industrial customers, and lets materials/energy units supply the core steel business to capture upstream value and bolster resilience across cycles.
Strong OEM and industrial relationships
Deep ties with Hyundai Motor Group and leading shipyards anchor long-term demand and secure repeat contracts across automotive, shipbuilding and construction.
Co-development of advanced grades like AHSS and high-strength ship plate embeds POSCO in customers’ product roadmaps, improving product mix and pricing power versus commodity-only producers.
This relationship raises switching costs, supports higher margins, and drives steady aftermarket and multi-year supply agreements.
Technology and process excellence
Continuous R&D and process innovation at POSCO measurably improve yield, quality and energy efficiency, while deep expertise in specialty steels and advanced surface treatments secures higher-value automotive and electronics applications; digitalization and automation raise productivity and cut downtime, giving POSCO a technology edge in stringent end markets.
- R&D-driven yield & energy gains
- Specialty steels for premium markets
- Digitalization reduces downtime
- Technology depth = market differentiation
Advancing low-carbon trajectory
POSCO's investments in energy efficiency, recycling and hydrogen-based pathways position it to meet rising green-steel demand; the company has committed to net-zero emissions by 2050. Early deployment can capture green premiums and satisfy OEM sustainability mandates. Progress on emissions intensity reduces exposure to carbon pricing and strengthens ESG credentials with investors and lenders.
- Energy efficiency, recycling, hydrogen focus
- Net-zero by 2050 commitment
- Captures green premiums and OEM demand
- Mitigates carbon-pricing risk; boosts ESG access to capital
Top-5 global steelmaker: KRW 74 trillion revenue (2024), net-zero by 2050
POSCO runs large, efficient integrated mills that drive low unit costs and reliable throughput; scale secures procurement leverage and shipping efficiencies. As a top-5 global steelmaker, it delivered about KRW 74 trillion revenue in 2024 and supplies advanced grades (AHSS, high-strength plate) to automotive and shipbuilding partners, raising switching costs and margins. Ongoing R&D, digitalization and a net-zero-by-2050 pledge strengthen green credentials and product differentiation.
| Metric | Value |
|---|---|
| Revenue (2024) | KRW 74 trillion |
| Global rank | Top-5 steelmaker |
| Net-zero target | 2050 |
What is included in the product
Detailed Word Document
Provides a clear SWOT framework analyzing Posco’s strengths, weaknesses, opportunities, and threats, highlighting its operational capabilities, growth drivers in steel and green initiatives, and market and regulatory risks shaping its strategic position.
Customizable Excel Spreadsheet
Provides a concise Posco SWOT matrix for fast, visual strategy alignment across steel operations and supply-chain risk mitigation.
Weaknesses
Cyclical earnings volatility
POSCOs earnings are highly cyclical—around 75% of sales come from steel, so HRC price swings and demand shifts in autos, construction and shipbuilding directly move revenue and margins; steel spreads plunged in 2023–24, pushing operating margins from double digits into low single digits and fixed-cost intensity magnifies downside, complicating 2024–25 planning and investor visibility.
High capex and capital intensity
High capex for blast furnaces, plate mills and decarbonization upgrades drives ongoing spend — annual investments ran around 5 trillion KRW in 2024 (≈$3.8bn), exposing POSCO to execution and payback risk on large projects if steel prices or demand shift. Elevated reinvestment needs can squeeze free cash flow in weak cycles, so strict balance sheet discipline and liquidity management are critical to avoid financial strain.
Carbon footprint and compliance risk
Integrated blast-furnace steelmaking emits roughly 1.8–2.0 tCO2 per tonne of steel, exposing POSCO to tightening regulation and rising carbon costs as EU ETS prices averaged about €85/t in 2024. Emerging schemes like CBAM (phased to apply fully from 2026) increase compliance and potential border-tax exposure on exports. Transition options—green hydrogen and CCUS—costly at ~€3–5/kg H2 and high CAPEX, remain unscaled. Failure to decarbonize risks losing competitiveness in carbon-sensitive export markets.
Commodity input exposure
Earnings remain highly sensitive to iron ore, coking coal and energy price swings; seaborne iron ore is dominated by Vale, Rio Tinto and BHP (roughly 70% market share), so supplier concentration and freight or supply shocks can sharply squeeze POSCO margins despite scale. Hedging reduces headline volatility but cannot remove basis and timing risks, leaving profits exposed to sudden commodity or freight disruptions.
- Commodity dependency: iron ore/coking coal/energy
- Supplier concentration: top miners ~70% seaborne share
- Hedging limits: basis & timing risk
- Freight/supply shocks can quickly compress margins
Product mix pressure
Commodity flat products face intense price competition from China, which produced about 1.02 billion tonnes of crude steel in 2024, pressuring ASPs; a lower share of premium, differentiated grades compresses POSCOs margins. Upgrading the mix needs sustained R&D and customer co‑qualification cycles typically lasting 2–4 years, while capacity transitions are time‑consuming and often require capex in the hundreds of millions to low billions of USD.
- China steel output 2024 ~1.02bn t
- Premium grades often +10–30% ASP
- R&D/co‑qualification 2–4 years
- Transition capex: hundreds of M to low B USD
Steel-centric firm: margin squeeze, heavy capex and rising carbon costs threaten exports
High cyclicality: ~75% revenue from steel makes POSCO vulnerable to HRC price swings; margins fell to low single digits in 2023–24. Heavy capex (≈5 trillion KRW in 2024, ≈$3.8bn) and blast‑furnace footprint raise execution and cash‑flow risk. Carbon intensity (~1.8–2.0 tCO2/t) plus EU ETS (~€85/t in 2024) and CBAM threaten export competitiveness.
| Metric | Value |
|---|---|
| Steel share of sales | ~75% |
| 2024 capex | ≈5 T KRW (~$3.8bn) |
| CO2 intensity | 1.8–2.0 tCO2/t |
| EU ETS 2024 | ≈€85/t |
| China crude steel 2024 | ~1.02bn t |
What You See Is What You Get
Posco SWOT Analysis
This is the actual SWOT analysis document for Posco you’ll receive upon purchase—no surprises, just professional quality. The preview below is taken directly from the full SWOT report and reflects strengths, weaknesses, opportunities, and threats in concise, actionable form. Once purchased, the complete, editable version is available immediately.











