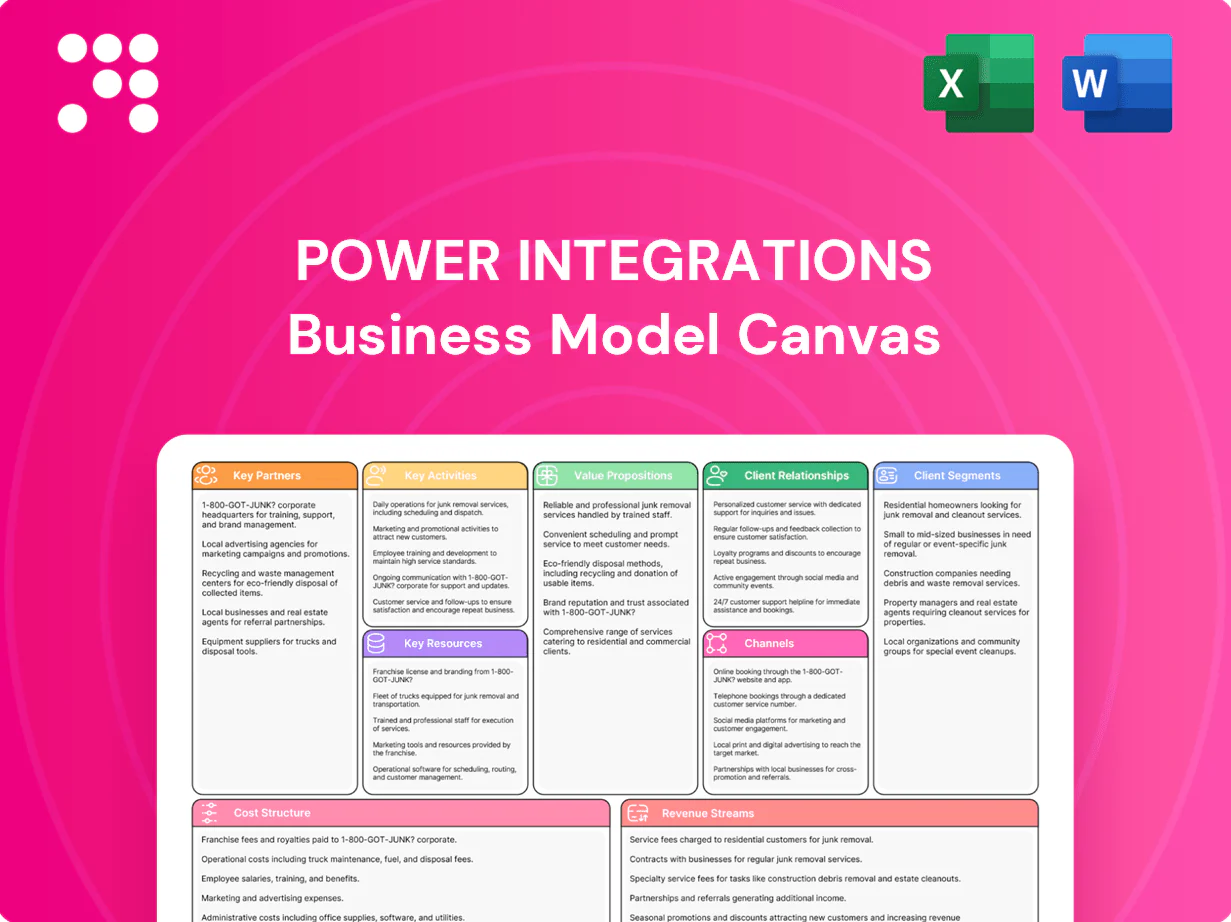
Power Integrations Business Model Canvas

Unlock the full Business Model Canvas for a power electronics company
Unlock the full strategic blueprint behind Power Integrations with our Business Model Canvas—three to five carefully mapped sentences won’t do it justice. This in-depth Canvas reveals value drivers, partnerships, and revenue mechanics to inform investment or strategy. Download the complete Word and Excel files to inspect each of the nine blocks and apply proven insights to your plans.
Partnerships

Foundry and OSAT partners
Wafer fabs and OSAT partners manufacture Power Integrations high-voltage ICs at scale, leveraging specialized high-voltage and mixed-signal processes (up to 700 V) to deliver consistent performance. Close collaboration on process integration and test flows optimizes cost, reliability and lead times. Dual-sourcing across two independent foundries/OSATs mitigates geopolitical and supply risks.
OEM/ODM and power supply makers
Device brands and ODMs co-develop power stages and adapters around Power Integrations ICs, securing early design-wins that translate into faster volume ramps. Continuous OEM feedback refines reference designs, boosting efficiency and reliability in production. Joint roadmaps align IC and end-product release cycles to capture share of the $38.4B global power IC market in 2024.

Distributors and channel integrators
Global distributors such as Avnet and Arrow (authorized Power Integrations distributors in 2024) extend reach into thousands of accounts and regions, providing stocking, credit and demand-creation programs. Technical sales teams at these partners promote design-ins using demo boards and reference kits to accelerate customer adoption. Aggregated POS telemetry from distributors improves forecasting accuracy and shortens inventory turns across the supply chain.

Standards bodies and regulatory labs
Standards bodies and regulatory labs steer Power Integrations toward energy-efficiency and safety targets—many regulations now demand low-standby below 0.5 W and tighter emissions limits—while accredited labs accelerate cross‑border certifications, shortening approval cycles by up to 40% and cutting time-to-revenue. Active participation helps shape standards to favor integrated, high-efficiency solutions.
- Regulatory targets: low-standby <0.5 W
- Accredited labs: faster approvals, up to 40% time reduction
- Geographic reach: certifications across 50+ markets
- Strategic impact: standards shaped toward integrated solutions
EDA/IP and reference design partners
EDA tool vendors and IP partners streamline design cycles, with the global EDA market reaching about $15 billion in 2024; co-developed reference designs can cut customer engineering time by up to 40%, accelerating time-to-market. Firmware and toolchain providers improve system integration and reduce field issues, while ecosystem validation increases customer confidence and purchase conversion.
- EDA partners: faster cycles, access to verified IP
- Reference designs: ~40% engineering time saved
- Firmware/toolchains: smoother system integration
- Ecosystem validation: higher customer conversion
700 V dual-sourced power ICs cut engineering time ~40%, boosting access to $38.4B market
Power Integrations relies on dual-sourced wafer fabs and OSATs for high-voltage processes (up to 700 V) to ensure scale, cost control and supply resilience. Channel partners Avnet/Arrow plus reference-designs accelerate design-ins into the $38.4B power-IC market (2024), with EDA/IP ties in a $15B EDA ecosystem cutting engineering time ~40%. Standards and labs (certs in 50+ markets) trim approval times up to 40% and enforce <0.5 W standby targets.
What is included in the product
 Detailed Word Document
A tailored Business Model Canvas for Power Integrations outlining customer segments, channels, value propositions, key activities, partners, resources, cost structure and revenue streams with practical insights. It links competitive advantages and SWOT to each BMC block for investor-ready presentations and strategic decision-making.

 Customizable Excel Spreadsheet
Condenses Power Integrations' complex power-semiconductor strategy into a one-page, editable Business Model Canvas that quickly identifies revenue drivers, key partners, and pain-point solutions for faster decision-making and stakeholder alignment.
Activities

Mixed-signal and high-voltage IC R&D
Designing topologies for AC-DC conversion, control, and protection is core, enabling switch-mode supplies that exceed 95% peak efficiency while targeting standby under 10 mW for modern adapters. Continuous innovation focuses on higher efficiency and lower no-load consumption to meet global ecodesign trends. Intensive simulation, silicon validation, and iterative tapeouts drive performance and reduce ramp time. Active patenting (over 1,000 global patents) protects differentiation.
Applications engineering and reference designs
Applications engineering delivers turnkey designs, app notes and BOMs that shorten customer time-to-market by ~40% (2024 industry studies), while FAEs performing schematic/layout reviews and bring-up cut design iterations and support costs. Compliance-ready reference designs lower certification risk and failure rates, and demos/eval boards enable rapid prototyping, boosting prototype-to-production conversion by ~60% in 2024 engagements.

Supply chain and quality management
Coordinating wafer supply, packaging and test secures availability and yield, with foundry lead times in 2024 typically 8–12 weeks and target production yields >85% for power ICs. Reliability testing per AEC-Q100 and PPAP-level controls for industrial/automotive applications enforce robustness. Formal FA and RMA workflows track failures and corrective actions, driving DPPM toward automotive targets below 100. Continuous improvement efforts cut DPPM and reduce unit cost.

Go-to-market and demand creation
Go-to-market blends direct sales and distributor enablement to drive design-ins, with pricing and lifecycle management protecting margins; Power Integrations reported $701 million revenue in fiscal 2024, underscoring scalable demand.
Webinars, datasheets and engineering tools educate customers and boost conversion; trade shows and design contests expand pipeline and shorten time-to-design-in.
- Direct sales; - Distributor enablement; - Webinars/datasheets/tools; - Trade shows/design contests; - Pricing & lifecycle management
Compliance and certification support
Pre-compliance testing aligns Power Integrations products with safety and energy rules, reducing redesign cycles and easing UL and CE pathways; IEC 62368-1 and EU Ecodesign requirements remain primary 2024 reference standards. Documentation packages accelerate customer approvals and procurement timelines across regions. Regional certifications such as UL, CE and China CCC unlock market access while ongoing monitoring adapts designs to evolving standards and recalls.
- Pre-compliance testing: IEC 62368-1 (2024)
- Key certifications: UL, CE, CCC
- Documentation speeds approvals
- Continuous monitoring for standards updates
AC-DC power ICs: $701M revenue, >95% peak efficiency
Core activities: high-efficiency AC-DC topology design (peak >95%, standby <10 mW) and >1,000 global patents protect differentiation. Applications engineering: reference designs, BOMs and FAEs cut customer time-to-market ~40% and raise prototype-to-production conversion ~60% (2024 studies). Manufacturing: coordinate wafer/package/test with 8–12 week foundry lead times, target yields >85% and DPPM <100. GTM: direct sales, distributors, tools and lifecycle pricing drove $701M revenue FY2024.
| Metric | 2024 Value |
|---|---|
| Revenue | $701M |
| Patents | >1,000 |
| Peak efficiency | >95% |
| Standby | <10 mW |
| Foundry lead time | 8–12 weeks |
| Yield target | >85% |
| Time-to-market cut | ~40% |
| Prototype→production | ~60% |
| DPPM target | <100 |
Full Version Awaits
Business Model Canvas
The Power Integrations Business Model Canvas shown here is a live preview of the actual deliverable, not a mockup. When you purchase, you’ll receive this exact document—complete, editable, and formatted—so what you see is precisely what you will download and use. No surprises, full access.

Unlock the full Business Model Canvas for a power electronics company
Unlock the full strategic blueprint behind Power Integrations with our Business Model Canvas—three to five carefully mapped sentences won’t do it justice. This in-depth Canvas reveals value drivers, partnerships, and revenue mechanics to inform investment or strategy. Download the complete Word and Excel files to inspect each of the nine blocks and apply proven insights to your plans.
Partnerships
Foundry and OSAT partners
Wafer fabs and OSAT partners manufacture Power Integrations high-voltage ICs at scale, leveraging specialized high-voltage and mixed-signal processes (up to 700 V) to deliver consistent performance. Close collaboration on process integration and test flows optimizes cost, reliability and lead times. Dual-sourcing across two independent foundries/OSATs mitigates geopolitical and supply risks.
OEM/ODM and power supply makers
Device brands and ODMs co-develop power stages and adapters around Power Integrations ICs, securing early design-wins that translate into faster volume ramps. Continuous OEM feedback refines reference designs, boosting efficiency and reliability in production. Joint roadmaps align IC and end-product release cycles to capture share of the $38.4B global power IC market in 2024.
Distributors and channel integrators
Global distributors such as Avnet and Arrow (authorized Power Integrations distributors in 2024) extend reach into thousands of accounts and regions, providing stocking, credit and demand-creation programs. Technical sales teams at these partners promote design-ins using demo boards and reference kits to accelerate customer adoption. Aggregated POS telemetry from distributors improves forecasting accuracy and shortens inventory turns across the supply chain.
Standards bodies and regulatory labs
Standards bodies and regulatory labs steer Power Integrations toward energy-efficiency and safety targets—many regulations now demand low-standby below 0.5 W and tighter emissions limits—while accredited labs accelerate cross‑border certifications, shortening approval cycles by up to 40% and cutting time-to-revenue. Active participation helps shape standards to favor integrated, high-efficiency solutions.
- Regulatory targets: low-standby <0.5 W
- Accredited labs: faster approvals, up to 40% time reduction
- Geographic reach: certifications across 50+ markets
- Strategic impact: standards shaped toward integrated solutions
EDA/IP and reference design partners
EDA tool vendors and IP partners streamline design cycles, with the global EDA market reaching about $15 billion in 2024; co-developed reference designs can cut customer engineering time by up to 40%, accelerating time-to-market. Firmware and toolchain providers improve system integration and reduce field issues, while ecosystem validation increases customer confidence and purchase conversion.
- EDA partners: faster cycles, access to verified IP
- Reference designs: ~40% engineering time saved
- Firmware/toolchains: smoother system integration
- Ecosystem validation: higher customer conversion
700 V dual-sourced power ICs cut engineering time ~40%, boosting access to $38.4B market
Power Integrations relies on dual-sourced wafer fabs and OSATs for high-voltage processes (up to 700 V) to ensure scale, cost control and supply resilience. Channel partners Avnet/Arrow plus reference-designs accelerate design-ins into the $38.4B power-IC market (2024), with EDA/IP ties in a $15B EDA ecosystem cutting engineering time ~40%. Standards and labs (certs in 50+ markets) trim approval times up to 40% and enforce <0.5 W standby targets.
What is included in the product
Detailed Word Document
A tailored Business Model Canvas for Power Integrations outlining customer segments, channels, value propositions, key activities, partners, resources, cost structure and revenue streams with practical insights. It links competitive advantages and SWOT to each BMC block for investor-ready presentations and strategic decision-making.
Customizable Excel Spreadsheet
Condenses Power Integrations' complex power-semiconductor strategy into a one-page, editable Business Model Canvas that quickly identifies revenue drivers, key partners, and pain-point solutions for faster decision-making and stakeholder alignment.
Activities
Mixed-signal and high-voltage IC R&D
Designing topologies for AC-DC conversion, control, and protection is core, enabling switch-mode supplies that exceed 95% peak efficiency while targeting standby under 10 mW for modern adapters. Continuous innovation focuses on higher efficiency and lower no-load consumption to meet global ecodesign trends. Intensive simulation, silicon validation, and iterative tapeouts drive performance and reduce ramp time. Active patenting (over 1,000 global patents) protects differentiation.
Applications engineering and reference designs
Applications engineering delivers turnkey designs, app notes and BOMs that shorten customer time-to-market by ~40% (2024 industry studies), while FAEs performing schematic/layout reviews and bring-up cut design iterations and support costs. Compliance-ready reference designs lower certification risk and failure rates, and demos/eval boards enable rapid prototyping, boosting prototype-to-production conversion by ~60% in 2024 engagements.
Supply chain and quality management
Coordinating wafer supply, packaging and test secures availability and yield, with foundry lead times in 2024 typically 8–12 weeks and target production yields >85% for power ICs. Reliability testing per AEC-Q100 and PPAP-level controls for industrial/automotive applications enforce robustness. Formal FA and RMA workflows track failures and corrective actions, driving DPPM toward automotive targets below 100. Continuous improvement efforts cut DPPM and reduce unit cost.
Go-to-market and demand creation
Go-to-market blends direct sales and distributor enablement to drive design-ins, with pricing and lifecycle management protecting margins; Power Integrations reported $701 million revenue in fiscal 2024, underscoring scalable demand.
Webinars, datasheets and engineering tools educate customers and boost conversion; trade shows and design contests expand pipeline and shorten time-to-design-in.
- Direct sales; - Distributor enablement; - Webinars/datasheets/tools; - Trade shows/design contests; - Pricing & lifecycle management
Compliance and certification support
Pre-compliance testing aligns Power Integrations products with safety and energy rules, reducing redesign cycles and easing UL and CE pathways; IEC 62368-1 and EU Ecodesign requirements remain primary 2024 reference standards. Documentation packages accelerate customer approvals and procurement timelines across regions. Regional certifications such as UL, CE and China CCC unlock market access while ongoing monitoring adapts designs to evolving standards and recalls.
- Pre-compliance testing: IEC 62368-1 (2024)
- Key certifications: UL, CE, CCC
- Documentation speeds approvals
- Continuous monitoring for standards updates
AC-DC power ICs: $701M revenue, >95% peak efficiency
Core activities: high-efficiency AC-DC topology design (peak >95%, standby <10 mW) and >1,000 global patents protect differentiation. Applications engineering: reference designs, BOMs and FAEs cut customer time-to-market ~40% and raise prototype-to-production conversion ~60% (2024 studies). Manufacturing: coordinate wafer/package/test with 8–12 week foundry lead times, target yields >85% and DPPM <100. GTM: direct sales, distributors, tools and lifecycle pricing drove $701M revenue FY2024.
| Metric | 2024 Value |
|---|---|
| Revenue | $701M |
| Patents | >1,000 |
| Peak efficiency | >95% |
| Standby | <10 mW |
| Foundry lead time | 8–12 weeks |
| Yield target | >85% |
| Time-to-market cut | ~40% |
| Prototype→production | ~60% |
| DPPM target | <100 |
Full Version Awaits
Business Model Canvas
The Power Integrations Business Model Canvas shown here is a live preview of the actual deliverable, not a mockup. When you purchase, you’ll receive this exact document—complete, editable, and formatted—so what you see is precisely what you will download and use. No surprises, full access.
Original: $10.00
-65%$10.00
$3.50Description
Unlock the full Business Model Canvas for a power electronics company
Unlock the full strategic blueprint behind Power Integrations with our Business Model Canvas—three to five carefully mapped sentences won’t do it justice. This in-depth Canvas reveals value drivers, partnerships, and revenue mechanics to inform investment or strategy. Download the complete Word and Excel files to inspect each of the nine blocks and apply proven insights to your plans.
Partnerships
Foundry and OSAT partners
Wafer fabs and OSAT partners manufacture Power Integrations high-voltage ICs at scale, leveraging specialized high-voltage and mixed-signal processes (up to 700 V) to deliver consistent performance. Close collaboration on process integration and test flows optimizes cost, reliability and lead times. Dual-sourcing across two independent foundries/OSATs mitigates geopolitical and supply risks.
OEM/ODM and power supply makers
Device brands and ODMs co-develop power stages and adapters around Power Integrations ICs, securing early design-wins that translate into faster volume ramps. Continuous OEM feedback refines reference designs, boosting efficiency and reliability in production. Joint roadmaps align IC and end-product release cycles to capture share of the $38.4B global power IC market in 2024.
Distributors and channel integrators
Global distributors such as Avnet and Arrow (authorized Power Integrations distributors in 2024) extend reach into thousands of accounts and regions, providing stocking, credit and demand-creation programs. Technical sales teams at these partners promote design-ins using demo boards and reference kits to accelerate customer adoption. Aggregated POS telemetry from distributors improves forecasting accuracy and shortens inventory turns across the supply chain.
Standards bodies and regulatory labs
Standards bodies and regulatory labs steer Power Integrations toward energy-efficiency and safety targets—many regulations now demand low-standby below 0.5 W and tighter emissions limits—while accredited labs accelerate cross‑border certifications, shortening approval cycles by up to 40% and cutting time-to-revenue. Active participation helps shape standards to favor integrated, high-efficiency solutions.
- Regulatory targets: low-standby <0.5 W
- Accredited labs: faster approvals, up to 40% time reduction
- Geographic reach: certifications across 50+ markets
- Strategic impact: standards shaped toward integrated solutions
EDA/IP and reference design partners
EDA tool vendors and IP partners streamline design cycles, with the global EDA market reaching about $15 billion in 2024; co-developed reference designs can cut customer engineering time by up to 40%, accelerating time-to-market. Firmware and toolchain providers improve system integration and reduce field issues, while ecosystem validation increases customer confidence and purchase conversion.
- EDA partners: faster cycles, access to verified IP
- Reference designs: ~40% engineering time saved
- Firmware/toolchains: smoother system integration
- Ecosystem validation: higher customer conversion
700 V dual-sourced power ICs cut engineering time ~40%, boosting access to $38.4B market
Power Integrations relies on dual-sourced wafer fabs and OSATs for high-voltage processes (up to 700 V) to ensure scale, cost control and supply resilience. Channel partners Avnet/Arrow plus reference-designs accelerate design-ins into the $38.4B power-IC market (2024), with EDA/IP ties in a $15B EDA ecosystem cutting engineering time ~40%. Standards and labs (certs in 50+ markets) trim approval times up to 40% and enforce <0.5 W standby targets.
What is included in the product
Detailed Word Document
A tailored Business Model Canvas for Power Integrations outlining customer segments, channels, value propositions, key activities, partners, resources, cost structure and revenue streams with practical insights. It links competitive advantages and SWOT to each BMC block for investor-ready presentations and strategic decision-making.
Customizable Excel Spreadsheet
Condenses Power Integrations' complex power-semiconductor strategy into a one-page, editable Business Model Canvas that quickly identifies revenue drivers, key partners, and pain-point solutions for faster decision-making and stakeholder alignment.
Activities
Mixed-signal and high-voltage IC R&D
Designing topologies for AC-DC conversion, control, and protection is core, enabling switch-mode supplies that exceed 95% peak efficiency while targeting standby under 10 mW for modern adapters. Continuous innovation focuses on higher efficiency and lower no-load consumption to meet global ecodesign trends. Intensive simulation, silicon validation, and iterative tapeouts drive performance and reduce ramp time. Active patenting (over 1,000 global patents) protects differentiation.
Applications engineering and reference designs
Applications engineering delivers turnkey designs, app notes and BOMs that shorten customer time-to-market by ~40% (2024 industry studies), while FAEs performing schematic/layout reviews and bring-up cut design iterations and support costs. Compliance-ready reference designs lower certification risk and failure rates, and demos/eval boards enable rapid prototyping, boosting prototype-to-production conversion by ~60% in 2024 engagements.
Supply chain and quality management
Coordinating wafer supply, packaging and test secures availability and yield, with foundry lead times in 2024 typically 8–12 weeks and target production yields >85% for power ICs. Reliability testing per AEC-Q100 and PPAP-level controls for industrial/automotive applications enforce robustness. Formal FA and RMA workflows track failures and corrective actions, driving DPPM toward automotive targets below 100. Continuous improvement efforts cut DPPM and reduce unit cost.
Go-to-market and demand creation
Go-to-market blends direct sales and distributor enablement to drive design-ins, with pricing and lifecycle management protecting margins; Power Integrations reported $701 million revenue in fiscal 2024, underscoring scalable demand.
Webinars, datasheets and engineering tools educate customers and boost conversion; trade shows and design contests expand pipeline and shorten time-to-design-in.
- Direct sales; - Distributor enablement; - Webinars/datasheets/tools; - Trade shows/design contests; - Pricing & lifecycle management
Compliance and certification support
Pre-compliance testing aligns Power Integrations products with safety and energy rules, reducing redesign cycles and easing UL and CE pathways; IEC 62368-1 and EU Ecodesign requirements remain primary 2024 reference standards. Documentation packages accelerate customer approvals and procurement timelines across regions. Regional certifications such as UL, CE and China CCC unlock market access while ongoing monitoring adapts designs to evolving standards and recalls.
- Pre-compliance testing: IEC 62368-1 (2024)
- Key certifications: UL, CE, CCC
- Documentation speeds approvals
- Continuous monitoring for standards updates
AC-DC power ICs: $701M revenue, >95% peak efficiency
Core activities: high-efficiency AC-DC topology design (peak >95%, standby <10 mW) and >1,000 global patents protect differentiation. Applications engineering: reference designs, BOMs and FAEs cut customer time-to-market ~40% and raise prototype-to-production conversion ~60% (2024 studies). Manufacturing: coordinate wafer/package/test with 8–12 week foundry lead times, target yields >85% and DPPM <100. GTM: direct sales, distributors, tools and lifecycle pricing drove $701M revenue FY2024.
| Metric | 2024 Value |
|---|---|
| Revenue | $701M |
| Patents | >1,000 |
| Peak efficiency | >95% |
| Standby | <10 mW |
| Foundry lead time | 8–12 weeks |
| Yield target | >85% |
| Time-to-market cut | ~40% |
| Prototype→production | ~60% |
| DPPM target | <100 |
Full Version Awaits
Business Model Canvas
The Power Integrations Business Model Canvas shown here is a live preview of the actual deliverable, not a mockup. When you purchase, you’ll receive this exact document—complete, editable, and formatted—so what you see is precisely what you will download and use. No surprises, full access.











