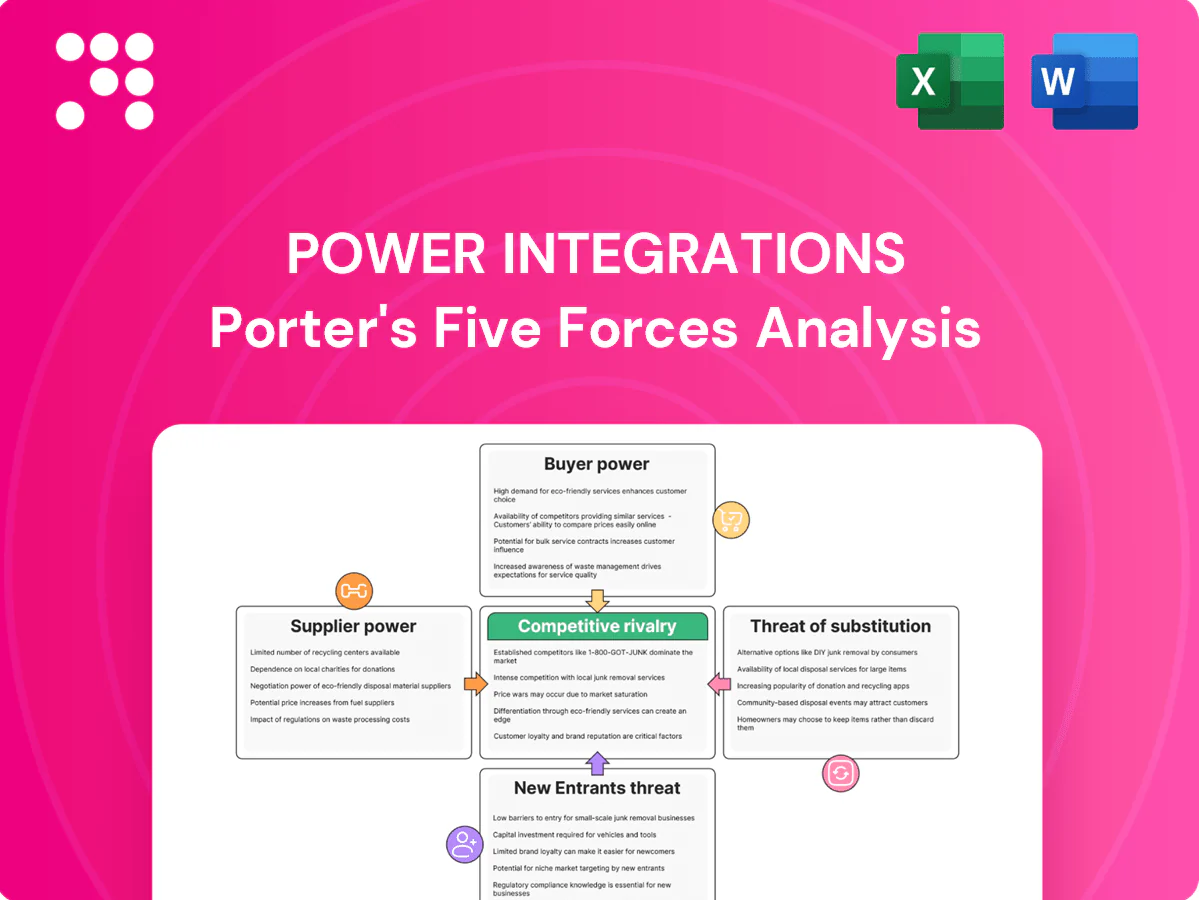
Power Integrations Porter's Five Forces Analysis

From Overview to Strategy Blueprint
Power Integrations faces intense supplier specialization, moderate buyer leverage, and evolving substitute threats from GaN and integrated solutions, while barriers to entry and rivalry hinge on IP and scale; this snapshot highlights key pressures and strategic levers. Unlock the full Porter's Five Forces Analysis to get force-by-force ratings, visuals, and actionable insights tailored for investment or strategy.
Suppliers Bargaining Power

Concentrated foundry dependencies
Power Integrations depends on a limited pool of advanced foundries for mixed-signal high-voltage processes, raising supplier leverage in 2024 as industry capacity tightness persisted. Node-specific constraints and long lead times can pressure pricing and delivery; dual-sourcing is feasible but costly due to process-porting and multi-month qualification. Long-term supply agreements and forecasts mitigate, but do not eliminate, supplier power.
Specialized materials and packaging
Specialized materials—high-voltage silicon wafers, GaN/SiC epi and advanced isolation/wide‑creepage packaging—remain non‑commoditized, with under five qualified suppliers for many specs in 2024, keeping supplier power high. Few vendors meet stringent isolation and reliability criteria, raising switching costs and making substrate, leadframe or molding compound disruptions capable of rippling through output and margins. Power Integrations mitigates this via strategic inventories and active vendor development to balance negotiating positions.

Test and equipment intensity
HV reliability and burn-in demand specialized sockets and ATE, tying Power Integrations to a narrow supplier set; industry reports in 2024 show ATE tool lead times of roughly 12–26 weeks, creating procurement lock-in and pricing pressure. Service contracts and spare-parts SLAs further raise switching costs, though higher volumes improve amortization of tool cost per unit. Co-development of test flows and sockets with vendors has reduced vendor power on cycle time and yield metrics but not on capital intensity.

IP, EDA, and firmware toolchains
IP, EDA, and firmware toolchains are concentrated among Synopsys, Cadence and Siemens (Mentor), which together account for roughly three-quarters of the EDA/IP market (2023–2024), and licensing is largely recurring. High migration costs from design-flow rework and retraining lock customers in, giving suppliers leverage on price and contract terms, mitigated but not erased by bundled or enterprise licenses.
- Concentration: top 3 ≈ 75% share
- Licenses: recurring fee model
- Switching: high rework/retraining costs
Geopolitical and logistics exposure
Wafer fabs and OSATs are regionally clustered in East Asia (over 60% of advanced capacity concentrated in Taiwan, South Korea and China), exposing Power Integrations to tariffs, export controls and shipping risks after 2023–24 policy shifts. Supply interruptions during scarcity strengthen supplier negotiating power, while vendor diversification across regions improves resilience. Qualifying alternates for safety-critical parts often takes 12–24 months, sustaining supplier influence.
- Concentration: >60% advanced capacity in East Asia
- Qualification time: 12–24 months for safety-critical parts
- Mitigation: regional vendor diversification reduces but does not eliminate risk
East Asia concentration, under five qualified suppliers and long ATE cycles heighten pricing risk
Supplier power is high: advanced foundry/OSAT concentration (>60% capacity in East Asia) and under five qualified suppliers for many HV processes in 2024 raise pricing and delivery risk; ATE lead times ~12–26 weeks and 12–24 month qualification for safety parts increase switching costs. EDA/IP vendors hold ~75% share, adding recurring-license lock‑in mitigants only partially reduce leverage.
| Metric | 2023–24 |
|---|---|
| East Asia capacity | >60% |
| Qualified suppliers | <5 |
| ATE lead time | 12–26 weeks |
| EDA/IP top-3 share | ≈75% |
What is included in the product
 Detailed Word Document
Concise Porter's Five Forces analysis for Power Integrations highlighting competitive rivalry, supplier and buyer power, barriers to entry, and threat of substitutes, pinpointing key drivers, emerging disruptions, and strategic leverage to protect margins and market position.

 Customizable Excel Spreadsheet
One-sheet Porter's Five Forces for Power Integrations that distills competitive pressures into actionable insights—ready for quick board decisions or slide decks and easily customized to reflect shifting market data.
Customers Bargaining Power

Large OEMs with scale
Large OEMs in consumer electronics and appliances purchase at multi-million unit scale and in 2024 secured volume rebates commonly reaching double digits, driving aggressive price benchmarking and multi-sourcing to push down costs.
However, once Power Integrations devices are designed in, requalification and PCB redesign can make mid-cycle switching costly—often six- to seven-figure program expenses—so roadmap alignment and negotiated volume rebates help rebalance bargaining power.
Design-in stickiness
Power ICs are deeply integrated into PSU topologies, BOMs, and certifications, so post-design changes typically add weeks to months (commonly 2–24 weeks) and can trigger certification retests costing roughly $10,000–$200,000, reducing buyer leverage after award. Buyers hold stronger bargaining power early in design. Power Integrations’ reference designs and app support materially raise win rates and customer retention, accelerating time-to-market.

Performance and regulatory pull
In 2024 DoE, China CoC and EU ErP updates tightened minimum-efficiency and standby-power requirements, and fast-charge standards shifted buyer focus toward energy savings, thermal headroom and low standby over lowest ASP. This elevates Power Integrations’ EcoSmart and high-integration offerings, enabling premium pricing on efficiency-led designs. Still, cost-sensitive segments continue to demand low-ASP alternatives, limiting margin capture.

Availability and lead-time sensitivity
OEMs penalize shortages and prize supply assurance, often forcing dual sourcing to extract better terms; industry lead times fell to about 12 weeks in 2024 (from ~26 weeks at the 2021 peak), reducing some buyer leverage. Consignment, hub stocking and VMI arrangements shift cost and service terms toward suppliers; in tight markets allocation favors reliable partners, while transparent forecasting improves mutual leverage and service levels.
- Dual sourcing: common negotiation lever
- Lead time: ~12 weeks in 2024
- VMI/consignment: alters payment/service terms
- Allocation: favors reliable partners
Customization and support expectations
- Services raise switching costs
- Custom variants enable price leverage
- Lifecycle guarantees cut obsolescence risk
Design lock‑in and $10k–$200k requal with ~12‑wk lead times empower suppliers
Large OEMs use multi-million unit buys and 2024 rebates often in double digits, strengthening buyer leverage early; design lock‑in, requal costs (typ. $10k–$200k) and 2–24 week redesigns shift power to Power Integrations. Services, VMI and ~12 week lead times in 2024 reduce buyer pressure, while efficiency regs enable premium pricing.
| Metric | 2024 Value |
|---|---|
| Lead time | ~12 weeks |
| Revenue | $627M |
| Requal cost | $10k–$200k |
Same Document Delivered
Power Integrations Porter's Five Forces Analysis
This preview shows the exact Power Integrations Porter's Five Forces Analysis you'll receive immediately after purchase—no mockups, no placeholders. The file is the complete, professionally formatted analysis, ready for download and practical use the moment you buy. You're seeing the final deliverable and will get this same document instantly upon payment.

From Overview to Strategy Blueprint
Power Integrations faces intense supplier specialization, moderate buyer leverage, and evolving substitute threats from GaN and integrated solutions, while barriers to entry and rivalry hinge on IP and scale; this snapshot highlights key pressures and strategic levers. Unlock the full Porter's Five Forces Analysis to get force-by-force ratings, visuals, and actionable insights tailored for investment or strategy.
Suppliers Bargaining Power
Concentrated foundry dependencies
Power Integrations depends on a limited pool of advanced foundries for mixed-signal high-voltage processes, raising supplier leverage in 2024 as industry capacity tightness persisted. Node-specific constraints and long lead times can pressure pricing and delivery; dual-sourcing is feasible but costly due to process-porting and multi-month qualification. Long-term supply agreements and forecasts mitigate, but do not eliminate, supplier power.
Specialized materials and packaging
Specialized materials—high-voltage silicon wafers, GaN/SiC epi and advanced isolation/wide‑creepage packaging—remain non‑commoditized, with under five qualified suppliers for many specs in 2024, keeping supplier power high. Few vendors meet stringent isolation and reliability criteria, raising switching costs and making substrate, leadframe or molding compound disruptions capable of rippling through output and margins. Power Integrations mitigates this via strategic inventories and active vendor development to balance negotiating positions.
Test and equipment intensity
HV reliability and burn-in demand specialized sockets and ATE, tying Power Integrations to a narrow supplier set; industry reports in 2024 show ATE tool lead times of roughly 12–26 weeks, creating procurement lock-in and pricing pressure. Service contracts and spare-parts SLAs further raise switching costs, though higher volumes improve amortization of tool cost per unit. Co-development of test flows and sockets with vendors has reduced vendor power on cycle time and yield metrics but not on capital intensity.
IP, EDA, and firmware toolchains
IP, EDA, and firmware toolchains are concentrated among Synopsys, Cadence and Siemens (Mentor), which together account for roughly three-quarters of the EDA/IP market (2023–2024), and licensing is largely recurring. High migration costs from design-flow rework and retraining lock customers in, giving suppliers leverage on price and contract terms, mitigated but not erased by bundled or enterprise licenses.
- Concentration: top 3 ≈ 75% share
- Licenses: recurring fee model
- Switching: high rework/retraining costs
Geopolitical and logistics exposure
Wafer fabs and OSATs are regionally clustered in East Asia (over 60% of advanced capacity concentrated in Taiwan, South Korea and China), exposing Power Integrations to tariffs, export controls and shipping risks after 2023–24 policy shifts. Supply interruptions during scarcity strengthen supplier negotiating power, while vendor diversification across regions improves resilience. Qualifying alternates for safety-critical parts often takes 12–24 months, sustaining supplier influence.
- Concentration: >60% advanced capacity in East Asia
- Qualification time: 12–24 months for safety-critical parts
- Mitigation: regional vendor diversification reduces but does not eliminate risk
East Asia concentration, under five qualified suppliers and long ATE cycles heighten pricing risk
Supplier power is high: advanced foundry/OSAT concentration (>60% capacity in East Asia) and under five qualified suppliers for many HV processes in 2024 raise pricing and delivery risk; ATE lead times ~12–26 weeks and 12–24 month qualification for safety parts increase switching costs. EDA/IP vendors hold ~75% share, adding recurring-license lock‑in mitigants only partially reduce leverage.
| Metric | 2023–24 |
|---|---|
| East Asia capacity | >60% |
| Qualified suppliers | <5 |
| ATE lead time | 12–26 weeks |
| EDA/IP top-3 share | ≈75% |
What is included in the product
Detailed Word Document
Concise Porter's Five Forces analysis for Power Integrations highlighting competitive rivalry, supplier and buyer power, barriers to entry, and threat of substitutes, pinpointing key drivers, emerging disruptions, and strategic leverage to protect margins and market position.
Customizable Excel Spreadsheet
One-sheet Porter's Five Forces for Power Integrations that distills competitive pressures into actionable insights—ready for quick board decisions or slide decks and easily customized to reflect shifting market data.
Customers Bargaining Power
Large OEMs with scale
Large OEMs in consumer electronics and appliances purchase at multi-million unit scale and in 2024 secured volume rebates commonly reaching double digits, driving aggressive price benchmarking and multi-sourcing to push down costs.
However, once Power Integrations devices are designed in, requalification and PCB redesign can make mid-cycle switching costly—often six- to seven-figure program expenses—so roadmap alignment and negotiated volume rebates help rebalance bargaining power.
Design-in stickiness
Power ICs are deeply integrated into PSU topologies, BOMs, and certifications, so post-design changes typically add weeks to months (commonly 2–24 weeks) and can trigger certification retests costing roughly $10,000–$200,000, reducing buyer leverage after award. Buyers hold stronger bargaining power early in design. Power Integrations’ reference designs and app support materially raise win rates and customer retention, accelerating time-to-market.
Performance and regulatory pull
In 2024 DoE, China CoC and EU ErP updates tightened minimum-efficiency and standby-power requirements, and fast-charge standards shifted buyer focus toward energy savings, thermal headroom and low standby over lowest ASP. This elevates Power Integrations’ EcoSmart and high-integration offerings, enabling premium pricing on efficiency-led designs. Still, cost-sensitive segments continue to demand low-ASP alternatives, limiting margin capture.
Availability and lead-time sensitivity
OEMs penalize shortages and prize supply assurance, often forcing dual sourcing to extract better terms; industry lead times fell to about 12 weeks in 2024 (from ~26 weeks at the 2021 peak), reducing some buyer leverage. Consignment, hub stocking and VMI arrangements shift cost and service terms toward suppliers; in tight markets allocation favors reliable partners, while transparent forecasting improves mutual leverage and service levels.
- Dual sourcing: common negotiation lever
- Lead time: ~12 weeks in 2024
- VMI/consignment: alters payment/service terms
- Allocation: favors reliable partners
Customization and support expectations
- Services raise switching costs
- Custom variants enable price leverage
- Lifecycle guarantees cut obsolescence risk
Design lock‑in and $10k–$200k requal with ~12‑wk lead times empower suppliers
Large OEMs use multi-million unit buys and 2024 rebates often in double digits, strengthening buyer leverage early; design lock‑in, requal costs (typ. $10k–$200k) and 2–24 week redesigns shift power to Power Integrations. Services, VMI and ~12 week lead times in 2024 reduce buyer pressure, while efficiency regs enable premium pricing.
| Metric | 2024 Value |
|---|---|
| Lead time | ~12 weeks |
| Revenue | $627M |
| Requal cost | $10k–$200k |
Same Document Delivered
Power Integrations Porter's Five Forces Analysis
This preview shows the exact Power Integrations Porter's Five Forces Analysis you'll receive immediately after purchase—no mockups, no placeholders. The file is the complete, professionally formatted analysis, ready for download and practical use the moment you buy. You're seeing the final deliverable and will get this same document instantly upon payment.
Description
From Overview to Strategy Blueprint
Power Integrations faces intense supplier specialization, moderate buyer leverage, and evolving substitute threats from GaN and integrated solutions, while barriers to entry and rivalry hinge on IP and scale; this snapshot highlights key pressures and strategic levers. Unlock the full Porter's Five Forces Analysis to get force-by-force ratings, visuals, and actionable insights tailored for investment or strategy.
Suppliers Bargaining Power
Concentrated foundry dependencies
Power Integrations depends on a limited pool of advanced foundries for mixed-signal high-voltage processes, raising supplier leverage in 2024 as industry capacity tightness persisted. Node-specific constraints and long lead times can pressure pricing and delivery; dual-sourcing is feasible but costly due to process-porting and multi-month qualification. Long-term supply agreements and forecasts mitigate, but do not eliminate, supplier power.
Specialized materials and packaging
Specialized materials—high-voltage silicon wafers, GaN/SiC epi and advanced isolation/wide‑creepage packaging—remain non‑commoditized, with under five qualified suppliers for many specs in 2024, keeping supplier power high. Few vendors meet stringent isolation and reliability criteria, raising switching costs and making substrate, leadframe or molding compound disruptions capable of rippling through output and margins. Power Integrations mitigates this via strategic inventories and active vendor development to balance negotiating positions.
Test and equipment intensity
HV reliability and burn-in demand specialized sockets and ATE, tying Power Integrations to a narrow supplier set; industry reports in 2024 show ATE tool lead times of roughly 12–26 weeks, creating procurement lock-in and pricing pressure. Service contracts and spare-parts SLAs further raise switching costs, though higher volumes improve amortization of tool cost per unit. Co-development of test flows and sockets with vendors has reduced vendor power on cycle time and yield metrics but not on capital intensity.
IP, EDA, and firmware toolchains
IP, EDA, and firmware toolchains are concentrated among Synopsys, Cadence and Siemens (Mentor), which together account for roughly three-quarters of the EDA/IP market (2023–2024), and licensing is largely recurring. High migration costs from design-flow rework and retraining lock customers in, giving suppliers leverage on price and contract terms, mitigated but not erased by bundled or enterprise licenses.
- Concentration: top 3 ≈ 75% share
- Licenses: recurring fee model
- Switching: high rework/retraining costs
Geopolitical and logistics exposure
Wafer fabs and OSATs are regionally clustered in East Asia (over 60% of advanced capacity concentrated in Taiwan, South Korea and China), exposing Power Integrations to tariffs, export controls and shipping risks after 2023–24 policy shifts. Supply interruptions during scarcity strengthen supplier negotiating power, while vendor diversification across regions improves resilience. Qualifying alternates for safety-critical parts often takes 12–24 months, sustaining supplier influence.
- Concentration: >60% advanced capacity in East Asia
- Qualification time: 12–24 months for safety-critical parts
- Mitigation: regional vendor diversification reduces but does not eliminate risk
East Asia concentration, under five qualified suppliers and long ATE cycles heighten pricing risk
Supplier power is high: advanced foundry/OSAT concentration (>60% capacity in East Asia) and under five qualified suppliers for many HV processes in 2024 raise pricing and delivery risk; ATE lead times ~12–26 weeks and 12–24 month qualification for safety parts increase switching costs. EDA/IP vendors hold ~75% share, adding recurring-license lock‑in mitigants only partially reduce leverage.
| Metric | 2023–24 |
|---|---|
| East Asia capacity | >60% |
| Qualified suppliers | <5 |
| ATE lead time | 12–26 weeks |
| EDA/IP top-3 share | ≈75% |
What is included in the product
Detailed Word Document
Concise Porter's Five Forces analysis for Power Integrations highlighting competitive rivalry, supplier and buyer power, barriers to entry, and threat of substitutes, pinpointing key drivers, emerging disruptions, and strategic leverage to protect margins and market position.
Customizable Excel Spreadsheet
One-sheet Porter's Five Forces for Power Integrations that distills competitive pressures into actionable insights—ready for quick board decisions or slide decks and easily customized to reflect shifting market data.
Customers Bargaining Power
Large OEMs with scale
Large OEMs in consumer electronics and appliances purchase at multi-million unit scale and in 2024 secured volume rebates commonly reaching double digits, driving aggressive price benchmarking and multi-sourcing to push down costs.
However, once Power Integrations devices are designed in, requalification and PCB redesign can make mid-cycle switching costly—often six- to seven-figure program expenses—so roadmap alignment and negotiated volume rebates help rebalance bargaining power.
Design-in stickiness
Power ICs are deeply integrated into PSU topologies, BOMs, and certifications, so post-design changes typically add weeks to months (commonly 2–24 weeks) and can trigger certification retests costing roughly $10,000–$200,000, reducing buyer leverage after award. Buyers hold stronger bargaining power early in design. Power Integrations’ reference designs and app support materially raise win rates and customer retention, accelerating time-to-market.
Performance and regulatory pull
In 2024 DoE, China CoC and EU ErP updates tightened minimum-efficiency and standby-power requirements, and fast-charge standards shifted buyer focus toward energy savings, thermal headroom and low standby over lowest ASP. This elevates Power Integrations’ EcoSmart and high-integration offerings, enabling premium pricing on efficiency-led designs. Still, cost-sensitive segments continue to demand low-ASP alternatives, limiting margin capture.
Availability and lead-time sensitivity
OEMs penalize shortages and prize supply assurance, often forcing dual sourcing to extract better terms; industry lead times fell to about 12 weeks in 2024 (from ~26 weeks at the 2021 peak), reducing some buyer leverage. Consignment, hub stocking and VMI arrangements shift cost and service terms toward suppliers; in tight markets allocation favors reliable partners, while transparent forecasting improves mutual leverage and service levels.
- Dual sourcing: common negotiation lever
- Lead time: ~12 weeks in 2024
- VMI/consignment: alters payment/service terms
- Allocation: favors reliable partners
Customization and support expectations
- Services raise switching costs
- Custom variants enable price leverage
- Lifecycle guarantees cut obsolescence risk
Design lock‑in and $10k–$200k requal with ~12‑wk lead times empower suppliers
Large OEMs use multi-million unit buys and 2024 rebates often in double digits, strengthening buyer leverage early; design lock‑in, requal costs (typ. $10k–$200k) and 2–24 week redesigns shift power to Power Integrations. Services, VMI and ~12 week lead times in 2024 reduce buyer pressure, while efficiency regs enable premium pricing.
| Metric | 2024 Value |
|---|---|
| Lead time | ~12 weeks |
| Revenue | $627M |
| Requal cost | $10k–$200k |
Same Document Delivered
Power Integrations Porter's Five Forces Analysis
This preview shows the exact Power Integrations Porter's Five Forces Analysis you'll receive immediately after purchase—no mockups, no placeholders. The file is the complete, professionally formatted analysis, ready for download and practical use the moment you buy. You're seeing the final deliverable and will get this same document instantly upon payment.











