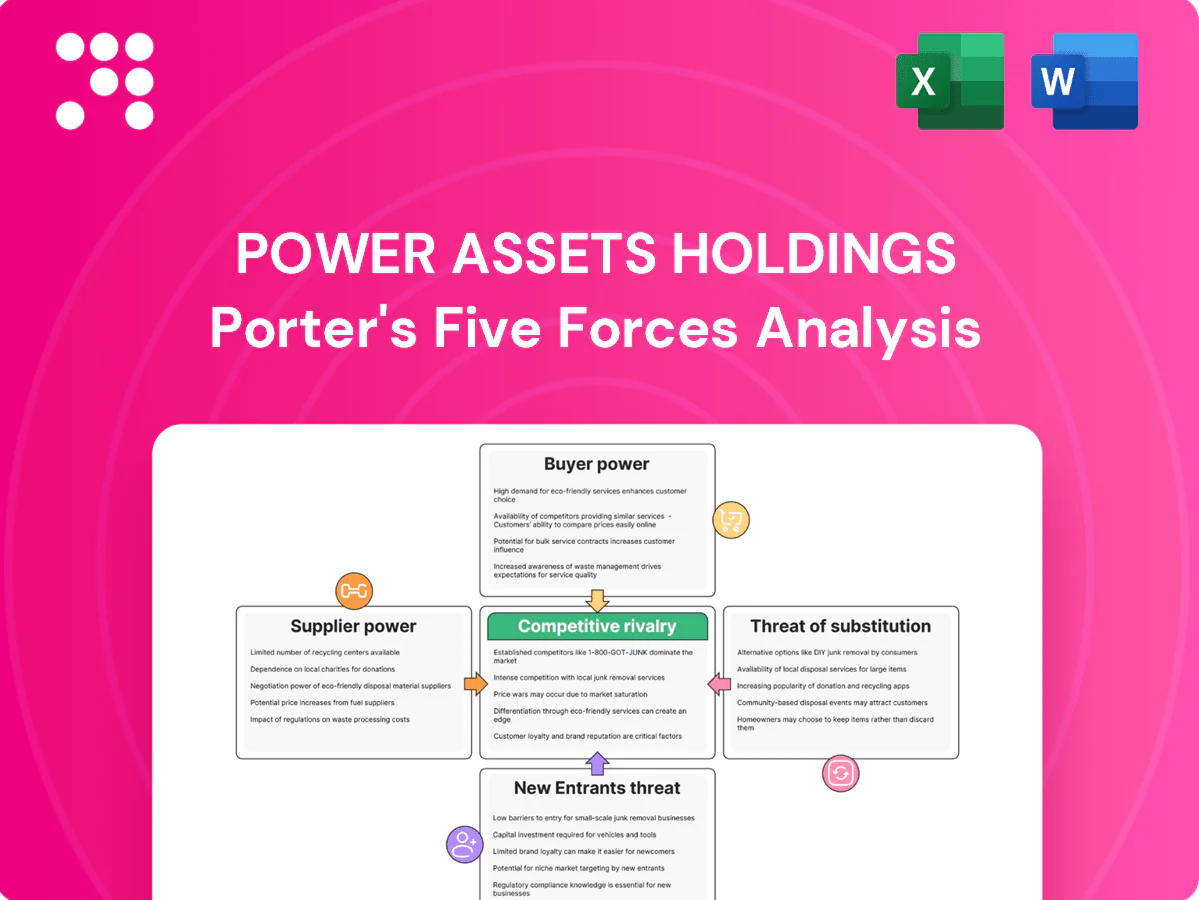
Power Assets Holdings Porter's Five Forces Analysis

From Overview to Strategy Blueprint
Power Assets Holdings faces moderated supplier power and regulated barriers that limit new entrants, while evolving demand and decarbonisation trends shape competitive intensity. Buyer leverage and substitute technologies pose growing strategic risks that require proactive management. This snapshot highlights key pressures and strategic levers. Unlock the full Porter's Five Forces Analysis for force-by-force ratings, visuals, and actionable recommendations tailored to Power Assets Holdings.
Suppliers Bargaining Power

Bargaining Power of Suppliers 1
Fuel suppliers (gas, coal) retained leverage in 2024 via commodity volatility and contract terms, pressuring merchant generation margins. Long-term hedges and diversified regional sourcing at Power Assets tempered exposure, while regulatory pass-through mechanisms in several networks limited input-cost impact. Nevertheless, episodic tight gas markets and logistics constraints in 2024 intermittently squeezed generation margins.
Bargaining Power of Suppliers 2
OEM concentration—top five wind-turbine suppliers account for ~80% of global market in 2024—raises switching costs for Power Assets Holdings when sourcing turbines, transformers and grid gear. Lead times of 12–24 months and aftermarket service contracts (representing roughly 20–30% of OEM lifecycle revenue) strengthen supplier bargaining power. Multi-year framework agreements and dual-sourcing materially cut single-vendor exposure. Localization and component standardization reduce lifecycle cost escalation and import dependency.

Bargaining Power of Suppliers 3
EPC contractors and specialist engineers, who typically account for over 50% of project capex, strongly influence timelines and final capex for Power Assets projects. Capacity cycles and skilled-labor shortages have driven double-digit bid premiums and delivery delays in tight periods. Competitive tendering and performance-linked contracts realign incentives. Geographic diversification lets work shift to markets with better capacity availability.

Bargaining Power of Suppliers 4
Capital providers drive Power Assets Holdings' financing for long-duration projects; 10-year US Treasury yields averaged around 4.3% in 2024, pushing project finance spreads and cost of debt higher. Investment-grade credit profiles and regulated, inflation-linked cash flows (US CPI ~3.4% in 2024) improve access and pricing, but tighter credit raises WACC and limits bid competitiveness.
- Capital providers: high
- Avg 10y Treasury 2024: ~4.3%
- Project finance spreads: ~150–250bps for IG
- Inflation-indexed tariffs moderate lender power
- Tighter credit → higher WACC, lower bids
Bargaining Power of Suppliers 5
Bargaining power of suppliers is moderate to high for Power Assets Holdings because specialized talent and O&M service providers hold situational leverage in complex grids and renewables, and safety, compliance and cyber requirements as of 2024 limit rapid substitutions. In-house capabilities and long-term partnerships have moderated wage and service cost spikes, while training pipelines and digitalization are reducing dependency over time.
- Specialized O&M leverage
- Regulatory and cyber switching costs
- In-house and partnership mitigation
- Digitalization reduces dependency
Supplier leverage rises in 2024: fuel volatility, OEM concentration, rising finance costs
Bargaining power of suppliers is moderate-high for Power Assets Holdings in 2024: fuel volatility and tight gas markets intermittently squeezed margins, OEM concentration (top‑5 ~80% share) and 12–24 month lead times raise switching costs, while capital cost pressure (10y US Treasury ~4.3%; project‑finance spreads ~150–250bps) increases supplier leverage; in‑house capabilities and long‑term contracts partially mitigate risk.
| Metric | 2024 |
|---|---|
| Top‑5 OEM market share | ~80% |
| OEM lead times | 12–24 months |
| Aftermarket revenue | 20–30% |
| 10y US Treasury | ~4.3% |
| Project finance spreads (IG) | 150–250bps |
What is included in the product
 Detailed Word Document
Tailored Porter's Five Forces analysis for Power Assets Holdings that uncovers competitive drivers, supplier and buyer power, threats from substitutes and new entrants, and strategic levers to protect margins and market position.

 Customizable Excel Spreadsheet
A concise one-sheet Porter's Five Forces for Power Assets Holdings—instantly revealing regulatory, supplier, buyer, substitute and competitive pressures for faster strategic decisions and easy slide-ready summaries.
Customers Bargaining Power

Bargaining Power of Customers 1
In regulated networks like Power Assets Holdings, end-users have limited switching ability, keeping buyer power low; industry customer churn is typically under 2% annually. Tariffs are set by regulators (tariff reviews in 2024 fixed allowed returns), service obligations and reliability standards determine value, and complaint mechanisms rarely change prices materially.
Bargaining Power of Customers 2
In competitive retail markets like the UK and Australia, millions of customer switches annually raise buyer power and force tighter pricing and service; price comparison tools and smart meters — installed in over 50% of UK homes by 2024 — boost transparency. Churn risk demands better tariffs, service and hedging, but Power Assets Holdings’ emphasis on network ownership and generation stakes buffers direct retail exposure.

Bargaining Power of Customers 3
Large industrial and commercial users can extract favorable PPAs or bespoke terms due to scale and predictable load profiles, allowing price and flexibility leverage; in the 2024 PPA market tenors commonly ranged 10–20 years. Strong creditworthiness and long tenors reduce seller risk, supporting better pricing for developers. However, local grid constraints and limited capacity can materially curtail buyers’ negotiating room.

Bargaining Power of Customers 4
- Customer ESG demand: >4,000 SBTi companies by 2024
- Market impact: ~20% of 2024 new renewables driven by corporate/utility buyers
- Retention tools: portfolio mix, guarantees of origin, bundled certification
Bargaining Power of Customers 5
Regulatory and political stakeholders act as meta-customers for Power Assets in 2024, with monopoly network reviews typically conducted every 3–5 years and increasingly using performance-based mechanisms that can adjust allowed returns and capex plans.
Periodic reviews in 2024 have imposed both incentives and penalties tied to service quality and emissions; strong compliance and stakeholder engagement materially reduce the risk of adverse determinations that would lower returns or delay projects.
- Review frequency: 3–5 years
- 2024 trend: greater use of performance-based regulation
- Impact: allowed returns and capex plans can be adjusted
- Mitigation: robust compliance and stakeholder management
Under 2% churn vs retail pressure; smart meters over 50%
Buyer power is generally low in regulated networks (customer churn <2%, tariffs set by regulators; reviews every 3–5 years), but higher in retail markets where >50% UK smart meter penetration (2024) and active switching pressure pricing. Large C&I buyers secure 10–20y PPAs; ESG demand (4,000+ SBTi companies) drove ~20% of 2024 renewables additions.
| Metric | 2024 Value |
|---|---|
| Network churn | <2% pa |
| UK smart meters | >50% homes |
| SBTi companies | >4,000 |
| Corporate-driven renewables | ~20% |
| PPA tenors | 10–20 years |
Same Document Delivered
Power Assets Holdings Porter's Five Forces Analysis
This preview shows the exact Porter's Five Forces analysis of Power Assets Holdings you'll receive—no surprises or placeholders. The document is professionally written, fully formatted, and ready for download immediately after purchase. You're viewing the final deliverable, identical to the file delivered upon payment.

From Overview to Strategy Blueprint
Power Assets Holdings faces moderated supplier power and regulated barriers that limit new entrants, while evolving demand and decarbonisation trends shape competitive intensity. Buyer leverage and substitute technologies pose growing strategic risks that require proactive management. This snapshot highlights key pressures and strategic levers. Unlock the full Porter's Five Forces Analysis for force-by-force ratings, visuals, and actionable recommendations tailored to Power Assets Holdings.
Suppliers Bargaining Power
Bargaining Power of Suppliers 1
Fuel suppliers (gas, coal) retained leverage in 2024 via commodity volatility and contract terms, pressuring merchant generation margins. Long-term hedges and diversified regional sourcing at Power Assets tempered exposure, while regulatory pass-through mechanisms in several networks limited input-cost impact. Nevertheless, episodic tight gas markets and logistics constraints in 2024 intermittently squeezed generation margins.
Bargaining Power of Suppliers 2
OEM concentration—top five wind-turbine suppliers account for ~80% of global market in 2024—raises switching costs for Power Assets Holdings when sourcing turbines, transformers and grid gear. Lead times of 12–24 months and aftermarket service contracts (representing roughly 20–30% of OEM lifecycle revenue) strengthen supplier bargaining power. Multi-year framework agreements and dual-sourcing materially cut single-vendor exposure. Localization and component standardization reduce lifecycle cost escalation and import dependency.
Bargaining Power of Suppliers 3
EPC contractors and specialist engineers, who typically account for over 50% of project capex, strongly influence timelines and final capex for Power Assets projects. Capacity cycles and skilled-labor shortages have driven double-digit bid premiums and delivery delays in tight periods. Competitive tendering and performance-linked contracts realign incentives. Geographic diversification lets work shift to markets with better capacity availability.
Bargaining Power of Suppliers 4
Capital providers drive Power Assets Holdings' financing for long-duration projects; 10-year US Treasury yields averaged around 4.3% in 2024, pushing project finance spreads and cost of debt higher. Investment-grade credit profiles and regulated, inflation-linked cash flows (US CPI ~3.4% in 2024) improve access and pricing, but tighter credit raises WACC and limits bid competitiveness.
- Capital providers: high
- Avg 10y Treasury 2024: ~4.3%
- Project finance spreads: ~150–250bps for IG
- Inflation-indexed tariffs moderate lender power
- Tighter credit → higher WACC, lower bids
Bargaining Power of Suppliers 5
Bargaining power of suppliers is moderate to high for Power Assets Holdings because specialized talent and O&M service providers hold situational leverage in complex grids and renewables, and safety, compliance and cyber requirements as of 2024 limit rapid substitutions. In-house capabilities and long-term partnerships have moderated wage and service cost spikes, while training pipelines and digitalization are reducing dependency over time.
- Specialized O&M leverage
- Regulatory and cyber switching costs
- In-house and partnership mitigation
- Digitalization reduces dependency
Supplier leverage rises in 2024: fuel volatility, OEM concentration, rising finance costs
Bargaining power of suppliers is moderate-high for Power Assets Holdings in 2024: fuel volatility and tight gas markets intermittently squeezed margins, OEM concentration (top‑5 ~80% share) and 12–24 month lead times raise switching costs, while capital cost pressure (10y US Treasury ~4.3%; project‑finance spreads ~150–250bps) increases supplier leverage; in‑house capabilities and long‑term contracts partially mitigate risk.
| Metric | 2024 |
|---|---|
| Top‑5 OEM market share | ~80% |
| OEM lead times | 12–24 months |
| Aftermarket revenue | 20–30% |
| 10y US Treasury | ~4.3% |
| Project finance spreads (IG) | 150–250bps |
What is included in the product
Detailed Word Document
Tailored Porter's Five Forces analysis for Power Assets Holdings that uncovers competitive drivers, supplier and buyer power, threats from substitutes and new entrants, and strategic levers to protect margins and market position.
Customizable Excel Spreadsheet
A concise one-sheet Porter's Five Forces for Power Assets Holdings—instantly revealing regulatory, supplier, buyer, substitute and competitive pressures for faster strategic decisions and easy slide-ready summaries.
Customers Bargaining Power
Bargaining Power of Customers 1
In regulated networks like Power Assets Holdings, end-users have limited switching ability, keeping buyer power low; industry customer churn is typically under 2% annually. Tariffs are set by regulators (tariff reviews in 2024 fixed allowed returns), service obligations and reliability standards determine value, and complaint mechanisms rarely change prices materially.
Bargaining Power of Customers 2
In competitive retail markets like the UK and Australia, millions of customer switches annually raise buyer power and force tighter pricing and service; price comparison tools and smart meters — installed in over 50% of UK homes by 2024 — boost transparency. Churn risk demands better tariffs, service and hedging, but Power Assets Holdings’ emphasis on network ownership and generation stakes buffers direct retail exposure.
Bargaining Power of Customers 3
Large industrial and commercial users can extract favorable PPAs or bespoke terms due to scale and predictable load profiles, allowing price and flexibility leverage; in the 2024 PPA market tenors commonly ranged 10–20 years. Strong creditworthiness and long tenors reduce seller risk, supporting better pricing for developers. However, local grid constraints and limited capacity can materially curtail buyers’ negotiating room.
Bargaining Power of Customers 4
- Customer ESG demand: >4,000 SBTi companies by 2024
- Market impact: ~20% of 2024 new renewables driven by corporate/utility buyers
- Retention tools: portfolio mix, guarantees of origin, bundled certification
Bargaining Power of Customers 5
Regulatory and political stakeholders act as meta-customers for Power Assets in 2024, with monopoly network reviews typically conducted every 3–5 years and increasingly using performance-based mechanisms that can adjust allowed returns and capex plans.
Periodic reviews in 2024 have imposed both incentives and penalties tied to service quality and emissions; strong compliance and stakeholder engagement materially reduce the risk of adverse determinations that would lower returns or delay projects.
- Review frequency: 3–5 years
- 2024 trend: greater use of performance-based regulation
- Impact: allowed returns and capex plans can be adjusted
- Mitigation: robust compliance and stakeholder management
Under 2% churn vs retail pressure; smart meters over 50%
Buyer power is generally low in regulated networks (customer churn <2%, tariffs set by regulators; reviews every 3–5 years), but higher in retail markets where >50% UK smart meter penetration (2024) and active switching pressure pricing. Large C&I buyers secure 10–20y PPAs; ESG demand (4,000+ SBTi companies) drove ~20% of 2024 renewables additions.
| Metric | 2024 Value |
|---|---|
| Network churn | <2% pa |
| UK smart meters | >50% homes |
| SBTi companies | >4,000 |
| Corporate-driven renewables | ~20% |
| PPA tenors | 10–20 years |
Same Document Delivered
Power Assets Holdings Porter's Five Forces Analysis
This preview shows the exact Porter's Five Forces analysis of Power Assets Holdings you'll receive—no surprises or placeholders. The document is professionally written, fully formatted, and ready for download immediately after purchase. You're viewing the final deliverable, identical to the file delivered upon payment.
Original: $10.00
-65%$10.00
$3.50Description
From Overview to Strategy Blueprint
Power Assets Holdings faces moderated supplier power and regulated barriers that limit new entrants, while evolving demand and decarbonisation trends shape competitive intensity. Buyer leverage and substitute technologies pose growing strategic risks that require proactive management. This snapshot highlights key pressures and strategic levers. Unlock the full Porter's Five Forces Analysis for force-by-force ratings, visuals, and actionable recommendations tailored to Power Assets Holdings.
Suppliers Bargaining Power
Bargaining Power of Suppliers 1
Fuel suppliers (gas, coal) retained leverage in 2024 via commodity volatility and contract terms, pressuring merchant generation margins. Long-term hedges and diversified regional sourcing at Power Assets tempered exposure, while regulatory pass-through mechanisms in several networks limited input-cost impact. Nevertheless, episodic tight gas markets and logistics constraints in 2024 intermittently squeezed generation margins.
Bargaining Power of Suppliers 2
OEM concentration—top five wind-turbine suppliers account for ~80% of global market in 2024—raises switching costs for Power Assets Holdings when sourcing turbines, transformers and grid gear. Lead times of 12–24 months and aftermarket service contracts (representing roughly 20–30% of OEM lifecycle revenue) strengthen supplier bargaining power. Multi-year framework agreements and dual-sourcing materially cut single-vendor exposure. Localization and component standardization reduce lifecycle cost escalation and import dependency.
Bargaining Power of Suppliers 3
EPC contractors and specialist engineers, who typically account for over 50% of project capex, strongly influence timelines and final capex for Power Assets projects. Capacity cycles and skilled-labor shortages have driven double-digit bid premiums and delivery delays in tight periods. Competitive tendering and performance-linked contracts realign incentives. Geographic diversification lets work shift to markets with better capacity availability.
Bargaining Power of Suppliers 4
Capital providers drive Power Assets Holdings' financing for long-duration projects; 10-year US Treasury yields averaged around 4.3% in 2024, pushing project finance spreads and cost of debt higher. Investment-grade credit profiles and regulated, inflation-linked cash flows (US CPI ~3.4% in 2024) improve access and pricing, but tighter credit raises WACC and limits bid competitiveness.
- Capital providers: high
- Avg 10y Treasury 2024: ~4.3%
- Project finance spreads: ~150–250bps for IG
- Inflation-indexed tariffs moderate lender power
- Tighter credit → higher WACC, lower bids
Bargaining Power of Suppliers 5
Bargaining power of suppliers is moderate to high for Power Assets Holdings because specialized talent and O&M service providers hold situational leverage in complex grids and renewables, and safety, compliance and cyber requirements as of 2024 limit rapid substitutions. In-house capabilities and long-term partnerships have moderated wage and service cost spikes, while training pipelines and digitalization are reducing dependency over time.
- Specialized O&M leverage
- Regulatory and cyber switching costs
- In-house and partnership mitigation
- Digitalization reduces dependency
Supplier leverage rises in 2024: fuel volatility, OEM concentration, rising finance costs
Bargaining power of suppliers is moderate-high for Power Assets Holdings in 2024: fuel volatility and tight gas markets intermittently squeezed margins, OEM concentration (top‑5 ~80% share) and 12–24 month lead times raise switching costs, while capital cost pressure (10y US Treasury ~4.3%; project‑finance spreads ~150–250bps) increases supplier leverage; in‑house capabilities and long‑term contracts partially mitigate risk.
| Metric | 2024 |
|---|---|
| Top‑5 OEM market share | ~80% |
| OEM lead times | 12–24 months |
| Aftermarket revenue | 20–30% |
| 10y US Treasury | ~4.3% |
| Project finance spreads (IG) | 150–250bps |
What is included in the product
Detailed Word Document
Tailored Porter's Five Forces analysis for Power Assets Holdings that uncovers competitive drivers, supplier and buyer power, threats from substitutes and new entrants, and strategic levers to protect margins and market position.
Customizable Excel Spreadsheet
A concise one-sheet Porter's Five Forces for Power Assets Holdings—instantly revealing regulatory, supplier, buyer, substitute and competitive pressures for faster strategic decisions and easy slide-ready summaries.
Customers Bargaining Power
Bargaining Power of Customers 1
In regulated networks like Power Assets Holdings, end-users have limited switching ability, keeping buyer power low; industry customer churn is typically under 2% annually. Tariffs are set by regulators (tariff reviews in 2024 fixed allowed returns), service obligations and reliability standards determine value, and complaint mechanisms rarely change prices materially.
Bargaining Power of Customers 2
In competitive retail markets like the UK and Australia, millions of customer switches annually raise buyer power and force tighter pricing and service; price comparison tools and smart meters — installed in over 50% of UK homes by 2024 — boost transparency. Churn risk demands better tariffs, service and hedging, but Power Assets Holdings’ emphasis on network ownership and generation stakes buffers direct retail exposure.
Bargaining Power of Customers 3
Large industrial and commercial users can extract favorable PPAs or bespoke terms due to scale and predictable load profiles, allowing price and flexibility leverage; in the 2024 PPA market tenors commonly ranged 10–20 years. Strong creditworthiness and long tenors reduce seller risk, supporting better pricing for developers. However, local grid constraints and limited capacity can materially curtail buyers’ negotiating room.
Bargaining Power of Customers 4
- Customer ESG demand: >4,000 SBTi companies by 2024
- Market impact: ~20% of 2024 new renewables driven by corporate/utility buyers
- Retention tools: portfolio mix, guarantees of origin, bundled certification
Bargaining Power of Customers 5
Regulatory and political stakeholders act as meta-customers for Power Assets in 2024, with monopoly network reviews typically conducted every 3–5 years and increasingly using performance-based mechanisms that can adjust allowed returns and capex plans.
Periodic reviews in 2024 have imposed both incentives and penalties tied to service quality and emissions; strong compliance and stakeholder engagement materially reduce the risk of adverse determinations that would lower returns or delay projects.
- Review frequency: 3–5 years
- 2024 trend: greater use of performance-based regulation
- Impact: allowed returns and capex plans can be adjusted
- Mitigation: robust compliance and stakeholder management
Under 2% churn vs retail pressure; smart meters over 50%
Buyer power is generally low in regulated networks (customer churn <2%, tariffs set by regulators; reviews every 3–5 years), but higher in retail markets where >50% UK smart meter penetration (2024) and active switching pressure pricing. Large C&I buyers secure 10–20y PPAs; ESG demand (4,000+ SBTi companies) drove ~20% of 2024 renewables additions.
| Metric | 2024 Value |
|---|---|
| Network churn | <2% pa |
| UK smart meters | >50% homes |
| SBTi companies | >4,000 |
| Corporate-driven renewables | ~20% |
| PPA tenors | 10–20 years |
Same Document Delivered
Power Assets Holdings Porter's Five Forces Analysis
This preview shows the exact Porter's Five Forces analysis of Power Assets Holdings you'll receive—no surprises or placeholders. The document is professionally written, fully formatted, and ready for download immediately after purchase. You're viewing the final deliverable, identical to the file delivered upon payment.











