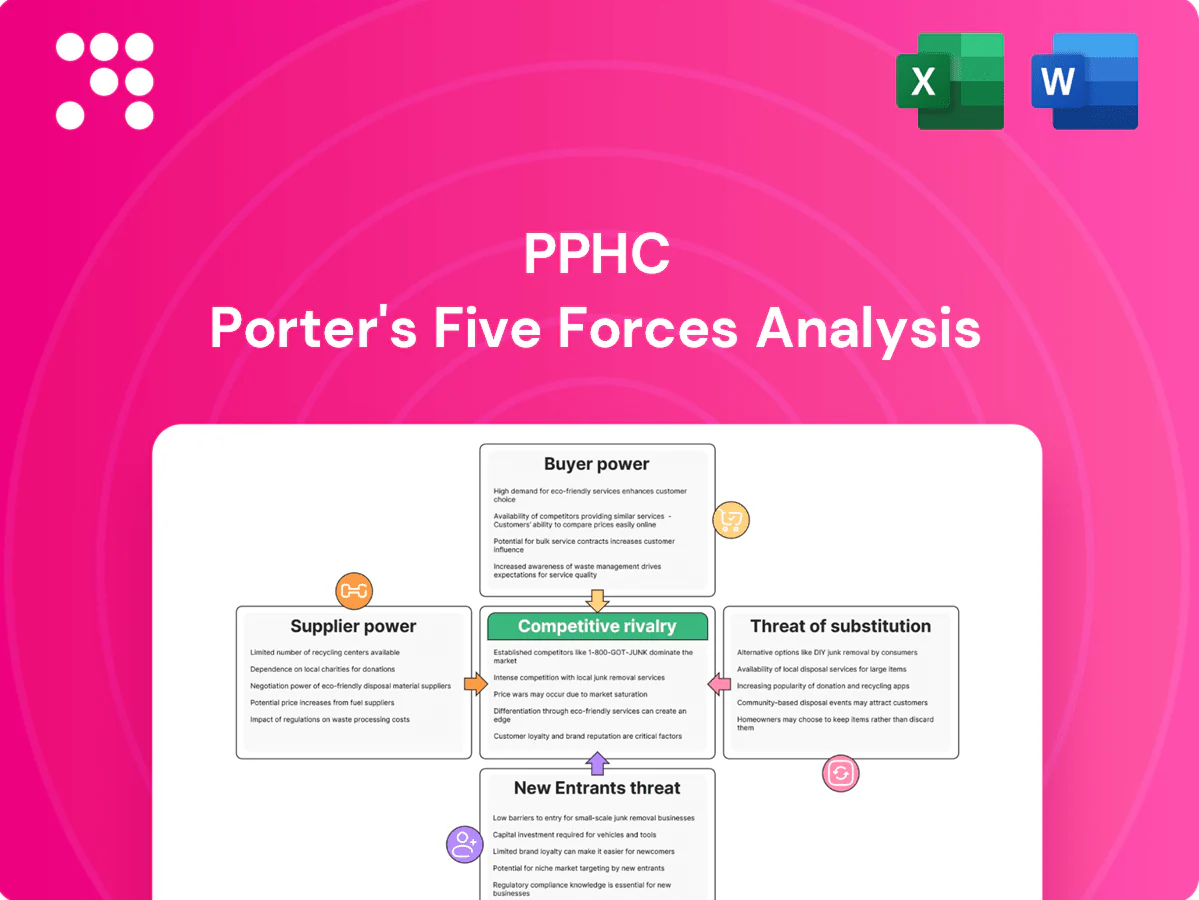
PPHC Porter's Five Forces Analysis

From Overview to Strategy Blueprint
PPHC’s Porter’s Five Forces snapshot highlights moderate buyer power, concentrated supplier influence in key inputs, and rising threat from digital substitutes that could compress margins; competitive rivalry is intense among mid-sized players while regulatory barriers limit new entrants. This brief overview only scratches the surface—unlock the full Porter’s Five Forces Analysis to explore force-by-force ratings, visuals, and strategic implications tailored to PPHC.
Suppliers Bargaining Power

Specialized policy talent scarcity
PPHC depends on experienced lobbyists, policy analysts, and communicators who are limited and highly mobile, concentrating bargaining power among a small talent pool. Star practitioners can command premiums, with top lobbyists and strategists linked to the roughly $4 billion annual US lobbying market. Poaching risk raises switching costs and wage pressure, increasing supplier leverage over fees and retention terms.
Access to policymakers and networks
Relationships with officials, staffers, and coalition partners act as quasi-suppliers of access, with gatekeepers and boutique connectors constraining availability and timing. In the US context, roughly 12,500 registered federal lobbyists and about $5.0 billion in lobbying spend (2023–24) concentrate leverage among few intermediaries. When access is scarce or regulated, these actors can demand higher fees and stricter conditions, directly shaping campaign design and delivery.

Regulatory intelligence and data vendors
Bill-tracking, polling and media-monitoring platforms are core inputs for regulatory intelligence; the global RegTech market was valued at about USD 14.9 billion in 2024, underscoring demand concentration. A handful of leading vendors drive dependency and price inelasticity for premium features; switching costs from retraining and preserving historical continuity raise effective barriers, while bundled contracts further lock in spend.

Media and digital platforms
Paid media, social platforms and ad-tech intermediaries control reach and CPMs — Google and Meta together captured roughly 50% of US digital ad spend in 2024, concentrating inventory and pricing power.
Policy-sensitive targeting often forces advertisers to use approved partners with few alternatives, and algorithm or policy shifts (e.g., privacy and feed-ranking changes) can reduce campaign effectiveness overnight.
This volatility gives platforms leverage to tighten inventory, raise CPMs and extract fees via ad-tech stacks.
- High concentration: Google + Meta ≈ 50% US digital ad spend (2024)
- Volatility: algorithm/policy changes can cut reach and lift CPMs rapidly
- Approved partners: limited alternatives for policy-sensitive targeting
Legal and compliance specialists
Legal and compliance specialists for campaign finance, lobbying disclosure, and ethics counsel exert strong supplier power for PPHC; niche experts in complex jurisdictions are limited and work in cyclical windows, often setting project scope and timelines. U.S. lobbying spend topped roughly $4.0 billion in 2023 and 2024 filings indicate sustained demand, with premium rates common during legislative crunch periods.
- Critical suppliers: campaign finance, lobbying disclosure, ethics counsel
- Scarcity: niche jurisdiction experts booked in cycles
- Impact: availability dictates timelines and scope
- Pricing: premium rates during legislative crunches; sustained demand per 2023–24 lobbying levels
Supplier power rises: talent scarcity, RegTech concentration and ad duopoly drive premiums
Supplier power is high: talent scarcity (≈12,500 federal lobbyists) and $4.0B US lobbying spend (2023–24) let top practitioners command premiums. RegTech concentration ($14.9B global 2024) and Google+Meta ≈50% US digital ad spend (2024) raise vendor leverage and switching costs, while legal/compliance experts extract premiums in legislative cycles.
| Metric | 2024 value |
|---|---|
| Federal lobbyists | ≈12,500 |
| US lobbying spend | $4.0B (2023–24) |
| RegTech market | $14.9B |
| Google+Meta share | ≈50% US digital ad spend |
What is included in the product
 Detailed Word Document
Concise Porter's Five Forces analysis tailored for PPHC that uncovers competitive drivers, buyer/supplier power, substitute threats, and entry barriers shaping profitability. Fully editable for use in investor decks, strategy reports, or academic projects.

 Customizable Excel Spreadsheet
PPHC's one-sheet Porter's Five Forces instantly visualizes competitive pressure with a customizable spider chart for scenario analysis, ready to drop into decks—no macros or finance expertise required.
Customers Bargaining Power

Large clients and concentrated spend
Enterprise clients in regulated sectors aggregate large budgets and routinely negotiate rate cards, strict performance metrics, and multi-year rebates commonly in the 5–15% range (market practice in 2024); consolidated RFPs further intensify pricing pressure and margin erosion; loss of a single anchor client with high concentration can cut revenue by double-digit percentages and materially disrupt cash flow and forecasts.
Low switching costs across agencies
Buyers can multi-home across firms and rotate scopes quickly; 2024 R3 data shows about 54% of marketers use four or more agencies, intensifying price competition. Institutional knowledge gives some stickiness, but onboarding averages under three months, keeping churn manageable. Competitive pitching continues to erode margins, and framework agreements permit rapid reallocation of spend within existing supplier pools.

Outcome-driven contracts
Clients now demand measurable policy outcomes and narrative shifts, insisting on milestone-based payments, blended rates, and termination for convenience clauses; fee-at-risk and success-fee components shift bargaining power toward buyers. This structure forces firms to accept compressed retainers during uncertain policy windows, tying revenue volatility to policy timelines and measurable impact metrics.

Information parity via tools
Information parity via bill-tracking and analytics has become pervasive by 2024, narrowing historical asymmetries as buyers use dashboards and public filings to benchmark agencies side-by-side. This transparency compresses markups on commoditized tasks and shifts pricing pressure onto strategic value rather than transactional execution. Agencies must differentiate through distinctive strategy, client relationships and demonstrable outcomes.
- 2024: dashboards enable direct agency benchmarking
- Transparency reduces markups on commoditized services
- Clients demand strategic differentiation and relationship ROI
Procurement and compliance constraints
Procurement imposes vendor caps, rate ceilings and mandatory audit trails that compress margins; public procurement represented about 12% of GDP in OECD countries in 2024. Conflict-of-interest rules sharply limit cross-selling, while long payment terms (EU Late Payment Directive allows up to 60 days) strain agency cash flows. Buyers use compliance to standardize scopes and extract discounts, raising customer bargaining power.
- Vendor caps limit supplier share
- 60-day max payment terms (EU)
- Audit trails increase compliance costs
- COI rules restrict cross-selling
Buyer leverage: 5-15% rebates, sub-3-month onboarding, multi-homing risk
Enterprise buyers extract 5–15% rebates (market practice 2024); loss of an anchor client can cut revenue by double-digit percentages. 2024 R3 data: 54% of marketers use four or more agencies; onboarding averages under three months, enabling rapid scope shifts. Dashboards and public filings compress markups; procurement rules and 60-day EU terms (public procurement ≈12% GDP) boost buyer leverage.
| Metric | 2024 Data |
|---|---|
| Typical rebates | 5–15% |
| Multi-homing | 54% use ≥4 agencies |
| Onboarding | <3 months |
| Public procurement | ≈12% of GDP |
| EU max payment term | 60 days |
What You See Is What You Get
PPHC Porter's Five Forces Analysis
This preview shows the exact PPHC Porter's Five Forces Analysis you'll receive immediately after purchase—complete, professionally formatted, and ready to use. The file displayed is the final deliverable, not a sample or mockup, and includes the full competitive assessment, key findings, and actionable implications. Purchase grants instant access to this identical document.

From Overview to Strategy Blueprint
PPHC’s Porter’s Five Forces snapshot highlights moderate buyer power, concentrated supplier influence in key inputs, and rising threat from digital substitutes that could compress margins; competitive rivalry is intense among mid-sized players while regulatory barriers limit new entrants. This brief overview only scratches the surface—unlock the full Porter’s Five Forces Analysis to explore force-by-force ratings, visuals, and strategic implications tailored to PPHC.
Suppliers Bargaining Power
Specialized policy talent scarcity
PPHC depends on experienced lobbyists, policy analysts, and communicators who are limited and highly mobile, concentrating bargaining power among a small talent pool. Star practitioners can command premiums, with top lobbyists and strategists linked to the roughly $4 billion annual US lobbying market. Poaching risk raises switching costs and wage pressure, increasing supplier leverage over fees and retention terms.
Access to policymakers and networks
Relationships with officials, staffers, and coalition partners act as quasi-suppliers of access, with gatekeepers and boutique connectors constraining availability and timing. In the US context, roughly 12,500 registered federal lobbyists and about $5.0 billion in lobbying spend (2023–24) concentrate leverage among few intermediaries. When access is scarce or regulated, these actors can demand higher fees and stricter conditions, directly shaping campaign design and delivery.
Regulatory intelligence and data vendors
Bill-tracking, polling and media-monitoring platforms are core inputs for regulatory intelligence; the global RegTech market was valued at about USD 14.9 billion in 2024, underscoring demand concentration. A handful of leading vendors drive dependency and price inelasticity for premium features; switching costs from retraining and preserving historical continuity raise effective barriers, while bundled contracts further lock in spend.
Media and digital platforms
Paid media, social platforms and ad-tech intermediaries control reach and CPMs — Google and Meta together captured roughly 50% of US digital ad spend in 2024, concentrating inventory and pricing power.
Policy-sensitive targeting often forces advertisers to use approved partners with few alternatives, and algorithm or policy shifts (e.g., privacy and feed-ranking changes) can reduce campaign effectiveness overnight.
This volatility gives platforms leverage to tighten inventory, raise CPMs and extract fees via ad-tech stacks.
- High concentration: Google + Meta ≈ 50% US digital ad spend (2024)
- Volatility: algorithm/policy changes can cut reach and lift CPMs rapidly
- Approved partners: limited alternatives for policy-sensitive targeting
Legal and compliance specialists
Legal and compliance specialists for campaign finance, lobbying disclosure, and ethics counsel exert strong supplier power for PPHC; niche experts in complex jurisdictions are limited and work in cyclical windows, often setting project scope and timelines. U.S. lobbying spend topped roughly $4.0 billion in 2023 and 2024 filings indicate sustained demand, with premium rates common during legislative crunch periods.
- Critical suppliers: campaign finance, lobbying disclosure, ethics counsel
- Scarcity: niche jurisdiction experts booked in cycles
- Impact: availability dictates timelines and scope
- Pricing: premium rates during legislative crunches; sustained demand per 2023–24 lobbying levels
Supplier power rises: talent scarcity, RegTech concentration and ad duopoly drive premiums
Supplier power is high: talent scarcity (≈12,500 federal lobbyists) and $4.0B US lobbying spend (2023–24) let top practitioners command premiums. RegTech concentration ($14.9B global 2024) and Google+Meta ≈50% US digital ad spend (2024) raise vendor leverage and switching costs, while legal/compliance experts extract premiums in legislative cycles.
| Metric | 2024 value |
|---|---|
| Federal lobbyists | ≈12,500 |
| US lobbying spend | $4.0B (2023–24) |
| RegTech market | $14.9B |
| Google+Meta share | ≈50% US digital ad spend |
What is included in the product
Detailed Word Document
Concise Porter's Five Forces analysis tailored for PPHC that uncovers competitive drivers, buyer/supplier power, substitute threats, and entry barriers shaping profitability. Fully editable for use in investor decks, strategy reports, or academic projects.
Customizable Excel Spreadsheet
PPHC's one-sheet Porter's Five Forces instantly visualizes competitive pressure with a customizable spider chart for scenario analysis, ready to drop into decks—no macros or finance expertise required.
Customers Bargaining Power
Large clients and concentrated spend
Enterprise clients in regulated sectors aggregate large budgets and routinely negotiate rate cards, strict performance metrics, and multi-year rebates commonly in the 5–15% range (market practice in 2024); consolidated RFPs further intensify pricing pressure and margin erosion; loss of a single anchor client with high concentration can cut revenue by double-digit percentages and materially disrupt cash flow and forecasts.
Low switching costs across agencies
Buyers can multi-home across firms and rotate scopes quickly; 2024 R3 data shows about 54% of marketers use four or more agencies, intensifying price competition. Institutional knowledge gives some stickiness, but onboarding averages under three months, keeping churn manageable. Competitive pitching continues to erode margins, and framework agreements permit rapid reallocation of spend within existing supplier pools.
Outcome-driven contracts
Clients now demand measurable policy outcomes and narrative shifts, insisting on milestone-based payments, blended rates, and termination for convenience clauses; fee-at-risk and success-fee components shift bargaining power toward buyers. This structure forces firms to accept compressed retainers during uncertain policy windows, tying revenue volatility to policy timelines and measurable impact metrics.
Information parity via tools
Information parity via bill-tracking and analytics has become pervasive by 2024, narrowing historical asymmetries as buyers use dashboards and public filings to benchmark agencies side-by-side. This transparency compresses markups on commoditized tasks and shifts pricing pressure onto strategic value rather than transactional execution. Agencies must differentiate through distinctive strategy, client relationships and demonstrable outcomes.
- 2024: dashboards enable direct agency benchmarking
- Transparency reduces markups on commoditized services
- Clients demand strategic differentiation and relationship ROI
Procurement and compliance constraints
Procurement imposes vendor caps, rate ceilings and mandatory audit trails that compress margins; public procurement represented about 12% of GDP in OECD countries in 2024. Conflict-of-interest rules sharply limit cross-selling, while long payment terms (EU Late Payment Directive allows up to 60 days) strain agency cash flows. Buyers use compliance to standardize scopes and extract discounts, raising customer bargaining power.
- Vendor caps limit supplier share
- 60-day max payment terms (EU)
- Audit trails increase compliance costs
- COI rules restrict cross-selling
Buyer leverage: 5-15% rebates, sub-3-month onboarding, multi-homing risk
Enterprise buyers extract 5–15% rebates (market practice 2024); loss of an anchor client can cut revenue by double-digit percentages. 2024 R3 data: 54% of marketers use four or more agencies; onboarding averages under three months, enabling rapid scope shifts. Dashboards and public filings compress markups; procurement rules and 60-day EU terms (public procurement ≈12% GDP) boost buyer leverage.
| Metric | 2024 Data |
|---|---|
| Typical rebates | 5–15% |
| Multi-homing | 54% use ≥4 agencies |
| Onboarding | <3 months |
| Public procurement | ≈12% of GDP |
| EU max payment term | 60 days |
What You See Is What You Get
PPHC Porter's Five Forces Analysis
This preview shows the exact PPHC Porter's Five Forces Analysis you'll receive immediately after purchase—complete, professionally formatted, and ready to use. The file displayed is the final deliverable, not a sample or mockup, and includes the full competitive assessment, key findings, and actionable implications. Purchase grants instant access to this identical document.
Original: $10.00
-65%$10.00
$3.50Description
From Overview to Strategy Blueprint
PPHC’s Porter’s Five Forces snapshot highlights moderate buyer power, concentrated supplier influence in key inputs, and rising threat from digital substitutes that could compress margins; competitive rivalry is intense among mid-sized players while regulatory barriers limit new entrants. This brief overview only scratches the surface—unlock the full Porter’s Five Forces Analysis to explore force-by-force ratings, visuals, and strategic implications tailored to PPHC.
Suppliers Bargaining Power
Specialized policy talent scarcity
PPHC depends on experienced lobbyists, policy analysts, and communicators who are limited and highly mobile, concentrating bargaining power among a small talent pool. Star practitioners can command premiums, with top lobbyists and strategists linked to the roughly $4 billion annual US lobbying market. Poaching risk raises switching costs and wage pressure, increasing supplier leverage over fees and retention terms.
Access to policymakers and networks
Relationships with officials, staffers, and coalition partners act as quasi-suppliers of access, with gatekeepers and boutique connectors constraining availability and timing. In the US context, roughly 12,500 registered federal lobbyists and about $5.0 billion in lobbying spend (2023–24) concentrate leverage among few intermediaries. When access is scarce or regulated, these actors can demand higher fees and stricter conditions, directly shaping campaign design and delivery.
Regulatory intelligence and data vendors
Bill-tracking, polling and media-monitoring platforms are core inputs for regulatory intelligence; the global RegTech market was valued at about USD 14.9 billion in 2024, underscoring demand concentration. A handful of leading vendors drive dependency and price inelasticity for premium features; switching costs from retraining and preserving historical continuity raise effective barriers, while bundled contracts further lock in spend.
Media and digital platforms
Paid media, social platforms and ad-tech intermediaries control reach and CPMs — Google and Meta together captured roughly 50% of US digital ad spend in 2024, concentrating inventory and pricing power.
Policy-sensitive targeting often forces advertisers to use approved partners with few alternatives, and algorithm or policy shifts (e.g., privacy and feed-ranking changes) can reduce campaign effectiveness overnight.
This volatility gives platforms leverage to tighten inventory, raise CPMs and extract fees via ad-tech stacks.
- High concentration: Google + Meta ≈ 50% US digital ad spend (2024)
- Volatility: algorithm/policy changes can cut reach and lift CPMs rapidly
- Approved partners: limited alternatives for policy-sensitive targeting
Legal and compliance specialists
Legal and compliance specialists for campaign finance, lobbying disclosure, and ethics counsel exert strong supplier power for PPHC; niche experts in complex jurisdictions are limited and work in cyclical windows, often setting project scope and timelines. U.S. lobbying spend topped roughly $4.0 billion in 2023 and 2024 filings indicate sustained demand, with premium rates common during legislative crunch periods.
- Critical suppliers: campaign finance, lobbying disclosure, ethics counsel
- Scarcity: niche jurisdiction experts booked in cycles
- Impact: availability dictates timelines and scope
- Pricing: premium rates during legislative crunches; sustained demand per 2023–24 lobbying levels
Supplier power rises: talent scarcity, RegTech concentration and ad duopoly drive premiums
Supplier power is high: talent scarcity (≈12,500 federal lobbyists) and $4.0B US lobbying spend (2023–24) let top practitioners command premiums. RegTech concentration ($14.9B global 2024) and Google+Meta ≈50% US digital ad spend (2024) raise vendor leverage and switching costs, while legal/compliance experts extract premiums in legislative cycles.
| Metric | 2024 value |
|---|---|
| Federal lobbyists | ≈12,500 |
| US lobbying spend | $4.0B (2023–24) |
| RegTech market | $14.9B |
| Google+Meta share | ≈50% US digital ad spend |
What is included in the product
Detailed Word Document
Concise Porter's Five Forces analysis tailored for PPHC that uncovers competitive drivers, buyer/supplier power, substitute threats, and entry barriers shaping profitability. Fully editable for use in investor decks, strategy reports, or academic projects.
Customizable Excel Spreadsheet
PPHC's one-sheet Porter's Five Forces instantly visualizes competitive pressure with a customizable spider chart for scenario analysis, ready to drop into decks—no macros or finance expertise required.
Customers Bargaining Power
Large clients and concentrated spend
Enterprise clients in regulated sectors aggregate large budgets and routinely negotiate rate cards, strict performance metrics, and multi-year rebates commonly in the 5–15% range (market practice in 2024); consolidated RFPs further intensify pricing pressure and margin erosion; loss of a single anchor client with high concentration can cut revenue by double-digit percentages and materially disrupt cash flow and forecasts.
Low switching costs across agencies
Buyers can multi-home across firms and rotate scopes quickly; 2024 R3 data shows about 54% of marketers use four or more agencies, intensifying price competition. Institutional knowledge gives some stickiness, but onboarding averages under three months, keeping churn manageable. Competitive pitching continues to erode margins, and framework agreements permit rapid reallocation of spend within existing supplier pools.
Outcome-driven contracts
Clients now demand measurable policy outcomes and narrative shifts, insisting on milestone-based payments, blended rates, and termination for convenience clauses; fee-at-risk and success-fee components shift bargaining power toward buyers. This structure forces firms to accept compressed retainers during uncertain policy windows, tying revenue volatility to policy timelines and measurable impact metrics.
Information parity via tools
Information parity via bill-tracking and analytics has become pervasive by 2024, narrowing historical asymmetries as buyers use dashboards and public filings to benchmark agencies side-by-side. This transparency compresses markups on commoditized tasks and shifts pricing pressure onto strategic value rather than transactional execution. Agencies must differentiate through distinctive strategy, client relationships and demonstrable outcomes.
- 2024: dashboards enable direct agency benchmarking
- Transparency reduces markups on commoditized services
- Clients demand strategic differentiation and relationship ROI
Procurement and compliance constraints
Procurement imposes vendor caps, rate ceilings and mandatory audit trails that compress margins; public procurement represented about 12% of GDP in OECD countries in 2024. Conflict-of-interest rules sharply limit cross-selling, while long payment terms (EU Late Payment Directive allows up to 60 days) strain agency cash flows. Buyers use compliance to standardize scopes and extract discounts, raising customer bargaining power.
- Vendor caps limit supplier share
- 60-day max payment terms (EU)
- Audit trails increase compliance costs
- COI rules restrict cross-selling
Buyer leverage: 5-15% rebates, sub-3-month onboarding, multi-homing risk
Enterprise buyers extract 5–15% rebates (market practice 2024); loss of an anchor client can cut revenue by double-digit percentages. 2024 R3 data: 54% of marketers use four or more agencies; onboarding averages under three months, enabling rapid scope shifts. Dashboards and public filings compress markups; procurement rules and 60-day EU terms (public procurement ≈12% GDP) boost buyer leverage.
| Metric | 2024 Data |
|---|---|
| Typical rebates | 5–15% |
| Multi-homing | 54% use ≥4 agencies |
| Onboarding | <3 months |
| Public procurement | ≈12% of GDP |
| EU max payment term | 60 days |
What You See Is What You Get
PPHC Porter's Five Forces Analysis
This preview shows the exact PPHC Porter's Five Forces Analysis you'll receive immediately after purchase—complete, professionally formatted, and ready to use. The file displayed is the final deliverable, not a sample or mockup, and includes the full competitive assessment, key findings, and actionable implications. Purchase grants instant access to this identical document.











