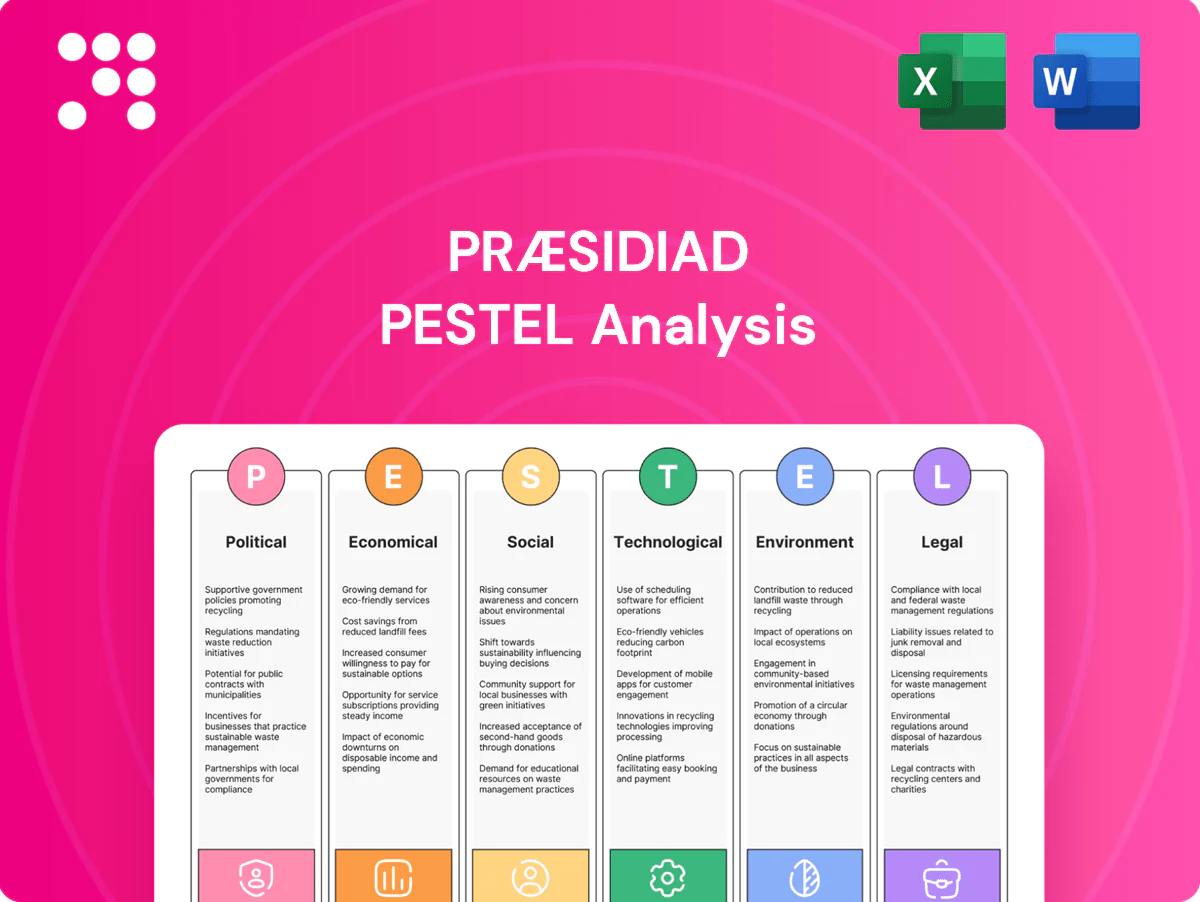
Præsidiad PESTLE Analysis

Your Shortcut to Market Insight Starts Here
Gain a strategic edge with our targeted PESTLE Analysis of Præsidiad—three concise sections unpack political, economic, social, technological, legal, and environmental forces shaping its trajectory. These actionable insights are tailored for investors, advisors, and strategists who need fast, reliable intelligence. Purchase the full report to access the complete, editable breakdown and make confident, data-driven decisions.
Political factors

Government security spending
Public budgets for critical infrastructure and border protection strongly drive demand—world military expenditure reached $2.24 trillion in 2023, up 3.7% vs 2022 (SIPRI). Shifts in defense and homeland-security priorities can accelerate or delay contracts, while election cycles and fiscal austerity introduce procurement volatility. Diversifying across geographies mitigates this cyclicality and evens revenue streams.
Public procurement dynamics
Tender rules, local content requirements and anti-corruption clauses sharply shape access to contracts; OECD data show public procurement averages about 12% of GDP in member countries. Long approval timelines reduce revenue visibility for bidders. Framework agreements can create multi-year pipelines—EU rules generally cap them at four years. Building relationships with agencies improves prequalification and award prospects.

Geopolitical risk and instability
Conflict zones and terrorism drive higher perimeter and cyber security spend as firms operating near hotspots face elevated threat vectors; SIPRI reports global military expenditure hit $2.24 trillion in 2023, underscoring persistent instability. Sanctions and trade restrictions can abruptly cut sales or partners, raising compliance costs. Project execution risk climbs in fragile states, so robust risk assessment and political risk insurance are essential.

Trade policy and tariffs
Tariffs on steel (25%) and aluminum (10%) under US Section 232 raise input costs for Præsidiad’s hardware and finished-goods lines, increasing margins pressure.
Regional trade agreements like USMCA (effective 2020) and CPTPP (11 members) reshape sourcing and pricing by altering duty schedules and rules of origin.
Customs delays cause multi-day delivery disruptions and inventory buildup; localizing production in key markets reduces tariff exposure and cross-border risk.
- Tariffs: steel 25%, aluminum 10%
- Agreements: USMCA effective 2020; CPTPP 11 members
- Risk: multi-day customs delays
- Mitigation: localize production to cut tariffs
Infrastructure policy and funding
Infrastructure policy and funding drive national resilience programs that unlock projects—e.g., the US $1.2 trillion Bipartisan Infrastructure Law and the EU Recovery and Resilience Facility (€723.8bn) channel capital into utilities, transport and border security; public–private partnerships increasingly finance large installations, de‑risking upfront fiscal burden; tracking policy pipelines enables capacity planning and bid timing.
- Policy drivers: national resilience programs
- Key funds: US $1.2tn, EU €723.8bn
- Financing: PPPs for capex
- Action: track pipelines for capacity planning
Political drivers lift defense & infrastructure demand; world military spend $2.24tn
Political drivers—defense budgets, procurement rules, tariffs and infrastructure policy—shape demand, margins and access; world military expenditure was $2.24tn in 2023 (SIPRI) and public procurement averages ~12% of GDP (OECD). Tariffs (US steel 25%, aluminum 10%) raise input costs; US $1.2tn Bipartisan Infrastructure Law and EU €723.8bn Recovery Facility create project pipelines requiring local content and long approval timelines.
| Item | Value | Impact |
|---|---|---|
| World military spend (2023) | $2.24tn | ↑ Defence demand |
| Public procurement (OECD) | ~12% GDP | Contract scale |
| US tariffs | Steel 25% / Al 10% | Input cost pressure |
| Infrastructure funds | US $1.2tn / EU €723.8bn | Project pipeline |
What is included in the product
 Detailed Word Document
Explores how external macro-environmental factors uniquely affect the Præsidiad across Political, Economic, Social, Technological, Environmental, and Legal dimensions, with data-backed subpoints and forward-looking insights tailored to its region and industry to guide executives, investors, and strategists.

 Customizable Excel Spreadsheet
A concise, visually segmented Præsidiad PESTLE summary that’s easily editable and shareable for meetings, presentations and cross‑team alignment, helping teams quickly surface external risks and market positioning.
Economic factors

Construction and capex cycles
Perimeter security revenues track construction and industrial capex cycles, with demand softening as utilities, logistics and manufacturing capex slowed in 2024; order intake fell in tandem across project-driven markets. Backlogs, often covering several months of revenue, cushion short-term dips and preserve margins. Diversified end-markets — critical infrastructure, logistics, commercial and industrial customers — stabilize revenue streams despite cyclical variability.
Commodity and input costs
Steel, coatings and electronics experienced double-digit price swings in 2023–24, pressuring margins across the defence supply chain; Præsidiad reports volatility-driven margin compression in recent quarters. Index-linked contracts allow timely pass-through of input inflation, protecting revenue recognition. Active hedging and supplier diversification materially reduce exposure to spot spikes. Design optimisation programmes have cut material intensity in similar OEMs by up to mid-teens, lowering input cost sensitivity.

FX volatility
Global sales and multi-currency sourcing expose Præsidiad to translation and transaction risk—major pairs (eg GBP/USD) swung roughly 20% in 2021–23—compressing margins where currency mismatches occur. Local production and invoicing in local currencies provide natural hedges that materially lower net exposure. Residual risk is managed with forward contracts and FX options; many corporates hedge roughly 60–80% of projected flows.

Supply chain and logistics
Shipping rates fell roughly 80% from 2021 peaks to 2024 (Drewry WCI), while LA vessel queues dropped from 109 ships in Jan 2022 to single digits by 2024, reducing lead-time volatility. Nearshoring (McKinsey) can cut custom-project lead times by up to 50%, enabling faster iteration. Inventory carrying costs remain ~20–30% of value, so just-in-time vs buffer stock tradeoffs and vendor consolidation improving OTIF and reliability drive margin and service outcomes.
- Shipping rates: -80% from 2021 to 2024
- Port congestion: LA queues 109→single digits (2022→2024)
- Nearshoring: lead times -up to 50%
- Inventory cost: ~20–30% annually
- Vendor consolidation: higher OTIF, lower complexity
Interest rates and financing
Rising benchmark rates (US fed funds 5.25–5.50% and ECB deposit ~4.0% in 2024–25) raise customer hurdle rates and push back capex-heavy security projects; leasing or financed solutions (lease rates typically 6–8%) help sustain demand. Higher rates increase working capital costs for large contracts and require stronger balance sheets to win tenders needing 5–10% performance bonds.
- Higher hurdle rates: slower capex
- Leasing sustains demand
- Working capital up: financing strain
- Strong balance sheet wins bonds
Political drivers lift defense & infrastructure demand; world military spend $2.24tn
Perimeter-security demand softened in 2024 with order intake down as utilities and industrial capex slowed, but multi-month backlogs and diversified end-markets preserved revenue. Input-price volatility (steel/coatings/electronics) and ~20% FX swings compressed margins; index-linked contracts and hedging reduced impact. Higher rates (US 5.25–5.50%, ECB ~4.0%) raised hurdle rates; leasing (6–8%) and local production mitigated funding and lead-time risks.
| Metric | 2024/25 |
|---|---|
| US fed funds | 5.25–5.50% |
| ECB deposit | ~4.0% |
| Shipping rates vs 2021 | -80% |
| LA port queues | 109→single digits |
| Inventory cost | 20–30% pa |
| FX swing (major pairs) | ~20% |
| Leasing rates | 6–8% |
Preview Before You Purchase
Præsidiad PESTLE Analysis
The Præsidiad PESTLE Analysis preview shown here is the exact document you’ll receive after purchase—fully formatted, professionally structured, and ready to use. This is a real screenshot of the product you’re buying, delivered exactly as shown. No placeholders or teasers—what you see is the final file available for immediate download after payment.

Your Shortcut to Market Insight Starts Here
Gain a strategic edge with our targeted PESTLE Analysis of Præsidiad—three concise sections unpack political, economic, social, technological, legal, and environmental forces shaping its trajectory. These actionable insights are tailored for investors, advisors, and strategists who need fast, reliable intelligence. Purchase the full report to access the complete, editable breakdown and make confident, data-driven decisions.
Political factors
Government security spending
Public budgets for critical infrastructure and border protection strongly drive demand—world military expenditure reached $2.24 trillion in 2023, up 3.7% vs 2022 (SIPRI). Shifts in defense and homeland-security priorities can accelerate or delay contracts, while election cycles and fiscal austerity introduce procurement volatility. Diversifying across geographies mitigates this cyclicality and evens revenue streams.
Public procurement dynamics
Tender rules, local content requirements and anti-corruption clauses sharply shape access to contracts; OECD data show public procurement averages about 12% of GDP in member countries. Long approval timelines reduce revenue visibility for bidders. Framework agreements can create multi-year pipelines—EU rules generally cap them at four years. Building relationships with agencies improves prequalification and award prospects.
Geopolitical risk and instability
Conflict zones and terrorism drive higher perimeter and cyber security spend as firms operating near hotspots face elevated threat vectors; SIPRI reports global military expenditure hit $2.24 trillion in 2023, underscoring persistent instability. Sanctions and trade restrictions can abruptly cut sales or partners, raising compliance costs. Project execution risk climbs in fragile states, so robust risk assessment and political risk insurance are essential.
Trade policy and tariffs
Tariffs on steel (25%) and aluminum (10%) under US Section 232 raise input costs for Præsidiad’s hardware and finished-goods lines, increasing margins pressure.
Regional trade agreements like USMCA (effective 2020) and CPTPP (11 members) reshape sourcing and pricing by altering duty schedules and rules of origin.
Customs delays cause multi-day delivery disruptions and inventory buildup; localizing production in key markets reduces tariff exposure and cross-border risk.
- Tariffs: steel 25%, aluminum 10%
- Agreements: USMCA effective 2020; CPTPP 11 members
- Risk: multi-day customs delays
- Mitigation: localize production to cut tariffs
Infrastructure policy and funding
Infrastructure policy and funding drive national resilience programs that unlock projects—e.g., the US $1.2 trillion Bipartisan Infrastructure Law and the EU Recovery and Resilience Facility (€723.8bn) channel capital into utilities, transport and border security; public–private partnerships increasingly finance large installations, de‑risking upfront fiscal burden; tracking policy pipelines enables capacity planning and bid timing.
- Policy drivers: national resilience programs
- Key funds: US $1.2tn, EU €723.8bn
- Financing: PPPs for capex
- Action: track pipelines for capacity planning
Political drivers lift defense & infrastructure demand; world military spend $2.24tn
Political drivers—defense budgets, procurement rules, tariffs and infrastructure policy—shape demand, margins and access; world military expenditure was $2.24tn in 2023 (SIPRI) and public procurement averages ~12% of GDP (OECD). Tariffs (US steel 25%, aluminum 10%) raise input costs; US $1.2tn Bipartisan Infrastructure Law and EU €723.8bn Recovery Facility create project pipelines requiring local content and long approval timelines.
| Item | Value | Impact |
|---|---|---|
| World military spend (2023) | $2.24tn | ↑ Defence demand |
| Public procurement (OECD) | ~12% GDP | Contract scale |
| US tariffs | Steel 25% / Al 10% | Input cost pressure |
| Infrastructure funds | US $1.2tn / EU €723.8bn | Project pipeline |
What is included in the product
Detailed Word Document
Explores how external macro-environmental factors uniquely affect the Præsidiad across Political, Economic, Social, Technological, Environmental, and Legal dimensions, with data-backed subpoints and forward-looking insights tailored to its region and industry to guide executives, investors, and strategists.
Customizable Excel Spreadsheet
A concise, visually segmented Præsidiad PESTLE summary that’s easily editable and shareable for meetings, presentations and cross‑team alignment, helping teams quickly surface external risks and market positioning.
Economic factors
Construction and capex cycles
Perimeter security revenues track construction and industrial capex cycles, with demand softening as utilities, logistics and manufacturing capex slowed in 2024; order intake fell in tandem across project-driven markets. Backlogs, often covering several months of revenue, cushion short-term dips and preserve margins. Diversified end-markets — critical infrastructure, logistics, commercial and industrial customers — stabilize revenue streams despite cyclical variability.
Commodity and input costs
Steel, coatings and electronics experienced double-digit price swings in 2023–24, pressuring margins across the defence supply chain; Præsidiad reports volatility-driven margin compression in recent quarters. Index-linked contracts allow timely pass-through of input inflation, protecting revenue recognition. Active hedging and supplier diversification materially reduce exposure to spot spikes. Design optimisation programmes have cut material intensity in similar OEMs by up to mid-teens, lowering input cost sensitivity.
FX volatility
Global sales and multi-currency sourcing expose Præsidiad to translation and transaction risk—major pairs (eg GBP/USD) swung roughly 20% in 2021–23—compressing margins where currency mismatches occur. Local production and invoicing in local currencies provide natural hedges that materially lower net exposure. Residual risk is managed with forward contracts and FX options; many corporates hedge roughly 60–80% of projected flows.
Supply chain and logistics
Shipping rates fell roughly 80% from 2021 peaks to 2024 (Drewry WCI), while LA vessel queues dropped from 109 ships in Jan 2022 to single digits by 2024, reducing lead-time volatility. Nearshoring (McKinsey) can cut custom-project lead times by up to 50%, enabling faster iteration. Inventory carrying costs remain ~20–30% of value, so just-in-time vs buffer stock tradeoffs and vendor consolidation improving OTIF and reliability drive margin and service outcomes.
- Shipping rates: -80% from 2021 to 2024
- Port congestion: LA queues 109→single digits (2022→2024)
- Nearshoring: lead times -up to 50%
- Inventory cost: ~20–30% annually
- Vendor consolidation: higher OTIF, lower complexity
Interest rates and financing
Rising benchmark rates (US fed funds 5.25–5.50% and ECB deposit ~4.0% in 2024–25) raise customer hurdle rates and push back capex-heavy security projects; leasing or financed solutions (lease rates typically 6–8%) help sustain demand. Higher rates increase working capital costs for large contracts and require stronger balance sheets to win tenders needing 5–10% performance bonds.
- Higher hurdle rates: slower capex
- Leasing sustains demand
- Working capital up: financing strain
- Strong balance sheet wins bonds
Political drivers lift defense & infrastructure demand; world military spend $2.24tn
Perimeter-security demand softened in 2024 with order intake down as utilities and industrial capex slowed, but multi-month backlogs and diversified end-markets preserved revenue. Input-price volatility (steel/coatings/electronics) and ~20% FX swings compressed margins; index-linked contracts and hedging reduced impact. Higher rates (US 5.25–5.50%, ECB ~4.0%) raised hurdle rates; leasing (6–8%) and local production mitigated funding and lead-time risks.
| Metric | 2024/25 |
|---|---|
| US fed funds | 5.25–5.50% |
| ECB deposit | ~4.0% |
| Shipping rates vs 2021 | -80% |
| LA port queues | 109→single digits |
| Inventory cost | 20–30% pa |
| FX swing (major pairs) | ~20% |
| Leasing rates | 6–8% |
Preview Before You Purchase
Præsidiad PESTLE Analysis
The Præsidiad PESTLE Analysis preview shown here is the exact document you’ll receive after purchase—fully formatted, professionally structured, and ready to use. This is a real screenshot of the product you’re buying, delivered exactly as shown. No placeholders or teasers—what you see is the final file available for immediate download after payment.
Original: $10.00
-65%$10.00
$3.50Description
Your Shortcut to Market Insight Starts Here
Gain a strategic edge with our targeted PESTLE Analysis of Præsidiad—three concise sections unpack political, economic, social, technological, legal, and environmental forces shaping its trajectory. These actionable insights are tailored for investors, advisors, and strategists who need fast, reliable intelligence. Purchase the full report to access the complete, editable breakdown and make confident, data-driven decisions.
Political factors
Government security spending
Public budgets for critical infrastructure and border protection strongly drive demand—world military expenditure reached $2.24 trillion in 2023, up 3.7% vs 2022 (SIPRI). Shifts in defense and homeland-security priorities can accelerate or delay contracts, while election cycles and fiscal austerity introduce procurement volatility. Diversifying across geographies mitigates this cyclicality and evens revenue streams.
Public procurement dynamics
Tender rules, local content requirements and anti-corruption clauses sharply shape access to contracts; OECD data show public procurement averages about 12% of GDP in member countries. Long approval timelines reduce revenue visibility for bidders. Framework agreements can create multi-year pipelines—EU rules generally cap them at four years. Building relationships with agencies improves prequalification and award prospects.
Geopolitical risk and instability
Conflict zones and terrorism drive higher perimeter and cyber security spend as firms operating near hotspots face elevated threat vectors; SIPRI reports global military expenditure hit $2.24 trillion in 2023, underscoring persistent instability. Sanctions and trade restrictions can abruptly cut sales or partners, raising compliance costs. Project execution risk climbs in fragile states, so robust risk assessment and political risk insurance are essential.
Trade policy and tariffs
Tariffs on steel (25%) and aluminum (10%) under US Section 232 raise input costs for Præsidiad’s hardware and finished-goods lines, increasing margins pressure.
Regional trade agreements like USMCA (effective 2020) and CPTPP (11 members) reshape sourcing and pricing by altering duty schedules and rules of origin.
Customs delays cause multi-day delivery disruptions and inventory buildup; localizing production in key markets reduces tariff exposure and cross-border risk.
- Tariffs: steel 25%, aluminum 10%
- Agreements: USMCA effective 2020; CPTPP 11 members
- Risk: multi-day customs delays
- Mitigation: localize production to cut tariffs
Infrastructure policy and funding
Infrastructure policy and funding drive national resilience programs that unlock projects—e.g., the US $1.2 trillion Bipartisan Infrastructure Law and the EU Recovery and Resilience Facility (€723.8bn) channel capital into utilities, transport and border security; public–private partnerships increasingly finance large installations, de‑risking upfront fiscal burden; tracking policy pipelines enables capacity planning and bid timing.
- Policy drivers: national resilience programs
- Key funds: US $1.2tn, EU €723.8bn
- Financing: PPPs for capex
- Action: track pipelines for capacity planning
Political drivers lift defense & infrastructure demand; world military spend $2.24tn
Political drivers—defense budgets, procurement rules, tariffs and infrastructure policy—shape demand, margins and access; world military expenditure was $2.24tn in 2023 (SIPRI) and public procurement averages ~12% of GDP (OECD). Tariffs (US steel 25%, aluminum 10%) raise input costs; US $1.2tn Bipartisan Infrastructure Law and EU €723.8bn Recovery Facility create project pipelines requiring local content and long approval timelines.
| Item | Value | Impact |
|---|---|---|
| World military spend (2023) | $2.24tn | ↑ Defence demand |
| Public procurement (OECD) | ~12% GDP | Contract scale |
| US tariffs | Steel 25% / Al 10% | Input cost pressure |
| Infrastructure funds | US $1.2tn / EU €723.8bn | Project pipeline |
What is included in the product
Detailed Word Document
Explores how external macro-environmental factors uniquely affect the Præsidiad across Political, Economic, Social, Technological, Environmental, and Legal dimensions, with data-backed subpoints and forward-looking insights tailored to its region and industry to guide executives, investors, and strategists.
Customizable Excel Spreadsheet
A concise, visually segmented Præsidiad PESTLE summary that’s easily editable and shareable for meetings, presentations and cross‑team alignment, helping teams quickly surface external risks and market positioning.
Economic factors
Construction and capex cycles
Perimeter security revenues track construction and industrial capex cycles, with demand softening as utilities, logistics and manufacturing capex slowed in 2024; order intake fell in tandem across project-driven markets. Backlogs, often covering several months of revenue, cushion short-term dips and preserve margins. Diversified end-markets — critical infrastructure, logistics, commercial and industrial customers — stabilize revenue streams despite cyclical variability.
Commodity and input costs
Steel, coatings and electronics experienced double-digit price swings in 2023–24, pressuring margins across the defence supply chain; Præsidiad reports volatility-driven margin compression in recent quarters. Index-linked contracts allow timely pass-through of input inflation, protecting revenue recognition. Active hedging and supplier diversification materially reduce exposure to spot spikes. Design optimisation programmes have cut material intensity in similar OEMs by up to mid-teens, lowering input cost sensitivity.
FX volatility
Global sales and multi-currency sourcing expose Præsidiad to translation and transaction risk—major pairs (eg GBP/USD) swung roughly 20% in 2021–23—compressing margins where currency mismatches occur. Local production and invoicing in local currencies provide natural hedges that materially lower net exposure. Residual risk is managed with forward contracts and FX options; many corporates hedge roughly 60–80% of projected flows.
Supply chain and logistics
Shipping rates fell roughly 80% from 2021 peaks to 2024 (Drewry WCI), while LA vessel queues dropped from 109 ships in Jan 2022 to single digits by 2024, reducing lead-time volatility. Nearshoring (McKinsey) can cut custom-project lead times by up to 50%, enabling faster iteration. Inventory carrying costs remain ~20–30% of value, so just-in-time vs buffer stock tradeoffs and vendor consolidation improving OTIF and reliability drive margin and service outcomes.
- Shipping rates: -80% from 2021 to 2024
- Port congestion: LA queues 109→single digits (2022→2024)
- Nearshoring: lead times -up to 50%
- Inventory cost: ~20–30% annually
- Vendor consolidation: higher OTIF, lower complexity
Interest rates and financing
Rising benchmark rates (US fed funds 5.25–5.50% and ECB deposit ~4.0% in 2024–25) raise customer hurdle rates and push back capex-heavy security projects; leasing or financed solutions (lease rates typically 6–8%) help sustain demand. Higher rates increase working capital costs for large contracts and require stronger balance sheets to win tenders needing 5–10% performance bonds.
- Higher hurdle rates: slower capex
- Leasing sustains demand
- Working capital up: financing strain
- Strong balance sheet wins bonds
Political drivers lift defense & infrastructure demand; world military spend $2.24tn
Perimeter-security demand softened in 2024 with order intake down as utilities and industrial capex slowed, but multi-month backlogs and diversified end-markets preserved revenue. Input-price volatility (steel/coatings/electronics) and ~20% FX swings compressed margins; index-linked contracts and hedging reduced impact. Higher rates (US 5.25–5.50%, ECB ~4.0%) raised hurdle rates; leasing (6–8%) and local production mitigated funding and lead-time risks.
| Metric | 2024/25 |
|---|---|
| US fed funds | 5.25–5.50% |
| ECB deposit | ~4.0% |
| Shipping rates vs 2021 | -80% |
| LA port queues | 109→single digits |
| Inventory cost | 20–30% pa |
| FX swing (major pairs) | ~20% |
| Leasing rates | 6–8% |
Preview Before You Purchase
Præsidiad PESTLE Analysis
The Præsidiad PESTLE Analysis preview shown here is the exact document you’ll receive after purchase—fully formatted, professionally structured, and ready to use. This is a real screenshot of the product you’re buying, delivered exactly as shown. No placeholders or teasers—what you see is the final file available for immediate download after payment.











