Precision PESTLE Analysis

Skip the Research. Get the Strategy.
Gain a strategic advantage with our Precision PESTLE Analysis—concise, evidence-based insights into political, economic, social, technological, legal, and environmental forces shaping Precision. Perfect for investors, consultants, and planners. Ready-to-use and fully editable. Buy the full report for the complete deep-dive and actionable recommendations.
Political factors

Energy policy shifts
Government priorities toward hydrocarbons versus renewables directly influence drilling demand and permitting velocity; the US remains the world s top producer at over 11 million barrels per day, while Alberta supplies the majority of Canadian oil output.
Pro-drilling provincial and state policies in Alberta, Texas and select US states can accelerate activity, even as federal decarbonization targets—US 50-52% GHG reduction by 2030 and Canada s 40-45%—temper long-term outlooks.
Precision must adapt fleet allocation to jurisdictions with stable, supportive regimes to protect utilization and margins.
Strategic monitoring of policy cycles and permit backlogs helps smooth utilization volatility and capture short-term demand spikes.
Permitting and approvals
Lengthy or uncertain drilling and environmental approvals routinely delay rig mobilization by 3–12 months, deferring revenue recognition and increasing holding costs. Streamlined regional processes can shorten spud-to-spud cycles by up to 20%, materially improving dayrate capture. Precision benefits from standardized compliance playbooks to navigate multi-jurisdictional requirements; bottlenecks create scheduling risk and idle time that erode margins.

Indigenous and local stakeholder relations
Projects in Canada and parts of the U.S. intersect Indigenous rights and local community interests; Indigenous peoples were 5% of Canada’s population in the 2021 census and U.S. tribal lands encompass about 56 million acres (BIA). Constructive agreements can secure access, reduce protest risk, and improve timelines. Precision’s community engagement and procurement from local partners support operational continuity. Poor alignment can trigger political pushback and project pauses.

Geopolitics and trade
Geopolitics and trade shape equipment movement and parts sourcing: USMCA keeps U.S.-Canada trade stable for Precision’s core markets, while export controls (notably 2022–23 U.S. chip and tech restrictions) and ongoing steel tariffs (Section 232 measures since 2018) raise upgrade costs and compliance burdens; international expansion typically requires country-risk premiums (commonly 200–600 bps) to price in sanctions and supply-chain disruption.
- Sanctions & export controls: raise compliance costs and delay shipments
- USMCA stability: underpins core market access
- Steel tariffs & tech controls: increase capital upgrade costs
- Diversified sourcing: mitigates supply shocks and country risk
Fiscal regimes and incentives
Fiscal regimes and incentives materially shape rig upgrade economics: US 45Q/IRA CCUS credits (final rules set full value up to about 85 USD/tCO2 for geologic storage) and methane abatement incentives accelerate demand for lower-emission rigs, while changes to royalties and windfall taxes shift E&P capex and rig procurement. Canada's federal carbon pricing (federal backstop) and rising carbon costs alter operating cost profiles, so Precision can align offerings with incentive-driven customer programs.
- 45Q CCUS credits ~85 USD/tCO2
- Carbon pricing: Canada federal schedule rising toward 2030
- Royalty/windfall changes affect E&P capex → rig demand
- Precision alignment with incentive programs increases win probability
Policy, permitting and 45Q incentives shift rigs to low-emission drilling as US output >11 mbpd
Government energy stance and permitting pace drive drilling demand; US production >11 mbpd and Alberta supplies most Canadian oil. Decarbonization targets (US 50–52% by 2030; Canada 40–45%) plus 45Q ≈85 USD/tCO2 push low‑emission rigs. Trade stability (USMCA) aids access; tariffs/export controls raise upgrade costs and delays.
| Factor | Metric | Implication |
|---|---|---|
| Production | US >11 mbpd | High short-term rig demand |
| Policy | US 50–52% / CA 40–45% | Shift to cleaner fleet |
What is included in the product
 Detailed Word Document
Precision PESTLE analyzes how Political, Economic, Social, Technological, Environmental, and Legal forces uniquely affect the Precision, pairing data-driven trends and region-specific regulation with forward-looking scenarios to identify risks, opportunities, and strategic actions for executives, investors, and entrepreneurs.

 Customizable Excel Spreadsheet
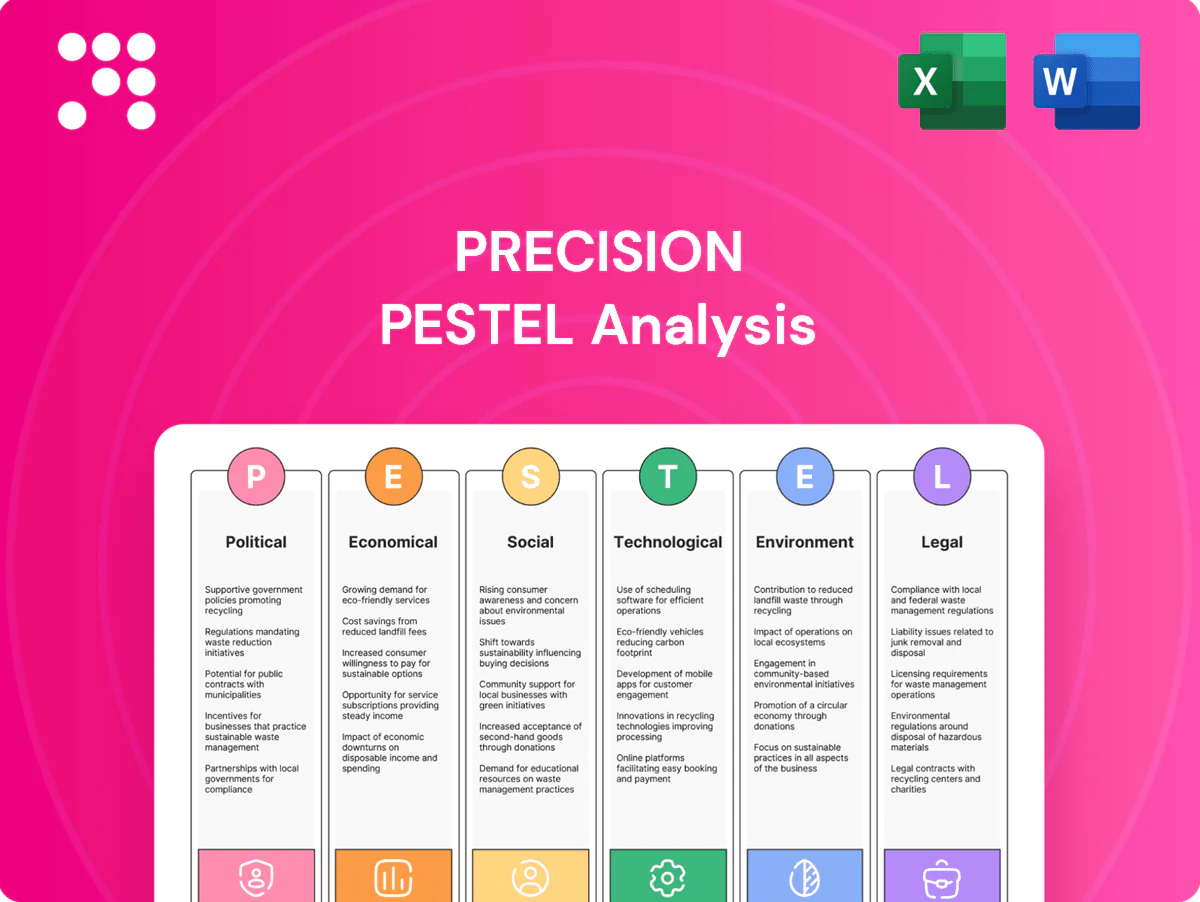
Precision PESTLE delivers a clean, visually segmented summary of external factors that’s editable for local context and easily dropped into presentations, enabling fast cross-team alignment and focused risk discussions in planning sessions.
Economic factors

Oil and gas price cycles
WTI near US$78/bbl (June 2025), WCS ~US$60–65/bbl (≈US$13–18 discount) and Henry Hub ~US$3.00/MMBtu drive E&P cash flows and drilling plans; upcycles tighten rig supply, lift dayrates and extend contract tenors while downcycles depress utilization. Precision remains highly earnings-sensitive to commodity swings despite term contracts; hedging and cost agility materially buffer troughs.
Customer capex discipline
E&Ps prioritized free cash flow and shareholder returns, returning over $150bn across 2023–24 and moderating drilling growth even as oil averaged near $80–90/bbl in 2024. Multi-year capex guidance from majors tightened rig-count visibility, with the Baker Hughes US rig count averaging ~520 in 2024, supporting contractors' pricing power. Precision benefits from demand for high-spec rigs that meet efficiency mandates, and long-term contracts blunt spot-market volatility.

Inflation and input costs
Steel, fuel and spare-parts inflation — with hot-rolled coil averaging around $700/ton in 2024 and Brent near $84/barrel — compresses margins if dayrates lag market moves.
Wage pressure for skilled crews rose roughly 6% in 2024, raising operating costs and turnover risk for specialized fleets.
Index-linked contracts and fuel surcharges, used by over half of major owners, protect cashflow; strategic supply-chain partnerships cut lead-time volatility and stabilize pricing.

Interest rates and currency
Higher policy rates (Bank of Canada ~5.00%, US Fed ~5.25% in mid-2025) raise financing costs for fleet upgrades and refinancing; a 100 bps move can add materially to capex servicing. CAD/USD around 1.34–1.36 in 2025 affects translated earnings and cross-border competitiveness; customers facing higher cost of capital trim drilling budgets and long-term contracts. Prudent leverage and currency hedges enhance resilience.
- Rates: BoC ~5.00%, Fed ~5.25% (mid-2025)
- FX: USD/CAD ~1.34–1.36 — impacts translation and pricing
- Demand: higher client cost of capital tightens drilling spend
- Mitigation: conservative leverage + hedges
Utilization and mix
Fleet utilization and the share of Super Series high-spec rigs drive revenue per day and margins: Super Series rigs commanded roughly 30% higher dayrates in 2024, supporting margin expansion; pad drilling and longer laterals (US average laterals ~9,500 ft in 2024) favor high-performance rigs with premium pricing. Optimized fleet stacking and targeted reactivations protect average dayrates, and mix management remains the key lever in cyclic conditions, where a 10-15% shift in high-spec mix can move EBITDA by ~250 basis points.
- Super Series premium ~30%
- Avg lateral length ~9,500 ft (2024)
- Pad drilling majority of activity
- 10-15% mix shift → ~250 bps EBITDA impact
Policy, permitting and 45Q incentives shift rigs to low-emission drilling as US output >11 mbpd
Higher oil (WTI ~78–80/bbl mid-2025) and gas (HH ~3.00/MMBtu) lift E&P cashflows, boosting demand for high-spec rigs; rates (Fed ~5.25%, BoC ~5.00%) and USD/CAD ~1.34–1.36 raise financing and translation costs, while steel ~$700/ton and wage inflation (~6%) compress margins; hedges, index-linked clauses and fleet mix (Super premium ~30%) mitigate downside.
| Metric | Mid-2025 |
|---|---|
| WTI | ~78–80$/bbl |
| Henry Hub | ~3.00$/MMBtu |
| Fed/BoC | 5.25% / 5.00% |
| USD/CAD | 1.34–1.36 |
| Steel (HRC) | ~700$/ton |
| Wage inflation | ~6% |
What You See Is What You Get
Precision PESTLE Analysis
The preview shown here is the exact Precision PESTLE Analysis you’ll receive after purchase—fully formatted, professionally structured, and ready to use. This is the real file, delivered exactly as displayed with no placeholders or surprises. Download access is immediate after checkout.

Skip the Research. Get the Strategy.
Gain a strategic advantage with our Precision PESTLE Analysis—concise, evidence-based insights into political, economic, social, technological, legal, and environmental forces shaping Precision. Perfect for investors, consultants, and planners. Ready-to-use and fully editable. Buy the full report for the complete deep-dive and actionable recommendations.
Political factors
Energy policy shifts
Government priorities toward hydrocarbons versus renewables directly influence drilling demand and permitting velocity; the US remains the world s top producer at over 11 million barrels per day, while Alberta supplies the majority of Canadian oil output.
Pro-drilling provincial and state policies in Alberta, Texas and select US states can accelerate activity, even as federal decarbonization targets—US 50-52% GHG reduction by 2030 and Canada s 40-45%—temper long-term outlooks.
Precision must adapt fleet allocation to jurisdictions with stable, supportive regimes to protect utilization and margins.
Strategic monitoring of policy cycles and permit backlogs helps smooth utilization volatility and capture short-term demand spikes.
Permitting and approvals
Lengthy or uncertain drilling and environmental approvals routinely delay rig mobilization by 3–12 months, deferring revenue recognition and increasing holding costs. Streamlined regional processes can shorten spud-to-spud cycles by up to 20%, materially improving dayrate capture. Precision benefits from standardized compliance playbooks to navigate multi-jurisdictional requirements; bottlenecks create scheduling risk and idle time that erode margins.
Indigenous and local stakeholder relations
Projects in Canada and parts of the U.S. intersect Indigenous rights and local community interests; Indigenous peoples were 5% of Canada’s population in the 2021 census and U.S. tribal lands encompass about 56 million acres (BIA). Constructive agreements can secure access, reduce protest risk, and improve timelines. Precision’s community engagement and procurement from local partners support operational continuity. Poor alignment can trigger political pushback and project pauses.
Geopolitics and trade
Geopolitics and trade shape equipment movement and parts sourcing: USMCA keeps U.S.-Canada trade stable for Precision’s core markets, while export controls (notably 2022–23 U.S. chip and tech restrictions) and ongoing steel tariffs (Section 232 measures since 2018) raise upgrade costs and compliance burdens; international expansion typically requires country-risk premiums (commonly 200–600 bps) to price in sanctions and supply-chain disruption.
- Sanctions & export controls: raise compliance costs and delay shipments
- USMCA stability: underpins core market access
- Steel tariffs & tech controls: increase capital upgrade costs
- Diversified sourcing: mitigates supply shocks and country risk
Fiscal regimes and incentives
Fiscal regimes and incentives materially shape rig upgrade economics: US 45Q/IRA CCUS credits (final rules set full value up to about 85 USD/tCO2 for geologic storage) and methane abatement incentives accelerate demand for lower-emission rigs, while changes to royalties and windfall taxes shift E&P capex and rig procurement. Canada's federal carbon pricing (federal backstop) and rising carbon costs alter operating cost profiles, so Precision can align offerings with incentive-driven customer programs.
- 45Q CCUS credits ~85 USD/tCO2
- Carbon pricing: Canada federal schedule rising toward 2030
- Royalty/windfall changes affect E&P capex → rig demand
- Precision alignment with incentive programs increases win probability
Policy, permitting and 45Q incentives shift rigs to low-emission drilling as US output >11 mbpd
Government energy stance and permitting pace drive drilling demand; US production >11 mbpd and Alberta supplies most Canadian oil. Decarbonization targets (US 50–52% by 2030; Canada 40–45%) plus 45Q ≈85 USD/tCO2 push low‑emission rigs. Trade stability (USMCA) aids access; tariffs/export controls raise upgrade costs and delays.
| Factor | Metric | Implication |
|---|---|---|
| Production | US >11 mbpd | High short-term rig demand |
| Policy | US 50–52% / CA 40–45% | Shift to cleaner fleet |
What is included in the product
Detailed Word Document
Precision PESTLE analyzes how Political, Economic, Social, Technological, Environmental, and Legal forces uniquely affect the Precision, pairing data-driven trends and region-specific regulation with forward-looking scenarios to identify risks, opportunities, and strategic actions for executives, investors, and entrepreneurs.
Customizable Excel Spreadsheet
Precision PESTLE delivers a clean, visually segmented summary of external factors that’s editable for local context and easily dropped into presentations, enabling fast cross-team alignment and focused risk discussions in planning sessions.
Economic factors
Oil and gas price cycles
WTI near US$78/bbl (June 2025), WCS ~US$60–65/bbl (≈US$13–18 discount) and Henry Hub ~US$3.00/MMBtu drive E&P cash flows and drilling plans; upcycles tighten rig supply, lift dayrates and extend contract tenors while downcycles depress utilization. Precision remains highly earnings-sensitive to commodity swings despite term contracts; hedging and cost agility materially buffer troughs.
Customer capex discipline
E&Ps prioritized free cash flow and shareholder returns, returning over $150bn across 2023–24 and moderating drilling growth even as oil averaged near $80–90/bbl in 2024. Multi-year capex guidance from majors tightened rig-count visibility, with the Baker Hughes US rig count averaging ~520 in 2024, supporting contractors' pricing power. Precision benefits from demand for high-spec rigs that meet efficiency mandates, and long-term contracts blunt spot-market volatility.
Inflation and input costs
Steel, fuel and spare-parts inflation — with hot-rolled coil averaging around $700/ton in 2024 and Brent near $84/barrel — compresses margins if dayrates lag market moves.
Wage pressure for skilled crews rose roughly 6% in 2024, raising operating costs and turnover risk for specialized fleets.
Index-linked contracts and fuel surcharges, used by over half of major owners, protect cashflow; strategic supply-chain partnerships cut lead-time volatility and stabilize pricing.
Interest rates and currency
Higher policy rates (Bank of Canada ~5.00%, US Fed ~5.25% in mid-2025) raise financing costs for fleet upgrades and refinancing; a 100 bps move can add materially to capex servicing. CAD/USD around 1.34–1.36 in 2025 affects translated earnings and cross-border competitiveness; customers facing higher cost of capital trim drilling budgets and long-term contracts. Prudent leverage and currency hedges enhance resilience.
- Rates: BoC ~5.00%, Fed ~5.25% (mid-2025)
- FX: USD/CAD ~1.34–1.36 — impacts translation and pricing
- Demand: higher client cost of capital tightens drilling spend
- Mitigation: conservative leverage + hedges
Utilization and mix
Fleet utilization and the share of Super Series high-spec rigs drive revenue per day and margins: Super Series rigs commanded roughly 30% higher dayrates in 2024, supporting margin expansion; pad drilling and longer laterals (US average laterals ~9,500 ft in 2024) favor high-performance rigs with premium pricing. Optimized fleet stacking and targeted reactivations protect average dayrates, and mix management remains the key lever in cyclic conditions, where a 10-15% shift in high-spec mix can move EBITDA by ~250 basis points.
- Super Series premium ~30%
- Avg lateral length ~9,500 ft (2024)
- Pad drilling majority of activity
- 10-15% mix shift → ~250 bps EBITDA impact
Policy, permitting and 45Q incentives shift rigs to low-emission drilling as US output >11 mbpd
Higher oil (WTI ~78–80/bbl mid-2025) and gas (HH ~3.00/MMBtu) lift E&P cashflows, boosting demand for high-spec rigs; rates (Fed ~5.25%, BoC ~5.00%) and USD/CAD ~1.34–1.36 raise financing and translation costs, while steel ~$700/ton and wage inflation (~6%) compress margins; hedges, index-linked clauses and fleet mix (Super premium ~30%) mitigate downside.
| Metric | Mid-2025 |
|---|---|
| WTI | ~78–80$/bbl |
| Henry Hub | ~3.00$/MMBtu |
| Fed/BoC | 5.25% / 5.00% |
| USD/CAD | 1.34–1.36 |
| Steel (HRC) | ~700$/ton |
| Wage inflation | ~6% |
What You See Is What You Get
Precision PESTLE Analysis
The preview shown here is the exact Precision PESTLE Analysis you’ll receive after purchase—fully formatted, professionally structured, and ready to use. This is the real file, delivered exactly as displayed with no placeholders or surprises. Download access is immediate after checkout.
Original: $10.00
-65%$10.00
$3.50Description
Skip the Research. Get the Strategy.
Gain a strategic advantage with our Precision PESTLE Analysis—concise, evidence-based insights into political, economic, social, technological, legal, and environmental forces shaping Precision. Perfect for investors, consultants, and planners. Ready-to-use and fully editable. Buy the full report for the complete deep-dive and actionable recommendations.
Political factors
Energy policy shifts
Government priorities toward hydrocarbons versus renewables directly influence drilling demand and permitting velocity; the US remains the world s top producer at over 11 million barrels per day, while Alberta supplies the majority of Canadian oil output.
Pro-drilling provincial and state policies in Alberta, Texas and select US states can accelerate activity, even as federal decarbonization targets—US 50-52% GHG reduction by 2030 and Canada s 40-45%—temper long-term outlooks.
Precision must adapt fleet allocation to jurisdictions with stable, supportive regimes to protect utilization and margins.
Strategic monitoring of policy cycles and permit backlogs helps smooth utilization volatility and capture short-term demand spikes.
Permitting and approvals
Lengthy or uncertain drilling and environmental approvals routinely delay rig mobilization by 3–12 months, deferring revenue recognition and increasing holding costs. Streamlined regional processes can shorten spud-to-spud cycles by up to 20%, materially improving dayrate capture. Precision benefits from standardized compliance playbooks to navigate multi-jurisdictional requirements; bottlenecks create scheduling risk and idle time that erode margins.
Indigenous and local stakeholder relations
Projects in Canada and parts of the U.S. intersect Indigenous rights and local community interests; Indigenous peoples were 5% of Canada’s population in the 2021 census and U.S. tribal lands encompass about 56 million acres (BIA). Constructive agreements can secure access, reduce protest risk, and improve timelines. Precision’s community engagement and procurement from local partners support operational continuity. Poor alignment can trigger political pushback and project pauses.
Geopolitics and trade
Geopolitics and trade shape equipment movement and parts sourcing: USMCA keeps U.S.-Canada trade stable for Precision’s core markets, while export controls (notably 2022–23 U.S. chip and tech restrictions) and ongoing steel tariffs (Section 232 measures since 2018) raise upgrade costs and compliance burdens; international expansion typically requires country-risk premiums (commonly 200–600 bps) to price in sanctions and supply-chain disruption.
- Sanctions & export controls: raise compliance costs and delay shipments
- USMCA stability: underpins core market access
- Steel tariffs & tech controls: increase capital upgrade costs
- Diversified sourcing: mitigates supply shocks and country risk
Fiscal regimes and incentives
Fiscal regimes and incentives materially shape rig upgrade economics: US 45Q/IRA CCUS credits (final rules set full value up to about 85 USD/tCO2 for geologic storage) and methane abatement incentives accelerate demand for lower-emission rigs, while changes to royalties and windfall taxes shift E&P capex and rig procurement. Canada's federal carbon pricing (federal backstop) and rising carbon costs alter operating cost profiles, so Precision can align offerings with incentive-driven customer programs.
- 45Q CCUS credits ~85 USD/tCO2
- Carbon pricing: Canada federal schedule rising toward 2030
- Royalty/windfall changes affect E&P capex → rig demand
- Precision alignment with incentive programs increases win probability
Policy, permitting and 45Q incentives shift rigs to low-emission drilling as US output >11 mbpd
Government energy stance and permitting pace drive drilling demand; US production >11 mbpd and Alberta supplies most Canadian oil. Decarbonization targets (US 50–52% by 2030; Canada 40–45%) plus 45Q ≈85 USD/tCO2 push low‑emission rigs. Trade stability (USMCA) aids access; tariffs/export controls raise upgrade costs and delays.
| Factor | Metric | Implication |
|---|---|---|
| Production | US >11 mbpd | High short-term rig demand |
| Policy | US 50–52% / CA 40–45% | Shift to cleaner fleet |
What is included in the product
Detailed Word Document
Precision PESTLE analyzes how Political, Economic, Social, Technological, Environmental, and Legal forces uniquely affect the Precision, pairing data-driven trends and region-specific regulation with forward-looking scenarios to identify risks, opportunities, and strategic actions for executives, investors, and entrepreneurs.
Customizable Excel Spreadsheet
Precision PESTLE delivers a clean, visually segmented summary of external factors that’s editable for local context and easily dropped into presentations, enabling fast cross-team alignment and focused risk discussions in planning sessions.
Economic factors
Oil and gas price cycles
WTI near US$78/bbl (June 2025), WCS ~US$60–65/bbl (≈US$13–18 discount) and Henry Hub ~US$3.00/MMBtu drive E&P cash flows and drilling plans; upcycles tighten rig supply, lift dayrates and extend contract tenors while downcycles depress utilization. Precision remains highly earnings-sensitive to commodity swings despite term contracts; hedging and cost agility materially buffer troughs.
Customer capex discipline
E&Ps prioritized free cash flow and shareholder returns, returning over $150bn across 2023–24 and moderating drilling growth even as oil averaged near $80–90/bbl in 2024. Multi-year capex guidance from majors tightened rig-count visibility, with the Baker Hughes US rig count averaging ~520 in 2024, supporting contractors' pricing power. Precision benefits from demand for high-spec rigs that meet efficiency mandates, and long-term contracts blunt spot-market volatility.
Inflation and input costs
Steel, fuel and spare-parts inflation — with hot-rolled coil averaging around $700/ton in 2024 and Brent near $84/barrel — compresses margins if dayrates lag market moves.
Wage pressure for skilled crews rose roughly 6% in 2024, raising operating costs and turnover risk for specialized fleets.
Index-linked contracts and fuel surcharges, used by over half of major owners, protect cashflow; strategic supply-chain partnerships cut lead-time volatility and stabilize pricing.
Interest rates and currency
Higher policy rates (Bank of Canada ~5.00%, US Fed ~5.25% in mid-2025) raise financing costs for fleet upgrades and refinancing; a 100 bps move can add materially to capex servicing. CAD/USD around 1.34–1.36 in 2025 affects translated earnings and cross-border competitiveness; customers facing higher cost of capital trim drilling budgets and long-term contracts. Prudent leverage and currency hedges enhance resilience.
- Rates: BoC ~5.00%, Fed ~5.25% (mid-2025)
- FX: USD/CAD ~1.34–1.36 — impacts translation and pricing
- Demand: higher client cost of capital tightens drilling spend
- Mitigation: conservative leverage + hedges
Utilization and mix
Fleet utilization and the share of Super Series high-spec rigs drive revenue per day and margins: Super Series rigs commanded roughly 30% higher dayrates in 2024, supporting margin expansion; pad drilling and longer laterals (US average laterals ~9,500 ft in 2024) favor high-performance rigs with premium pricing. Optimized fleet stacking and targeted reactivations protect average dayrates, and mix management remains the key lever in cyclic conditions, where a 10-15% shift in high-spec mix can move EBITDA by ~250 basis points.
- Super Series premium ~30%
- Avg lateral length ~9,500 ft (2024)
- Pad drilling majority of activity
- 10-15% mix shift → ~250 bps EBITDA impact
Policy, permitting and 45Q incentives shift rigs to low-emission drilling as US output >11 mbpd
Higher oil (WTI ~78–80/bbl mid-2025) and gas (HH ~3.00/MMBtu) lift E&P cashflows, boosting demand for high-spec rigs; rates (Fed ~5.25%, BoC ~5.00%) and USD/CAD ~1.34–1.36 raise financing and translation costs, while steel ~$700/ton and wage inflation (~6%) compress margins; hedges, index-linked clauses and fleet mix (Super premium ~30%) mitigate downside.
| Metric | Mid-2025 |
|---|---|
| WTI | ~78–80$/bbl |
| Henry Hub | ~3.00$/MMBtu |
| Fed/BoC | 5.25% / 5.00% |
| USD/CAD | 1.34–1.36 |
| Steel (HRC) | ~700$/ton |
| Wage inflation | ~6% |
What You See Is What You Get
Precision PESTLE Analysis
The preview shown here is the exact Precision PESTLE Analysis you’ll receive after purchase—fully formatted, professionally structured, and ready to use. This is the real file, delivered exactly as displayed with no placeholders or surprises. Download access is immediate after checkout.











