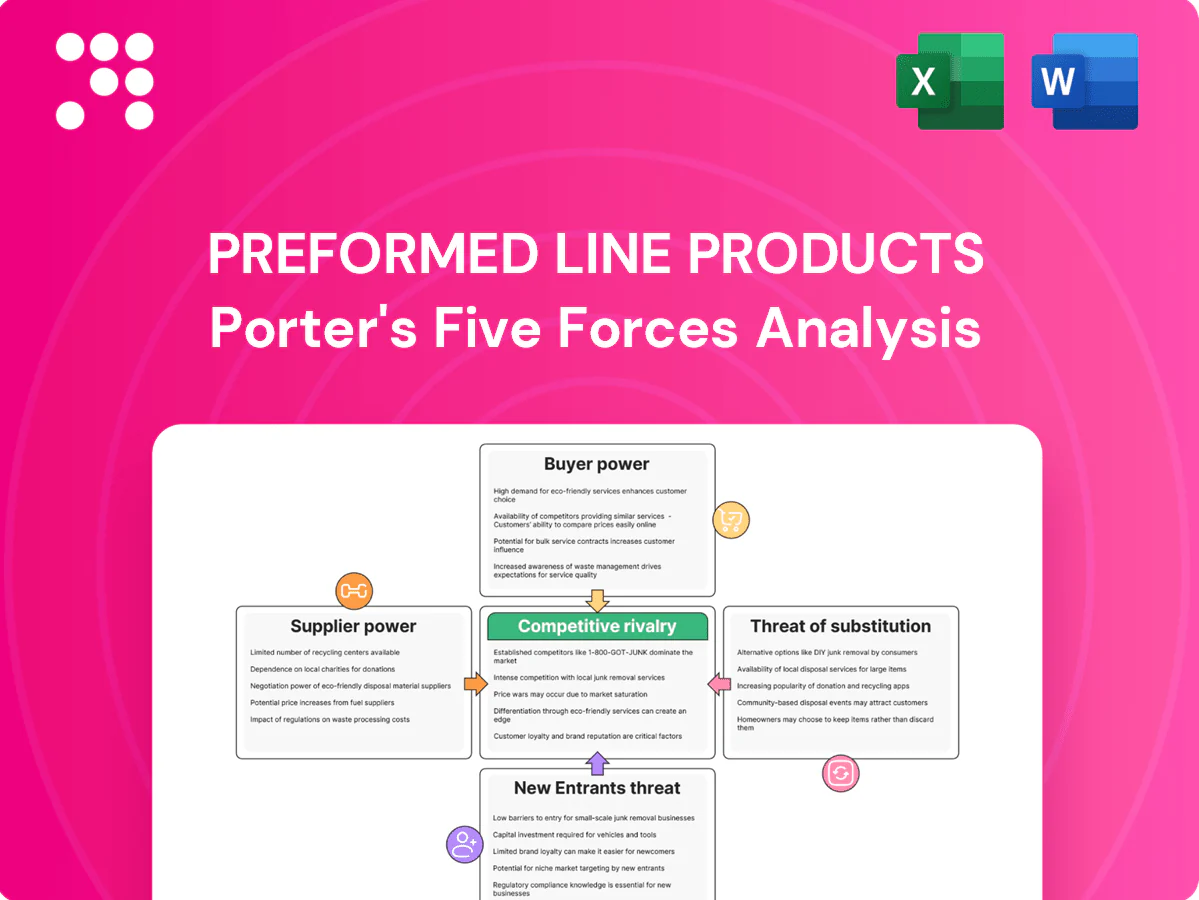
Preformed Line Products Porter's Five Forces Analysis

Go Beyond the Preview—Access the Full Strategic Report
This snapshot highlights Preformed Line Products’ competitive pressures—from supplier influence to substitute threats—and outlines strategic implications. The full Porter's Five Forces Analysis uncovers force-by-force ratings, visuals, and market intelligence to validate opportunities and risks. Gain actionable insights to refine strategy or investment decisions. Unlock the complete report for a consultant-grade breakdown tailored to Preformed Line Products.
Suppliers Bargaining Power

Concentrated metals and polymers sources
PLP depends on concentrated sources of steel, aluminum, specialty alloys and engineered polymers, and this supplier concentration heightens leverage during tight commodity cycles observed in 2024. Long-term contracts and multi-sourcing reduce acute price spikes, but qualifying new mills or compounding houses can take many months. Commodity hedging and inventory buffers provide partial protection yet cannot fully neutralize raw-material volatility.
Specification-driven material requirements
Utility and telecom standards such as ASTM and IEC mandate precise mechanical and corrosion properties, narrowing acceptable raw-material inputs and components. Fewer suppliers meet those specifications and pass utility audits, giving qualified vendors outsized bargaining power over price and lead times. Requalification of new inputs typically takes 6–12 months and can cost $100,000–$500,000, making changes slow and costly. This effectively locks Preformed Line Products into approved vendors for safety-critical parts.

Switching costs and tooling dependencies
Custom dies, molds, and coatings tie PLP to specific suppliers, with tooling and recertification often exceeding $200,000 and adding 12–24 weeks to changeovers, increasing supplier leverage on price and lead time. Such switching costs and redesign needs raise effective supplier bargaining power versus PLP, whose 2024 revenue was reported at $546.4 million, amplifying the impact on margins. Dual-tooling can cut lead-time risk but typically doubles upfront tooling expense and only partially mitigates dependency.

Logistics and geopolitical exposure
Global metals and chemicals supply chains remain exposed to freight rates, sanctions and export controls, with 2024 container rates roughly 20% above 2019 levels, amplifying supplier leverage and scarcity premiums during disruptions. Regionalizing sources and holding 3–6 months of safety stock can blunt shocks, but expedited logistics and duties still pass extra costs to PLP, squeezing margins.
- Higher freight/surcharges → greater supplier pricing power
- 3–6 months safety stock reduces disruption risk
- Regional sourcing lowers exposure but raises unit costs
Potential for limited backward integration
PLP’s competitive position relies on design and assembly rather than primary metalmaking or polymer production, limiting realistic backward integration and capping supplier leverage; FY2024 revenue was about $730 million, keeping scale below major raw-material producers.
- Core focus: design/assembly, not commodities
- Backward integration limited by capital intensity
- Selective insourcing for niche machining/coating
- Full vertical integration would require >$100M capex risk
Supplier concentration and tooling squeeze margins; container rates +20%
Supplier concentration in steel, aluminum, alloys and engineered polymers gives vendors outsized leverage during 2024 commodity tightness, raising price and lead‑time risk. High requalification and tooling costs (requalification 6–12 months, $100k–$500k; tooling >$200k, 12–24 weeks) and 20% higher 2024 container rates versus 2019 lock PLP into approved suppliers, squeezing margins despite 3–6 months safety stock. FY2024 revenue ~ $730M.
| Metric | Value |
|---|---|
| Requalification time/cost | 6–12 months / $100k–$500k |
| Tooling | >$200k / 12–24 weeks |
| Safety stock | 3–6 months |
| Container rates (vs 2019) | +20% |
| FY2024 revenue | $730M |
What is included in the product
 Detailed Word Document
Tailored Porter's Five Forces analysis for Preformed Line Products that uncovers key competitive drivers, supplier and buyer power, and market entry barriers influencing pricing and profitability. Identifies disruptive substitutes and emerging threats while offering strategic insights for investor materials, internal strategy decks, or academic use.

 Customizable Excel Spreadsheet
One-sheet Porter’s Five Forces for Preformed Line Products — quickly visualize competitive pressure, supplier power, and substitution risk with editable ratings and a radar chart, ready to drop into decks or integrate with dashboards.
Customers Bargaining Power

Large utility and telecom buyers
Major IOUs, telcos and MSOs buy PLP products in volume and run competitive tenders, with multi-year framework deals often worth tens to hundreds of millions of dollars, enabling aggressive price and service-level demands. Their scale forces compression of supplier margins while providing PLP with volume visibility. PLP must balance lower pricing against a reliability premium tied to outage reduction and lifecycle performance.
Standards, approvals, and vendor lists
Customers mandate approved vendor lists and rigorous testing for Preformed Line Products (PLPC), making specification a key entry barrier; being on AVLs reduces churn but gives buyers leverage to extract concessions at renewal. Losing PLPC approval can shut out utility and telecom business for years, so continuous compliance, certifications, and traceable documentation are essential bargaining chips.

Project-based and seasonal demand
Project-based and seasonal demand—driven by build cycles, storm hardening and the $42.45B BEAD broadband program—creates lumpy orders that let buyers use timing pressure to extract discounts and expedited delivery. PLP’s global footprint and inventory programs help smooth peaks and shorten lead times, but idle-capacity risk in slow periods can shift bargaining power back to customers.

Low switching costs once qualified alternatives exist
When utilities and contractors hold multiple approved suppliers, switching at rebid can be swift and price often outranks proven reliability; PLP responds by emphasizing lifecycle cost analyses, documented performance metrics, and robust field support to justify premium pricing and maintain share.
Distributor and EPC bargaining dynamics
Distributors and EPCs aggregate demand and shape specs, seeking rebates, extended credit and logistics support; PLP's 2024 filings state distributors/EPCs represent the majority of net sales, raising their negotiating leverage as consolidation accelerates.
- Demand aggregation
- Rebates & credit pressure
- Consolidation increases leverage
- VMI and co-planning deepen ties
IOU/telco multi-year tenders squeeze PLP margins; BEAD $42.45B drives buyer leverage
Large IOUs, telcos and MSOs run multi-year tenders worth tens–hundreds of millions, compressing PLP margins while giving volume visibility. AVLs and rigorous testing raise entry barriers but empower buyers at renewals; losing approval blocks markets. Seasonal/BEAD-driven lumpiness (BEAD $42.45B) lets buyers extract timing discounts; distributors/EPCs—per PLP 2024 filings—represent the majority of net sales, increasing leverage.
| Buyer | Leverage | 2024 data |
|---|---|---|
| IOUs/Telcos/MSOs | High | Multi-year tenders, $M–$100sM |
| Distributors/EPCs | Majority sales | PLP 2024 filings: majority of net sales |
| BEAD program | Timing leverage | $42.45B |
Same Document Delivered
Preformed Line Products Porter's Five Forces Analysis
This preview shows the exact Porter’s Five Forces analysis of Preformed Line Products you'll receive upon purchase—fully formatted, final and ready to use. No samples or placeholders: once you buy, you get instant access to this identical, professional document.

Go Beyond the Preview—Access the Full Strategic Report
This snapshot highlights Preformed Line Products’ competitive pressures—from supplier influence to substitute threats—and outlines strategic implications. The full Porter's Five Forces Analysis uncovers force-by-force ratings, visuals, and market intelligence to validate opportunities and risks. Gain actionable insights to refine strategy or investment decisions. Unlock the complete report for a consultant-grade breakdown tailored to Preformed Line Products.
Suppliers Bargaining Power
Concentrated metals and polymers sources
PLP depends on concentrated sources of steel, aluminum, specialty alloys and engineered polymers, and this supplier concentration heightens leverage during tight commodity cycles observed in 2024. Long-term contracts and multi-sourcing reduce acute price spikes, but qualifying new mills or compounding houses can take many months. Commodity hedging and inventory buffers provide partial protection yet cannot fully neutralize raw-material volatility.
Specification-driven material requirements
Utility and telecom standards such as ASTM and IEC mandate precise mechanical and corrosion properties, narrowing acceptable raw-material inputs and components. Fewer suppliers meet those specifications and pass utility audits, giving qualified vendors outsized bargaining power over price and lead times. Requalification of new inputs typically takes 6–12 months and can cost $100,000–$500,000, making changes slow and costly. This effectively locks Preformed Line Products into approved vendors for safety-critical parts.
Switching costs and tooling dependencies
Custom dies, molds, and coatings tie PLP to specific suppliers, with tooling and recertification often exceeding $200,000 and adding 12–24 weeks to changeovers, increasing supplier leverage on price and lead time. Such switching costs and redesign needs raise effective supplier bargaining power versus PLP, whose 2024 revenue was reported at $546.4 million, amplifying the impact on margins. Dual-tooling can cut lead-time risk but typically doubles upfront tooling expense and only partially mitigates dependency.
Logistics and geopolitical exposure
Global metals and chemicals supply chains remain exposed to freight rates, sanctions and export controls, with 2024 container rates roughly 20% above 2019 levels, amplifying supplier leverage and scarcity premiums during disruptions. Regionalizing sources and holding 3–6 months of safety stock can blunt shocks, but expedited logistics and duties still pass extra costs to PLP, squeezing margins.
- Higher freight/surcharges → greater supplier pricing power
- 3–6 months safety stock reduces disruption risk
- Regional sourcing lowers exposure but raises unit costs
Potential for limited backward integration
PLP’s competitive position relies on design and assembly rather than primary metalmaking or polymer production, limiting realistic backward integration and capping supplier leverage; FY2024 revenue was about $730 million, keeping scale below major raw-material producers.
- Core focus: design/assembly, not commodities
- Backward integration limited by capital intensity
- Selective insourcing for niche machining/coating
- Full vertical integration would require >$100M capex risk
Supplier concentration and tooling squeeze margins; container rates +20%
Supplier concentration in steel, aluminum, alloys and engineered polymers gives vendors outsized leverage during 2024 commodity tightness, raising price and lead‑time risk. High requalification and tooling costs (requalification 6–12 months, $100k–$500k; tooling >$200k, 12–24 weeks) and 20% higher 2024 container rates versus 2019 lock PLP into approved suppliers, squeezing margins despite 3–6 months safety stock. FY2024 revenue ~ $730M.
| Metric | Value |
|---|---|
| Requalification time/cost | 6–12 months / $100k–$500k |
| Tooling | >$200k / 12–24 weeks |
| Safety stock | 3–6 months |
| Container rates (vs 2019) | +20% |
| FY2024 revenue | $730M |
What is included in the product
Detailed Word Document
Tailored Porter's Five Forces analysis for Preformed Line Products that uncovers key competitive drivers, supplier and buyer power, and market entry barriers influencing pricing and profitability. Identifies disruptive substitutes and emerging threats while offering strategic insights for investor materials, internal strategy decks, or academic use.
Customizable Excel Spreadsheet
One-sheet Porter’s Five Forces for Preformed Line Products — quickly visualize competitive pressure, supplier power, and substitution risk with editable ratings and a radar chart, ready to drop into decks or integrate with dashboards.
Customers Bargaining Power
Large utility and telecom buyers
Major IOUs, telcos and MSOs buy PLP products in volume and run competitive tenders, with multi-year framework deals often worth tens to hundreds of millions of dollars, enabling aggressive price and service-level demands. Their scale forces compression of supplier margins while providing PLP with volume visibility. PLP must balance lower pricing against a reliability premium tied to outage reduction and lifecycle performance.
Standards, approvals, and vendor lists
Customers mandate approved vendor lists and rigorous testing for Preformed Line Products (PLPC), making specification a key entry barrier; being on AVLs reduces churn but gives buyers leverage to extract concessions at renewal. Losing PLPC approval can shut out utility and telecom business for years, so continuous compliance, certifications, and traceable documentation are essential bargaining chips.
Project-based and seasonal demand
Project-based and seasonal demand—driven by build cycles, storm hardening and the $42.45B BEAD broadband program—creates lumpy orders that let buyers use timing pressure to extract discounts and expedited delivery. PLP’s global footprint and inventory programs help smooth peaks and shorten lead times, but idle-capacity risk in slow periods can shift bargaining power back to customers.
Low switching costs once qualified alternatives exist
When utilities and contractors hold multiple approved suppliers, switching at rebid can be swift and price often outranks proven reliability; PLP responds by emphasizing lifecycle cost analyses, documented performance metrics, and robust field support to justify premium pricing and maintain share.
Distributor and EPC bargaining dynamics
Distributors and EPCs aggregate demand and shape specs, seeking rebates, extended credit and logistics support; PLP's 2024 filings state distributors/EPCs represent the majority of net sales, raising their negotiating leverage as consolidation accelerates.
- Demand aggregation
- Rebates & credit pressure
- Consolidation increases leverage
- VMI and co-planning deepen ties
IOU/telco multi-year tenders squeeze PLP margins; BEAD $42.45B drives buyer leverage
Large IOUs, telcos and MSOs run multi-year tenders worth tens–hundreds of millions, compressing PLP margins while giving volume visibility. AVLs and rigorous testing raise entry barriers but empower buyers at renewals; losing approval blocks markets. Seasonal/BEAD-driven lumpiness (BEAD $42.45B) lets buyers extract timing discounts; distributors/EPCs—per PLP 2024 filings—represent the majority of net sales, increasing leverage.
| Buyer | Leverage | 2024 data |
|---|---|---|
| IOUs/Telcos/MSOs | High | Multi-year tenders, $M–$100sM |
| Distributors/EPCs | Majority sales | PLP 2024 filings: majority of net sales |
| BEAD program | Timing leverage | $42.45B |
Same Document Delivered
Preformed Line Products Porter's Five Forces Analysis
This preview shows the exact Porter’s Five Forces analysis of Preformed Line Products you'll receive upon purchase—fully formatted, final and ready to use. No samples or placeholders: once you buy, you get instant access to this identical, professional document.
Original: $10.00
-65%$10.00
$3.50Description
Go Beyond the Preview—Access the Full Strategic Report
This snapshot highlights Preformed Line Products’ competitive pressures—from supplier influence to substitute threats—and outlines strategic implications. The full Porter's Five Forces Analysis uncovers force-by-force ratings, visuals, and market intelligence to validate opportunities and risks. Gain actionable insights to refine strategy or investment decisions. Unlock the complete report for a consultant-grade breakdown tailored to Preformed Line Products.
Suppliers Bargaining Power
Concentrated metals and polymers sources
PLP depends on concentrated sources of steel, aluminum, specialty alloys and engineered polymers, and this supplier concentration heightens leverage during tight commodity cycles observed in 2024. Long-term contracts and multi-sourcing reduce acute price spikes, but qualifying new mills or compounding houses can take many months. Commodity hedging and inventory buffers provide partial protection yet cannot fully neutralize raw-material volatility.
Specification-driven material requirements
Utility and telecom standards such as ASTM and IEC mandate precise mechanical and corrosion properties, narrowing acceptable raw-material inputs and components. Fewer suppliers meet those specifications and pass utility audits, giving qualified vendors outsized bargaining power over price and lead times. Requalification of new inputs typically takes 6–12 months and can cost $100,000–$500,000, making changes slow and costly. This effectively locks Preformed Line Products into approved vendors for safety-critical parts.
Switching costs and tooling dependencies
Custom dies, molds, and coatings tie PLP to specific suppliers, with tooling and recertification often exceeding $200,000 and adding 12–24 weeks to changeovers, increasing supplier leverage on price and lead time. Such switching costs and redesign needs raise effective supplier bargaining power versus PLP, whose 2024 revenue was reported at $546.4 million, amplifying the impact on margins. Dual-tooling can cut lead-time risk but typically doubles upfront tooling expense and only partially mitigates dependency.
Logistics and geopolitical exposure
Global metals and chemicals supply chains remain exposed to freight rates, sanctions and export controls, with 2024 container rates roughly 20% above 2019 levels, amplifying supplier leverage and scarcity premiums during disruptions. Regionalizing sources and holding 3–6 months of safety stock can blunt shocks, but expedited logistics and duties still pass extra costs to PLP, squeezing margins.
- Higher freight/surcharges → greater supplier pricing power
- 3–6 months safety stock reduces disruption risk
- Regional sourcing lowers exposure but raises unit costs
Potential for limited backward integration
PLP’s competitive position relies on design and assembly rather than primary metalmaking or polymer production, limiting realistic backward integration and capping supplier leverage; FY2024 revenue was about $730 million, keeping scale below major raw-material producers.
- Core focus: design/assembly, not commodities
- Backward integration limited by capital intensity
- Selective insourcing for niche machining/coating
- Full vertical integration would require >$100M capex risk
Supplier concentration and tooling squeeze margins; container rates +20%
Supplier concentration in steel, aluminum, alloys and engineered polymers gives vendors outsized leverage during 2024 commodity tightness, raising price and lead‑time risk. High requalification and tooling costs (requalification 6–12 months, $100k–$500k; tooling >$200k, 12–24 weeks) and 20% higher 2024 container rates versus 2019 lock PLP into approved suppliers, squeezing margins despite 3–6 months safety stock. FY2024 revenue ~ $730M.
| Metric | Value |
|---|---|
| Requalification time/cost | 6–12 months / $100k–$500k |
| Tooling | >$200k / 12–24 weeks |
| Safety stock | 3–6 months |
| Container rates (vs 2019) | +20% |
| FY2024 revenue | $730M |
What is included in the product
Detailed Word Document
Tailored Porter's Five Forces analysis for Preformed Line Products that uncovers key competitive drivers, supplier and buyer power, and market entry barriers influencing pricing and profitability. Identifies disruptive substitutes and emerging threats while offering strategic insights for investor materials, internal strategy decks, or academic use.
Customizable Excel Spreadsheet
One-sheet Porter’s Five Forces for Preformed Line Products — quickly visualize competitive pressure, supplier power, and substitution risk with editable ratings and a radar chart, ready to drop into decks or integrate with dashboards.
Customers Bargaining Power
Large utility and telecom buyers
Major IOUs, telcos and MSOs buy PLP products in volume and run competitive tenders, with multi-year framework deals often worth tens to hundreds of millions of dollars, enabling aggressive price and service-level demands. Their scale forces compression of supplier margins while providing PLP with volume visibility. PLP must balance lower pricing against a reliability premium tied to outage reduction and lifecycle performance.
Standards, approvals, and vendor lists
Customers mandate approved vendor lists and rigorous testing for Preformed Line Products (PLPC), making specification a key entry barrier; being on AVLs reduces churn but gives buyers leverage to extract concessions at renewal. Losing PLPC approval can shut out utility and telecom business for years, so continuous compliance, certifications, and traceable documentation are essential bargaining chips.
Project-based and seasonal demand
Project-based and seasonal demand—driven by build cycles, storm hardening and the $42.45B BEAD broadband program—creates lumpy orders that let buyers use timing pressure to extract discounts and expedited delivery. PLP’s global footprint and inventory programs help smooth peaks and shorten lead times, but idle-capacity risk in slow periods can shift bargaining power back to customers.
Low switching costs once qualified alternatives exist
When utilities and contractors hold multiple approved suppliers, switching at rebid can be swift and price often outranks proven reliability; PLP responds by emphasizing lifecycle cost analyses, documented performance metrics, and robust field support to justify premium pricing and maintain share.
Distributor and EPC bargaining dynamics
Distributors and EPCs aggregate demand and shape specs, seeking rebates, extended credit and logistics support; PLP's 2024 filings state distributors/EPCs represent the majority of net sales, raising their negotiating leverage as consolidation accelerates.
- Demand aggregation
- Rebates & credit pressure
- Consolidation increases leverage
- VMI and co-planning deepen ties
IOU/telco multi-year tenders squeeze PLP margins; BEAD $42.45B drives buyer leverage
Large IOUs, telcos and MSOs run multi-year tenders worth tens–hundreds of millions, compressing PLP margins while giving volume visibility. AVLs and rigorous testing raise entry barriers but empower buyers at renewals; losing approval blocks markets. Seasonal/BEAD-driven lumpiness (BEAD $42.45B) lets buyers extract timing discounts; distributors/EPCs—per PLP 2024 filings—represent the majority of net sales, increasing leverage.
| Buyer | Leverage | 2024 data |
|---|---|---|
| IOUs/Telcos/MSOs | High | Multi-year tenders, $M–$100sM |
| Distributors/EPCs | Majority sales | PLP 2024 filings: majority of net sales |
| BEAD program | Timing leverage | $42.45B |
Same Document Delivered
Preformed Line Products Porter's Five Forces Analysis
This preview shows the exact Porter’s Five Forces analysis of Preformed Line Products you'll receive upon purchase—fully formatted, final and ready to use. No samples or placeholders: once you buy, you get instant access to this identical, professional document.











