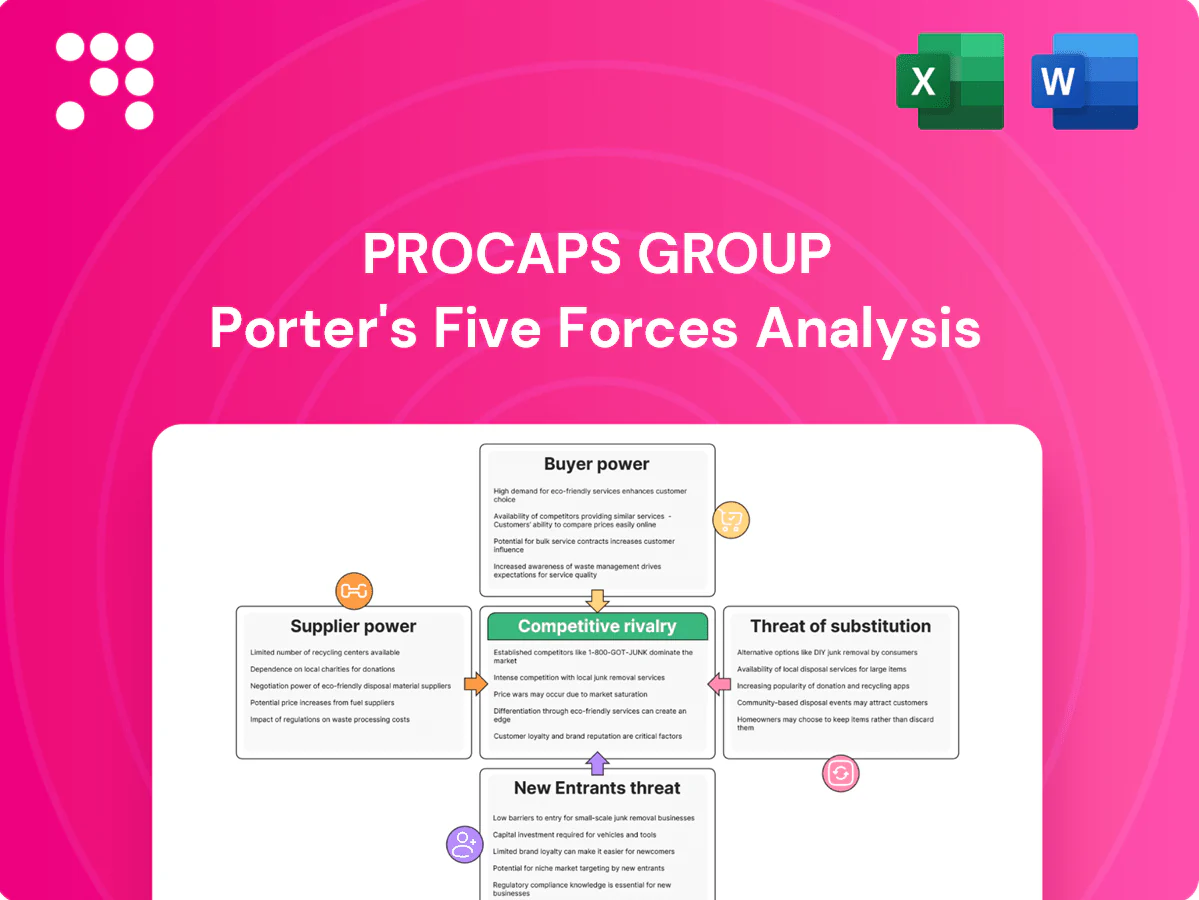
Procaps Group Porter's Five Forces Analysis

Go Beyond the Preview—Access the Full Strategic Report
Procaps Group faces moderating buyer power, specialized supplier relationships, and notable regulatory and competitive pressures shaping its pharma and consumer health positioning. Competitive rivalry and the threat of generics heighten margin sensitivity while product differentiation and vertical capabilities offer defense. This brief snapshot only scratches the surface—unlock the full Porter's Five Forces Analysis for actionable, consultant-grade insights.
Suppliers Bargaining Power

API and excipient concentration
Active pharmaceutical ingredients and key excipients are sourced from a relatively concentrated, highly regulated base—about ≈70% of global API production centers in China and India—giving qualified suppliers leverage on price and terms. Procurement must balance cost, continuity, and regulatory traceability; long-term contracts and dual-sourcing cut exposure. Any quality deviation can halt batches and trigger regulatory holds, amplifying supplier power.
Gelatin and softgel inputs volatility
Pharma-grade gelatin, plasticizers and specialty films for softgels are sourced from a handful of approved global suppliers, driving supplier leverage as the global gelatin market reached about USD 3.9 billion in 2024 and reported ~20% price swings in 2023–24. Input costs are cyclical and tied to animal-origin supply and compliance, while qualification of alternates requires lengthy validation and capital, creating high switching frictions and elevated supplier bargaining power.

Specialized equipment and maintenance
Softgel encapsulation lines and coating systems are manufactured by a handful of OEMs that supply proprietary parts and authorised service, creating vendor lock-in on spares and calibration. This drives higher lifecycle costs as buyers often pay premium fees for genuine parts and certified maintenance. High downtime risk compels firms to accept costly service contracts, strengthening equipment suppliers’ bargaining power.

Regulatory-grade packaging and serialization
Child-resistant, humidity-controlled packaging and serialization solutions require audited suppliers, and 2024 regulatory momentum across LATAM has tightened compliance expectations. Fewer compliant vendors in the region heighten reliance and create potential bottlenecks. Revalidation plus artwork and track-and-trace updates increase changeover time and costs, giving packaging suppliers greater leverage over pricing and lead times.
- Compliance: audited suppliers required
- Supply risk: limited LATAM vendors → bottlenecks
- Operations: revalidation/artwork/traceability updates add time/cost
- Power: suppliers command higher pricing and extended lead times
Utilities and logistics reliability
Energy, purified water and cold-chain are core to cGMP production; in LATAM infrastructure variability raises outages and water-treatment costs, which in 2024 increased site-level contingency spend for some manufacturers by double-digit percentages. Logistics partners meeting GDP command premiums (commonly 10–20%), and any disruption cascades into production schedules, elevating supplier power.
API sourcing ≈70% China/India; gelatin volatility ~20% fuels cost spikes and delays
Suppliers of APIs, excipients and speciality softgel inputs hold high leverage—≈70% of APIs concentrated in China/India—raising price and continuity risk. Gelatin market ~USD 3.9B in 2024 with ≈20% price swings (2023–24); qualification times heighten switching costs. Equipment, packaging and GDP logistics (premium ≈10–20%) create vendor lock-in and elevated lead times.
| Metric | 2024 Value |
|---|---|
| API concentration | ≈70% China/India |
| Gelatin market | USD 3.9B |
| Gelatin price volatility | ~20% |
| GDP logistics premium | 10–20% |
What is included in the product
 Detailed Word Document
Tailored Porter's Five Forces review for Procaps Group that uncovers competitive intensity, supplier and buyer power, entry barriers, substitute threats, and strategic levers to protect margins and market share.

 Customizable Excel Spreadsheet
One-sheet Porter’s Five Forces for Procaps Group — distills competitive pressures into a deck-ready summary with customizable force levels and an instant spider chart for rapid strategic decisions.
Customers Bargaining Power

Large pharma and nutraceutical clients
Large pharma and nutraceutical clients wield strong bargaining power over Procaps as regional and global brands with scale and alternatives force tough price and service negotiations.
Volume commitments can secure meaningful discounts and prioritized service levels, but validated product switching costs and regulatory qualifications raise barriers to rapid supplier changes.
Buyers still drive competitive bidding among CMOs, constraining margins despite these switching frictions.
Retail chains and distributors in LATAM
OTC and nutraceutical sales in LATAM depend heavily on a handful of retail chains and distributors that control shelf space, with the largest chains capturing over 50% of category sales in several markets as of 2024. Consolidation gives them bargaining clout over trade terms and promotions, often extracting 10–20% in trade spend or shifting volume to private labels (private label penetration in some OTC categories reached ~10% in 2024). They can reallocate volume to rivals or private labels and impose payment terms of 60–120 days and restrictive returns policies that strain suppliers’ working capital.

Regulators and payers as indirect buyers
Public tenders and formularies set prices and volumes across multiple LATAM and African markets, with tender-driven purchasing prioritizing the lowest compliant bid and compressing supplier margins; Procaps’ eligibility and contract renewals hinge on strict compliance and pharmacovigilance performance, enabling payers and regulators to amplify buyer power through standardized specifications and award criteria.

US market entry dynamics
In the US, customers demand stringent quality, on-time delivery and competitive pricing; with the US pharma market at about $640 billion in 2024 (≈40% of the $1.6 trillion global market per IQVIA), numerous qualified CMOs increase buyer leverage. Procaps’ softgel expertise and faster speed-to-market can mitigate pressure, but audit readiness and service-level penalties keep negotiating power with buyers.
- High buyer expectations: quality, delivery, price
- Market scale: US ≈ $640B (2024)
- Many CMOs = higher buyer leverage
- Differentiation: softgel know-how, speed-to-market
- Remaining risk: audits, penalty clauses favor buyers
Information transparency and comparisons
Buyers now benchmark costs, yields and service across CMOs using audits and historical performance data, cutting information asymmetry and enabling tougher price and quality negotiations; by 2024 adoption of procurement transparency tools in pharma exceeded 50%, accelerating comparative sourcing. Performance dashboards both empower buyers and create incentive structures that reward superior suppliers, pressuring Procaps on margins and KPIs.
- Benchmarks: audits + past performance
- Transparency >50% tool adoption (2024)
- Enables tougher price/quality negotiation
- Dashboards reward high-performing CMOs
Buyer power squeezes pharma margins — 10–20% trade spend, 60–120 day terms
Large pharma and consolidated LATAM retailers (>50% category share) exert strong buyer power, extracting 10–20% trade spend and imposing 60–120 day payment terms; US market size ~$640B (2024) increases buyer leverage.
Volume contracts and regulatory qualifying raise switching costs, but many CMOs and >50% procurement transparency (2024) intensify price competition.
Procaps’ softgel know-how and speed mitigate pressure, yet audits, tenders and penalties compress margins.
| Metric | 2024 |
|---|---|
| US pharma market | $640B |
| LATAM retail share | >50% |
| Private label | ~10% |
| Trade spend | 10–20% |
| Payment terms | 60–120 days |
| Procurement transparency | >50% |
Same Document Delivered
Procaps Group Porter's Five Forces Analysis
This preview shows the exact Porter’s Five Forces analysis of Procaps Group you will receive immediately after purchase—fully structured, sourced, and ready to use. The report covers competitive rivalry, supplier and buyer power, threats of new entrants and substitutes, and strategic implications for valuation and strategy. No placeholders or mockups—this is the final deliverable.

Go Beyond the Preview—Access the Full Strategic Report
Procaps Group faces moderating buyer power, specialized supplier relationships, and notable regulatory and competitive pressures shaping its pharma and consumer health positioning. Competitive rivalry and the threat of generics heighten margin sensitivity while product differentiation and vertical capabilities offer defense. This brief snapshot only scratches the surface—unlock the full Porter's Five Forces Analysis for actionable, consultant-grade insights.
Suppliers Bargaining Power
API and excipient concentration
Active pharmaceutical ingredients and key excipients are sourced from a relatively concentrated, highly regulated base—about ≈70% of global API production centers in China and India—giving qualified suppliers leverage on price and terms. Procurement must balance cost, continuity, and regulatory traceability; long-term contracts and dual-sourcing cut exposure. Any quality deviation can halt batches and trigger regulatory holds, amplifying supplier power.
Gelatin and softgel inputs volatility
Pharma-grade gelatin, plasticizers and specialty films for softgels are sourced from a handful of approved global suppliers, driving supplier leverage as the global gelatin market reached about USD 3.9 billion in 2024 and reported ~20% price swings in 2023–24. Input costs are cyclical and tied to animal-origin supply and compliance, while qualification of alternates requires lengthy validation and capital, creating high switching frictions and elevated supplier bargaining power.
Specialized equipment and maintenance
Softgel encapsulation lines and coating systems are manufactured by a handful of OEMs that supply proprietary parts and authorised service, creating vendor lock-in on spares and calibration. This drives higher lifecycle costs as buyers often pay premium fees for genuine parts and certified maintenance. High downtime risk compels firms to accept costly service contracts, strengthening equipment suppliers’ bargaining power.
Regulatory-grade packaging and serialization
Child-resistant, humidity-controlled packaging and serialization solutions require audited suppliers, and 2024 regulatory momentum across LATAM has tightened compliance expectations. Fewer compliant vendors in the region heighten reliance and create potential bottlenecks. Revalidation plus artwork and track-and-trace updates increase changeover time and costs, giving packaging suppliers greater leverage over pricing and lead times.
- Compliance: audited suppliers required
- Supply risk: limited LATAM vendors → bottlenecks
- Operations: revalidation/artwork/traceability updates add time/cost
- Power: suppliers command higher pricing and extended lead times
Utilities and logistics reliability
Energy, purified water and cold-chain are core to cGMP production; in LATAM infrastructure variability raises outages and water-treatment costs, which in 2024 increased site-level contingency spend for some manufacturers by double-digit percentages. Logistics partners meeting GDP command premiums (commonly 10–20%), and any disruption cascades into production schedules, elevating supplier power.
API sourcing ≈70% China/India; gelatin volatility ~20% fuels cost spikes and delays
Suppliers of APIs, excipients and speciality softgel inputs hold high leverage—≈70% of APIs concentrated in China/India—raising price and continuity risk. Gelatin market ~USD 3.9B in 2024 with ≈20% price swings (2023–24); qualification times heighten switching costs. Equipment, packaging and GDP logistics (premium ≈10–20%) create vendor lock-in and elevated lead times.
| Metric | 2024 Value |
|---|---|
| API concentration | ≈70% China/India |
| Gelatin market | USD 3.9B |
| Gelatin price volatility | ~20% |
| GDP logistics premium | 10–20% |
What is included in the product
Detailed Word Document
Tailored Porter's Five Forces review for Procaps Group that uncovers competitive intensity, supplier and buyer power, entry barriers, substitute threats, and strategic levers to protect margins and market share.
Customizable Excel Spreadsheet
One-sheet Porter’s Five Forces for Procaps Group — distills competitive pressures into a deck-ready summary with customizable force levels and an instant spider chart for rapid strategic decisions.
Customers Bargaining Power
Large pharma and nutraceutical clients
Large pharma and nutraceutical clients wield strong bargaining power over Procaps as regional and global brands with scale and alternatives force tough price and service negotiations.
Volume commitments can secure meaningful discounts and prioritized service levels, but validated product switching costs and regulatory qualifications raise barriers to rapid supplier changes.
Buyers still drive competitive bidding among CMOs, constraining margins despite these switching frictions.
Retail chains and distributors in LATAM
OTC and nutraceutical sales in LATAM depend heavily on a handful of retail chains and distributors that control shelf space, with the largest chains capturing over 50% of category sales in several markets as of 2024. Consolidation gives them bargaining clout over trade terms and promotions, often extracting 10–20% in trade spend or shifting volume to private labels (private label penetration in some OTC categories reached ~10% in 2024). They can reallocate volume to rivals or private labels and impose payment terms of 60–120 days and restrictive returns policies that strain suppliers’ working capital.
Regulators and payers as indirect buyers
Public tenders and formularies set prices and volumes across multiple LATAM and African markets, with tender-driven purchasing prioritizing the lowest compliant bid and compressing supplier margins; Procaps’ eligibility and contract renewals hinge on strict compliance and pharmacovigilance performance, enabling payers and regulators to amplify buyer power through standardized specifications and award criteria.
US market entry dynamics
In the US, customers demand stringent quality, on-time delivery and competitive pricing; with the US pharma market at about $640 billion in 2024 (≈40% of the $1.6 trillion global market per IQVIA), numerous qualified CMOs increase buyer leverage. Procaps’ softgel expertise and faster speed-to-market can mitigate pressure, but audit readiness and service-level penalties keep negotiating power with buyers.
- High buyer expectations: quality, delivery, price
- Market scale: US ≈ $640B (2024)
- Many CMOs = higher buyer leverage
- Differentiation: softgel know-how, speed-to-market
- Remaining risk: audits, penalty clauses favor buyers
Information transparency and comparisons
Buyers now benchmark costs, yields and service across CMOs using audits and historical performance data, cutting information asymmetry and enabling tougher price and quality negotiations; by 2024 adoption of procurement transparency tools in pharma exceeded 50%, accelerating comparative sourcing. Performance dashboards both empower buyers and create incentive structures that reward superior suppliers, pressuring Procaps on margins and KPIs.
- Benchmarks: audits + past performance
- Transparency >50% tool adoption (2024)
- Enables tougher price/quality negotiation
- Dashboards reward high-performing CMOs
Buyer power squeezes pharma margins — 10–20% trade spend, 60–120 day terms
Large pharma and consolidated LATAM retailers (>50% category share) exert strong buyer power, extracting 10–20% trade spend and imposing 60–120 day payment terms; US market size ~$640B (2024) increases buyer leverage.
Volume contracts and regulatory qualifying raise switching costs, but many CMOs and >50% procurement transparency (2024) intensify price competition.
Procaps’ softgel know-how and speed mitigate pressure, yet audits, tenders and penalties compress margins.
| Metric | 2024 |
|---|---|
| US pharma market | $640B |
| LATAM retail share | >50% |
| Private label | ~10% |
| Trade spend | 10–20% |
| Payment terms | 60–120 days |
| Procurement transparency | >50% |
Same Document Delivered
Procaps Group Porter's Five Forces Analysis
This preview shows the exact Porter’s Five Forces analysis of Procaps Group you will receive immediately after purchase—fully structured, sourced, and ready to use. The report covers competitive rivalry, supplier and buyer power, threats of new entrants and substitutes, and strategic implications for valuation and strategy. No placeholders or mockups—this is the final deliverable.
Original: $10.00
-65%$10.00
$3.50Description
Go Beyond the Preview—Access the Full Strategic Report
Procaps Group faces moderating buyer power, specialized supplier relationships, and notable regulatory and competitive pressures shaping its pharma and consumer health positioning. Competitive rivalry and the threat of generics heighten margin sensitivity while product differentiation and vertical capabilities offer defense. This brief snapshot only scratches the surface—unlock the full Porter's Five Forces Analysis for actionable, consultant-grade insights.
Suppliers Bargaining Power
API and excipient concentration
Active pharmaceutical ingredients and key excipients are sourced from a relatively concentrated, highly regulated base—about ≈70% of global API production centers in China and India—giving qualified suppliers leverage on price and terms. Procurement must balance cost, continuity, and regulatory traceability; long-term contracts and dual-sourcing cut exposure. Any quality deviation can halt batches and trigger regulatory holds, amplifying supplier power.
Gelatin and softgel inputs volatility
Pharma-grade gelatin, plasticizers and specialty films for softgels are sourced from a handful of approved global suppliers, driving supplier leverage as the global gelatin market reached about USD 3.9 billion in 2024 and reported ~20% price swings in 2023–24. Input costs are cyclical and tied to animal-origin supply and compliance, while qualification of alternates requires lengthy validation and capital, creating high switching frictions and elevated supplier bargaining power.
Specialized equipment and maintenance
Softgel encapsulation lines and coating systems are manufactured by a handful of OEMs that supply proprietary parts and authorised service, creating vendor lock-in on spares and calibration. This drives higher lifecycle costs as buyers often pay premium fees for genuine parts and certified maintenance. High downtime risk compels firms to accept costly service contracts, strengthening equipment suppliers’ bargaining power.
Regulatory-grade packaging and serialization
Child-resistant, humidity-controlled packaging and serialization solutions require audited suppliers, and 2024 regulatory momentum across LATAM has tightened compliance expectations. Fewer compliant vendors in the region heighten reliance and create potential bottlenecks. Revalidation plus artwork and track-and-trace updates increase changeover time and costs, giving packaging suppliers greater leverage over pricing and lead times.
- Compliance: audited suppliers required
- Supply risk: limited LATAM vendors → bottlenecks
- Operations: revalidation/artwork/traceability updates add time/cost
- Power: suppliers command higher pricing and extended lead times
Utilities and logistics reliability
Energy, purified water and cold-chain are core to cGMP production; in LATAM infrastructure variability raises outages and water-treatment costs, which in 2024 increased site-level contingency spend for some manufacturers by double-digit percentages. Logistics partners meeting GDP command premiums (commonly 10–20%), and any disruption cascades into production schedules, elevating supplier power.
API sourcing ≈70% China/India; gelatin volatility ~20% fuels cost spikes and delays
Suppliers of APIs, excipients and speciality softgel inputs hold high leverage—≈70% of APIs concentrated in China/India—raising price and continuity risk. Gelatin market ~USD 3.9B in 2024 with ≈20% price swings (2023–24); qualification times heighten switching costs. Equipment, packaging and GDP logistics (premium ≈10–20%) create vendor lock-in and elevated lead times.
| Metric | 2024 Value |
|---|---|
| API concentration | ≈70% China/India |
| Gelatin market | USD 3.9B |
| Gelatin price volatility | ~20% |
| GDP logistics premium | 10–20% |
What is included in the product
Detailed Word Document
Tailored Porter's Five Forces review for Procaps Group that uncovers competitive intensity, supplier and buyer power, entry barriers, substitute threats, and strategic levers to protect margins and market share.
Customizable Excel Spreadsheet
One-sheet Porter’s Five Forces for Procaps Group — distills competitive pressures into a deck-ready summary with customizable force levels and an instant spider chart for rapid strategic decisions.
Customers Bargaining Power
Large pharma and nutraceutical clients
Large pharma and nutraceutical clients wield strong bargaining power over Procaps as regional and global brands with scale and alternatives force tough price and service negotiations.
Volume commitments can secure meaningful discounts and prioritized service levels, but validated product switching costs and regulatory qualifications raise barriers to rapid supplier changes.
Buyers still drive competitive bidding among CMOs, constraining margins despite these switching frictions.
Retail chains and distributors in LATAM
OTC and nutraceutical sales in LATAM depend heavily on a handful of retail chains and distributors that control shelf space, with the largest chains capturing over 50% of category sales in several markets as of 2024. Consolidation gives them bargaining clout over trade terms and promotions, often extracting 10–20% in trade spend or shifting volume to private labels (private label penetration in some OTC categories reached ~10% in 2024). They can reallocate volume to rivals or private labels and impose payment terms of 60–120 days and restrictive returns policies that strain suppliers’ working capital.
Regulators and payers as indirect buyers
Public tenders and formularies set prices and volumes across multiple LATAM and African markets, with tender-driven purchasing prioritizing the lowest compliant bid and compressing supplier margins; Procaps’ eligibility and contract renewals hinge on strict compliance and pharmacovigilance performance, enabling payers and regulators to amplify buyer power through standardized specifications and award criteria.
US market entry dynamics
In the US, customers demand stringent quality, on-time delivery and competitive pricing; with the US pharma market at about $640 billion in 2024 (≈40% of the $1.6 trillion global market per IQVIA), numerous qualified CMOs increase buyer leverage. Procaps’ softgel expertise and faster speed-to-market can mitigate pressure, but audit readiness and service-level penalties keep negotiating power with buyers.
- High buyer expectations: quality, delivery, price
- Market scale: US ≈ $640B (2024)
- Many CMOs = higher buyer leverage
- Differentiation: softgel know-how, speed-to-market
- Remaining risk: audits, penalty clauses favor buyers
Information transparency and comparisons
Buyers now benchmark costs, yields and service across CMOs using audits and historical performance data, cutting information asymmetry and enabling tougher price and quality negotiations; by 2024 adoption of procurement transparency tools in pharma exceeded 50%, accelerating comparative sourcing. Performance dashboards both empower buyers and create incentive structures that reward superior suppliers, pressuring Procaps on margins and KPIs.
- Benchmarks: audits + past performance
- Transparency >50% tool adoption (2024)
- Enables tougher price/quality negotiation
- Dashboards reward high-performing CMOs
Buyer power squeezes pharma margins — 10–20% trade spend, 60–120 day terms
Large pharma and consolidated LATAM retailers (>50% category share) exert strong buyer power, extracting 10–20% trade spend and imposing 60–120 day payment terms; US market size ~$640B (2024) increases buyer leverage.
Volume contracts and regulatory qualifying raise switching costs, but many CMOs and >50% procurement transparency (2024) intensify price competition.
Procaps’ softgel know-how and speed mitigate pressure, yet audits, tenders and penalties compress margins.
| Metric | 2024 |
|---|---|
| US pharma market | $640B |
| LATAM retail share | >50% |
| Private label | ~10% |
| Trade spend | 10–20% |
| Payment terms | 60–120 days |
| Procurement transparency | >50% |
Same Document Delivered
Procaps Group Porter's Five Forces Analysis
This preview shows the exact Porter’s Five Forces analysis of Procaps Group you will receive immediately after purchase—fully structured, sourced, and ready to use. The report covers competitive rivalry, supplier and buyer power, threats of new entrants and substitutes, and strategic implications for valuation and strategy. No placeholders or mockups—this is the final deliverable.











