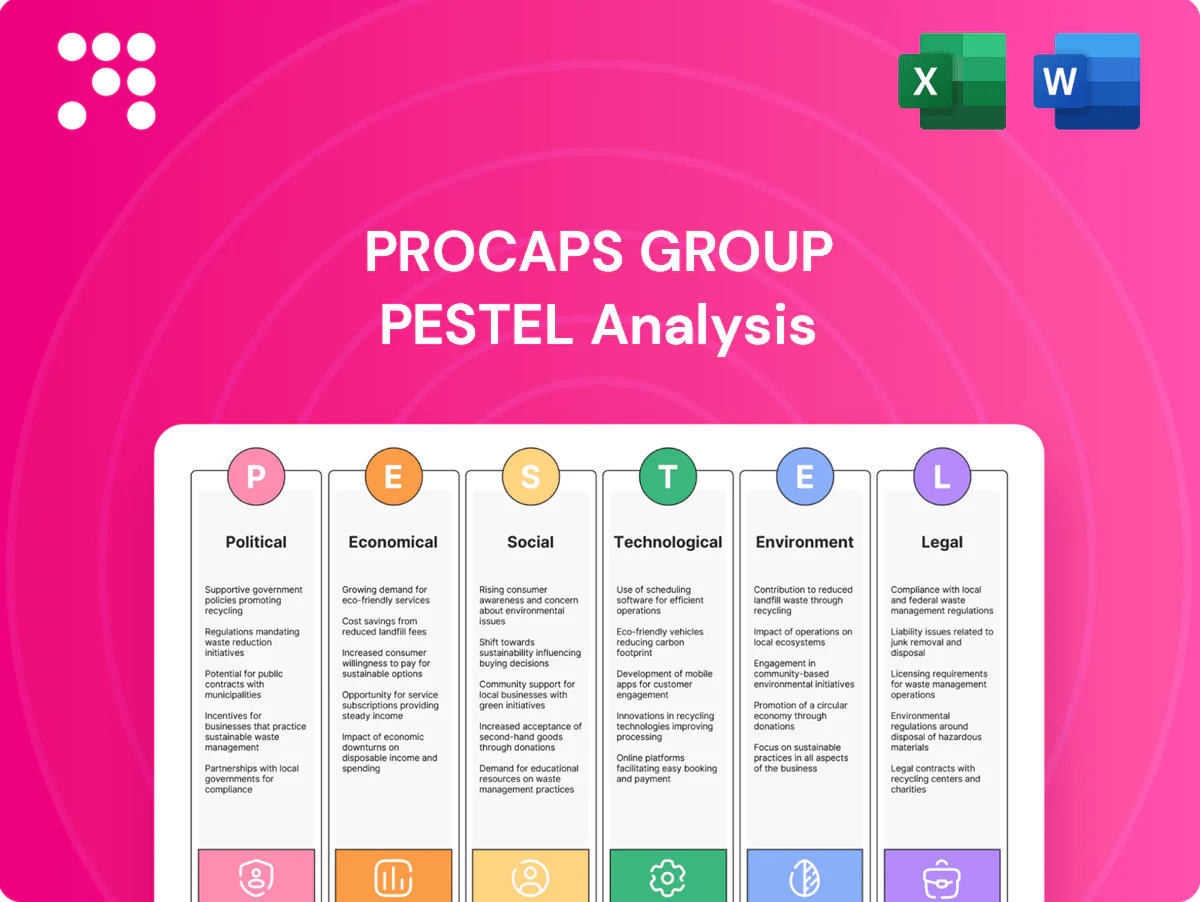
Procaps Group PESTLE Analysis

Your Competitive Advantage Starts with This Report
Our concise PESTLE snapshot reveals how political regulation, economic volatility, social health trends, technological innovation and environmental and legal pressures are shaping Procaps Group’s prospects. These insights highlight risks and growth levers for investors and strategists. Purchase the full PESTLE to access actionable, fully sourced analysis and ready-to-use slides.
Political factors

Regulatory stability in LATAM
Procaps operates across LATAM jurisdictions with varying political stability and healthcare policies; IMF projected Latin America growth at about 2.5% in 2024 and a population near 660 million, shaping demand. Shifts in administrations can change drug approval timelines, procurement priorities, and local manufacturing incentives; monitoring INVIMA, ANVISA and COFEPRIS is critical. Policy predictability directly influences capex planning and supply continuity.
Government pricing and procurement
Public tenders and reference pricing significantly pressure margins on prescription and OTC products, as national formularies set reimbursement ceilings. Centralized purchasing compresses prices but provides predictable volume and planning visibility for manufacturing. Negotiation leverage shifts with each country's fiscal health and public budget constraints, affecting payment terms and timelines. Diversification into private channels and export markets reduces dependence on tender cycles and tender risk.

Industrial policy and localization
Several LATAM markets promote local pharmaceutical production through tax incentives and local-content rules, creating potential benefits for Procaps’ manufacturing footprint if it complies with hiring and sourcing requirements. Sudden policy reversals can compress projected ROI, so Procaps should use scenario planning to enable flexible capacity redeployment and protect margins.

US policy and FDA engagement
Expansion into the US exposes Procaps to federal drug import rules, FDA 483 enforcement and cGMP expectations; aligning with FDA guidance enhances credibility in the US prescription drug market valued at about USD 560 billion in 2024, while proactive regulatory affairs work reduces approval and inspection risk.
- Regulatory exposure: FDA cGMP and 483s
- Market size: ~USD 560B (US, 2024)
- Trade risk: tariffs affect input costs
- Mitigation: proactive regulatory affairs
Trade agreements and supply chains
Regional trade frameworks, such as the US-Colombia FTA and the Pacific Alliance, lower or eliminate tariffs and streamline customs for pharmaceutical inputs, improving API landed costs and logistics. Political tensions and border restrictions have repeatedly disrupted cross-border components and packaging flows, increasing supply risk. Leveraging FTAs and dual-sourcing strategies reduces landed-costs and geopolitical exposure.
- FTAs: US-Colombia, Pacific Alliance
- Benefit: lower/eliminated tariffs on pharma inputs
- Risk: border tensions disrupt components/packaging
- Mitigation: dual-sourcing to reduce exposure
LATAM policy risk trims margins; IMF 2.5%, 660M pop
Procaps faces variable LATAM political risk: IMF projected regional GDP ~2.5% in 2024 and population ~660M, affecting demand and tender budgets; changes in administrations alter drug approval timelines and procurement priorities (INVIMA, ANVISA, COFEPRIS).
Public tenders and reference pricing compress margins but give volume visibility; local-production incentives reduce costs yet carry policy reversal risk.
US expansion requires FDA cGMP alignment; US prescription market ~USD 560B (2024); FTAs (US-Colombia, Pacific Alliance) lower tariffs and improve API landed costs.
| Item | Metric |
|---|---|
| LATAM GDP growth (2024) | ~2.5% |
| LATAM population | ~660M |
| US Rx market (2024) | ~USD 560B |
What is included in the product
 Detailed Word Document
Explores how external macro-environmental factors uniquely affect Procaps Group across Political, Economic, Social, Technological, Environmental and Legal dimensions, with data-backed trends and region-specific regulatory context. Designed for executives and investors, it highlights threats, opportunities and forward-looking insights formatted for business plans, pitch decks and scenario planning.

 Customizable Excel Spreadsheet
A concise, visually segmented PESTLE summary of Procaps Group that’s easy to drop into presentations, share across teams, and adapt with custom notes to support external risk discussions and strategic planning.
Economic factors

Currency volatility and inflation
LATAM currencies can be highly volatile versus the USD, with local currencies moving 10–30% year-to-year, raising USD-denominated API import costs and compressing margins in regulated markets where pricing lags input spikes. Procaps’ USD sales in the US provide a natural hedge, while disciplined treasury hedging (forwards/options) is essential to manage FX and inflation exposure.
Healthcare spending cycles
Macroeconomic slowdowns pressure public health budgets and OTC consumption, with global health spending growth easing to roughly 3–4% in 2023 and the US reaching about $4.5 trillion in total health spending in 2023, tightening procurement cycles for suppliers like Procaps. Private insurance penetration (over 50% in several Latin American markets by 2023) supports resilient prescription and specialty segments. A mix-shift toward essentials and generics can stabilize revenue as consumers prioritize core therapies. Geographic diversity across LATAM and US contracts smooths cyclical dips.

Interest rates and financing
Higher local interest rates increase working capital and capex costs for Procaps’ plants and equipment, pressuring margins on domestic manufacturing. Access to dollar funding is contingent on the group’s leverage and covenant headroom with lenders. Efficient inventory turns in softgel operations materially free cash flow, while phased investments mitigate short-term rate exposure.

Input cost dynamics
Procaps input costs are sensitive to API, gelatin and excipient commodity swings and global logistics: freight rates per the Shanghai Containerized Freight Index fell roughly 40% from 2021 peaks through 2024, easing transport-driven cost pressure.
Tight contracting and long-term vendor agreements materially protect gross margins, while nearshoring and supplier qualification programs—shown to cut lead times by up to ~30% in regional pharma supply studies—improve inventory turns.
Quality-driven sourcing minimizes rework and batch failures, preserving yield and avoiding cost overruns that can exceed several percentage points of COGS in pharmaceutical manufacturing.
- API, gelatin, excipient volatility — tied to commodity/logistics
- Contracting/vendor terms — direct margin impact
- Nearshoring/supplier qualification — ~30% lead-time reduction
- Quality sourcing — reduces rework-related COGS
US market growth optionality
US nutraceutical and OTC segments offer higher price points and scale, with the US dietary supplements market ~55 billion USD in 2023 and the US OTC market ~44 billion USD in 2023; entry costs include compliance, marketing and channel access that can push initial CAPEX and SGA higher. Successful CDMO contracts drive plant utilization and dollar revenues, while portfolio fit and SKU mix determine payback timing and IRR.
- Market size: US supplements ~55B (2023)
- US OTC: ~44B (2023)
- Entry costs: compliance, marketing, channel access
- Upside: CDMO utilization → revenue lift; portfolio fit → payback
LATAM policy risk trims margins; IMF 2.5%, 660M pop
LATAM FX swings (10–30% y/y) raise USD‑API costs; Procaps’ US dollar sales and hedging are key. Global health spend growth eased to ~3–4% (2023); US health spend ~4.5T (2023), tightening procurement. Freight (SCFI) fell ~40% from 2021 peaks through 2024, easing logistics costs. US supplements ~55B and OTC ~44B (2023); CDMO utilization drives dollar revenue and margin recovery.
| Metric | Value | Impact |
|---|---|---|
| LATAM FX volatility | 10–30% y/y | Higher USD API cost |
| US health spend | $4.5T (2023) | Tighter procurement |
| SCFI freight | −40% vs 2021 peak (through 2024) | Lower transport costs |
| US supplements/OTC | $55B / $44B (2023) | Higher-margin markets |
Same Document Delivered
Procaps Group PESTLE Analysis
The preview shown here is the exact Procaps Group PESTLE Analysis you’ll receive after purchase—fully formatted, professionally structured, and ready to use. It contains the same content, layout, and insights visible now with no placeholders or teasers. After payment you’ll instantly download this exact file to support your strategic decision-making.

Your Competitive Advantage Starts with This Report
Our concise PESTLE snapshot reveals how political regulation, economic volatility, social health trends, technological innovation and environmental and legal pressures are shaping Procaps Group’s prospects. These insights highlight risks and growth levers for investors and strategists. Purchase the full PESTLE to access actionable, fully sourced analysis and ready-to-use slides.
Political factors
Regulatory stability in LATAM
Procaps operates across LATAM jurisdictions with varying political stability and healthcare policies; IMF projected Latin America growth at about 2.5% in 2024 and a population near 660 million, shaping demand. Shifts in administrations can change drug approval timelines, procurement priorities, and local manufacturing incentives; monitoring INVIMA, ANVISA and COFEPRIS is critical. Policy predictability directly influences capex planning and supply continuity.
Government pricing and procurement
Public tenders and reference pricing significantly pressure margins on prescription and OTC products, as national formularies set reimbursement ceilings. Centralized purchasing compresses prices but provides predictable volume and planning visibility for manufacturing. Negotiation leverage shifts with each country's fiscal health and public budget constraints, affecting payment terms and timelines. Diversification into private channels and export markets reduces dependence on tender cycles and tender risk.
Industrial policy and localization
Several LATAM markets promote local pharmaceutical production through tax incentives and local-content rules, creating potential benefits for Procaps’ manufacturing footprint if it complies with hiring and sourcing requirements. Sudden policy reversals can compress projected ROI, so Procaps should use scenario planning to enable flexible capacity redeployment and protect margins.
US policy and FDA engagement
Expansion into the US exposes Procaps to federal drug import rules, FDA 483 enforcement and cGMP expectations; aligning with FDA guidance enhances credibility in the US prescription drug market valued at about USD 560 billion in 2024, while proactive regulatory affairs work reduces approval and inspection risk.
- Regulatory exposure: FDA cGMP and 483s
- Market size: ~USD 560B (US, 2024)
- Trade risk: tariffs affect input costs
- Mitigation: proactive regulatory affairs
Trade agreements and supply chains
Regional trade frameworks, such as the US-Colombia FTA and the Pacific Alliance, lower or eliminate tariffs and streamline customs for pharmaceutical inputs, improving API landed costs and logistics. Political tensions and border restrictions have repeatedly disrupted cross-border components and packaging flows, increasing supply risk. Leveraging FTAs and dual-sourcing strategies reduces landed-costs and geopolitical exposure.
- FTAs: US-Colombia, Pacific Alliance
- Benefit: lower/eliminated tariffs on pharma inputs
- Risk: border tensions disrupt components/packaging
- Mitigation: dual-sourcing to reduce exposure
LATAM policy risk trims margins; IMF 2.5%, 660M pop
Procaps faces variable LATAM political risk: IMF projected regional GDP ~2.5% in 2024 and population ~660M, affecting demand and tender budgets; changes in administrations alter drug approval timelines and procurement priorities (INVIMA, ANVISA, COFEPRIS).
Public tenders and reference pricing compress margins but give volume visibility; local-production incentives reduce costs yet carry policy reversal risk.
US expansion requires FDA cGMP alignment; US prescription market ~USD 560B (2024); FTAs (US-Colombia, Pacific Alliance) lower tariffs and improve API landed costs.
| Item | Metric |
|---|---|
| LATAM GDP growth (2024) | ~2.5% |
| LATAM population | ~660M |
| US Rx market (2024) | ~USD 560B |
What is included in the product
Detailed Word Document
Explores how external macro-environmental factors uniquely affect Procaps Group across Political, Economic, Social, Technological, Environmental and Legal dimensions, with data-backed trends and region-specific regulatory context. Designed for executives and investors, it highlights threats, opportunities and forward-looking insights formatted for business plans, pitch decks and scenario planning.
Customizable Excel Spreadsheet
A concise, visually segmented PESTLE summary of Procaps Group that’s easy to drop into presentations, share across teams, and adapt with custom notes to support external risk discussions and strategic planning.
Economic factors
Currency volatility and inflation
LATAM currencies can be highly volatile versus the USD, with local currencies moving 10–30% year-to-year, raising USD-denominated API import costs and compressing margins in regulated markets where pricing lags input spikes. Procaps’ USD sales in the US provide a natural hedge, while disciplined treasury hedging (forwards/options) is essential to manage FX and inflation exposure.
Healthcare spending cycles
Macroeconomic slowdowns pressure public health budgets and OTC consumption, with global health spending growth easing to roughly 3–4% in 2023 and the US reaching about $4.5 trillion in total health spending in 2023, tightening procurement cycles for suppliers like Procaps. Private insurance penetration (over 50% in several Latin American markets by 2023) supports resilient prescription and specialty segments. A mix-shift toward essentials and generics can stabilize revenue as consumers prioritize core therapies. Geographic diversity across LATAM and US contracts smooths cyclical dips.
Interest rates and financing
Higher local interest rates increase working capital and capex costs for Procaps’ plants and equipment, pressuring margins on domestic manufacturing. Access to dollar funding is contingent on the group’s leverage and covenant headroom with lenders. Efficient inventory turns in softgel operations materially free cash flow, while phased investments mitigate short-term rate exposure.
Input cost dynamics
Procaps input costs are sensitive to API, gelatin and excipient commodity swings and global logistics: freight rates per the Shanghai Containerized Freight Index fell roughly 40% from 2021 peaks through 2024, easing transport-driven cost pressure.
Tight contracting and long-term vendor agreements materially protect gross margins, while nearshoring and supplier qualification programs—shown to cut lead times by up to ~30% in regional pharma supply studies—improve inventory turns.
Quality-driven sourcing minimizes rework and batch failures, preserving yield and avoiding cost overruns that can exceed several percentage points of COGS in pharmaceutical manufacturing.
- API, gelatin, excipient volatility — tied to commodity/logistics
- Contracting/vendor terms — direct margin impact
- Nearshoring/supplier qualification — ~30% lead-time reduction
- Quality sourcing — reduces rework-related COGS
US market growth optionality
US nutraceutical and OTC segments offer higher price points and scale, with the US dietary supplements market ~55 billion USD in 2023 and the US OTC market ~44 billion USD in 2023; entry costs include compliance, marketing and channel access that can push initial CAPEX and SGA higher. Successful CDMO contracts drive plant utilization and dollar revenues, while portfolio fit and SKU mix determine payback timing and IRR.
- Market size: US supplements ~55B (2023)
- US OTC: ~44B (2023)
- Entry costs: compliance, marketing, channel access
- Upside: CDMO utilization → revenue lift; portfolio fit → payback
LATAM policy risk trims margins; IMF 2.5%, 660M pop
LATAM FX swings (10–30% y/y) raise USD‑API costs; Procaps’ US dollar sales and hedging are key. Global health spend growth eased to ~3–4% (2023); US health spend ~4.5T (2023), tightening procurement. Freight (SCFI) fell ~40% from 2021 peaks through 2024, easing logistics costs. US supplements ~55B and OTC ~44B (2023); CDMO utilization drives dollar revenue and margin recovery.
| Metric | Value | Impact |
|---|---|---|
| LATAM FX volatility | 10–30% y/y | Higher USD API cost |
| US health spend | $4.5T (2023) | Tighter procurement |
| SCFI freight | −40% vs 2021 peak (through 2024) | Lower transport costs |
| US supplements/OTC | $55B / $44B (2023) | Higher-margin markets |
Same Document Delivered
Procaps Group PESTLE Analysis
The preview shown here is the exact Procaps Group PESTLE Analysis you’ll receive after purchase—fully formatted, professionally structured, and ready to use. It contains the same content, layout, and insights visible now with no placeholders or teasers. After payment you’ll instantly download this exact file to support your strategic decision-making.
Original: $10.00
-65%$10.00
$3.50Description
Your Competitive Advantage Starts with This Report
Our concise PESTLE snapshot reveals how political regulation, economic volatility, social health trends, technological innovation and environmental and legal pressures are shaping Procaps Group’s prospects. These insights highlight risks and growth levers for investors and strategists. Purchase the full PESTLE to access actionable, fully sourced analysis and ready-to-use slides.
Political factors
Regulatory stability in LATAM
Procaps operates across LATAM jurisdictions with varying political stability and healthcare policies; IMF projected Latin America growth at about 2.5% in 2024 and a population near 660 million, shaping demand. Shifts in administrations can change drug approval timelines, procurement priorities, and local manufacturing incentives; monitoring INVIMA, ANVISA and COFEPRIS is critical. Policy predictability directly influences capex planning and supply continuity.
Government pricing and procurement
Public tenders and reference pricing significantly pressure margins on prescription and OTC products, as national formularies set reimbursement ceilings. Centralized purchasing compresses prices but provides predictable volume and planning visibility for manufacturing. Negotiation leverage shifts with each country's fiscal health and public budget constraints, affecting payment terms and timelines. Diversification into private channels and export markets reduces dependence on tender cycles and tender risk.
Industrial policy and localization
Several LATAM markets promote local pharmaceutical production through tax incentives and local-content rules, creating potential benefits for Procaps’ manufacturing footprint if it complies with hiring and sourcing requirements. Sudden policy reversals can compress projected ROI, so Procaps should use scenario planning to enable flexible capacity redeployment and protect margins.
US policy and FDA engagement
Expansion into the US exposes Procaps to federal drug import rules, FDA 483 enforcement and cGMP expectations; aligning with FDA guidance enhances credibility in the US prescription drug market valued at about USD 560 billion in 2024, while proactive regulatory affairs work reduces approval and inspection risk.
- Regulatory exposure: FDA cGMP and 483s
- Market size: ~USD 560B (US, 2024)
- Trade risk: tariffs affect input costs
- Mitigation: proactive regulatory affairs
Trade agreements and supply chains
Regional trade frameworks, such as the US-Colombia FTA and the Pacific Alliance, lower or eliminate tariffs and streamline customs for pharmaceutical inputs, improving API landed costs and logistics. Political tensions and border restrictions have repeatedly disrupted cross-border components and packaging flows, increasing supply risk. Leveraging FTAs and dual-sourcing strategies reduces landed-costs and geopolitical exposure.
- FTAs: US-Colombia, Pacific Alliance
- Benefit: lower/eliminated tariffs on pharma inputs
- Risk: border tensions disrupt components/packaging
- Mitigation: dual-sourcing to reduce exposure
LATAM policy risk trims margins; IMF 2.5%, 660M pop
Procaps faces variable LATAM political risk: IMF projected regional GDP ~2.5% in 2024 and population ~660M, affecting demand and tender budgets; changes in administrations alter drug approval timelines and procurement priorities (INVIMA, ANVISA, COFEPRIS).
Public tenders and reference pricing compress margins but give volume visibility; local-production incentives reduce costs yet carry policy reversal risk.
US expansion requires FDA cGMP alignment; US prescription market ~USD 560B (2024); FTAs (US-Colombia, Pacific Alliance) lower tariffs and improve API landed costs.
| Item | Metric |
|---|---|
| LATAM GDP growth (2024) | ~2.5% |
| LATAM population | ~660M |
| US Rx market (2024) | ~USD 560B |
What is included in the product
Detailed Word Document
Explores how external macro-environmental factors uniquely affect Procaps Group across Political, Economic, Social, Technological, Environmental and Legal dimensions, with data-backed trends and region-specific regulatory context. Designed for executives and investors, it highlights threats, opportunities and forward-looking insights formatted for business plans, pitch decks and scenario planning.
Customizable Excel Spreadsheet
A concise, visually segmented PESTLE summary of Procaps Group that’s easy to drop into presentations, share across teams, and adapt with custom notes to support external risk discussions and strategic planning.
Economic factors
Currency volatility and inflation
LATAM currencies can be highly volatile versus the USD, with local currencies moving 10–30% year-to-year, raising USD-denominated API import costs and compressing margins in regulated markets where pricing lags input spikes. Procaps’ USD sales in the US provide a natural hedge, while disciplined treasury hedging (forwards/options) is essential to manage FX and inflation exposure.
Healthcare spending cycles
Macroeconomic slowdowns pressure public health budgets and OTC consumption, with global health spending growth easing to roughly 3–4% in 2023 and the US reaching about $4.5 trillion in total health spending in 2023, tightening procurement cycles for suppliers like Procaps. Private insurance penetration (over 50% in several Latin American markets by 2023) supports resilient prescription and specialty segments. A mix-shift toward essentials and generics can stabilize revenue as consumers prioritize core therapies. Geographic diversity across LATAM and US contracts smooths cyclical dips.
Interest rates and financing
Higher local interest rates increase working capital and capex costs for Procaps’ plants and equipment, pressuring margins on domestic manufacturing. Access to dollar funding is contingent on the group’s leverage and covenant headroom with lenders. Efficient inventory turns in softgel operations materially free cash flow, while phased investments mitigate short-term rate exposure.
Input cost dynamics
Procaps input costs are sensitive to API, gelatin and excipient commodity swings and global logistics: freight rates per the Shanghai Containerized Freight Index fell roughly 40% from 2021 peaks through 2024, easing transport-driven cost pressure.
Tight contracting and long-term vendor agreements materially protect gross margins, while nearshoring and supplier qualification programs—shown to cut lead times by up to ~30% in regional pharma supply studies—improve inventory turns.
Quality-driven sourcing minimizes rework and batch failures, preserving yield and avoiding cost overruns that can exceed several percentage points of COGS in pharmaceutical manufacturing.
- API, gelatin, excipient volatility — tied to commodity/logistics
- Contracting/vendor terms — direct margin impact
- Nearshoring/supplier qualification — ~30% lead-time reduction
- Quality sourcing — reduces rework-related COGS
US market growth optionality
US nutraceutical and OTC segments offer higher price points and scale, with the US dietary supplements market ~55 billion USD in 2023 and the US OTC market ~44 billion USD in 2023; entry costs include compliance, marketing and channel access that can push initial CAPEX and SGA higher. Successful CDMO contracts drive plant utilization and dollar revenues, while portfolio fit and SKU mix determine payback timing and IRR.
- Market size: US supplements ~55B (2023)
- US OTC: ~44B (2023)
- Entry costs: compliance, marketing, channel access
- Upside: CDMO utilization → revenue lift; portfolio fit → payback
LATAM policy risk trims margins; IMF 2.5%, 660M pop
LATAM FX swings (10–30% y/y) raise USD‑API costs; Procaps’ US dollar sales and hedging are key. Global health spend growth eased to ~3–4% (2023); US health spend ~4.5T (2023), tightening procurement. Freight (SCFI) fell ~40% from 2021 peaks through 2024, easing logistics costs. US supplements ~55B and OTC ~44B (2023); CDMO utilization drives dollar revenue and margin recovery.
| Metric | Value | Impact |
|---|---|---|
| LATAM FX volatility | 10–30% y/y | Higher USD API cost |
| US health spend | $4.5T (2023) | Tighter procurement |
| SCFI freight | −40% vs 2021 peak (through 2024) | Lower transport costs |
| US supplements/OTC | $55B / $44B (2023) | Higher-margin markets |
Same Document Delivered
Procaps Group PESTLE Analysis
The preview shown here is the exact Procaps Group PESTLE Analysis you’ll receive after purchase—fully formatted, professionally structured, and ready to use. It contains the same content, layout, and insights visible now with no placeholders or teasers. After payment you’ll instantly download this exact file to support your strategic decision-making.











