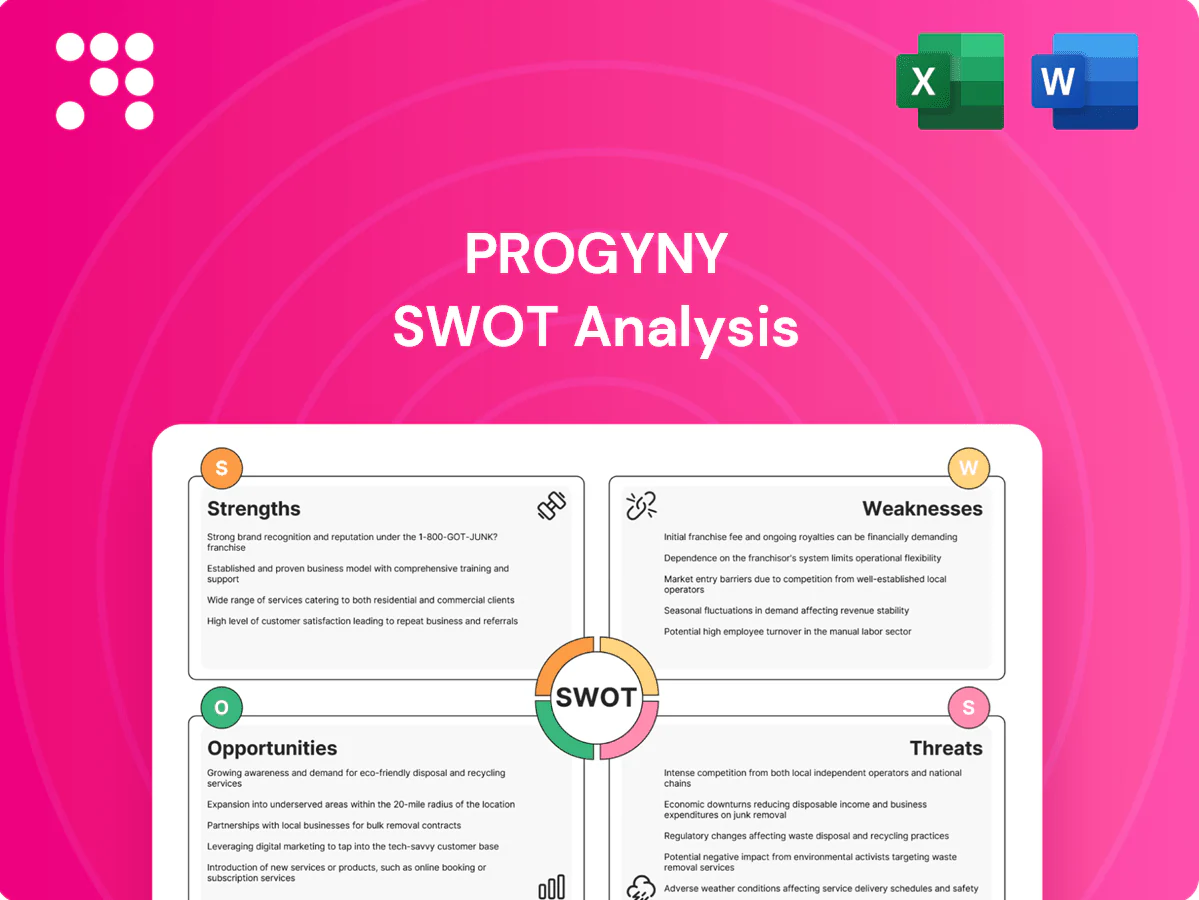
Progyny SWOT Analysis

Elevate Your Analysis with the Complete SWOT Report
Explore Progyny’s strategic position with a concise SWOT snapshot highlighting its clinical partnerships, technology differentiation, regulatory exposure, and market growth vectors. Want the full picture—financial context, competitive mapping, and tactical recommendations? Purchase the complete SWOT analysis for a professionally formatted, editable Word and Excel package to support investment, strategy, or pitch preparation.
Strengths

Integrated fertility + pharmacy model
Combining medical and pharmacy benefits creates a single, coordinated care pathway that reduces fragmentation, improves adherence, and streamlines authorizations; Progyny reported year-over-year growth in client programs through 2024, reflecting strong market uptake. This integrated model can lower total cost of care while improving outcomes—Progyny cites improved success metrics across bundled care. End-to-end accountability deepens client stickiness and increases renewal rates.
High-quality provider network
Curated provider networks steer members to clinics with higher success rates and standardized, evidence-based protocols, aligning care delivery with SART-reported live-birth rates near 40–50% per transfer for patients under 35. Better clinic selection raises live-births per cycle and cuts unnecessary interventions and complications, lowering overall per-member cost. Employers prize this quality assurance for predictable outcomes and plan ROI.

Data-driven care management
Progyny’s outcomes tracking and analytics enable personalized treatment guidance and protocol optimization, driving earlier interventions that reduce cycle waste and shorten time-to-pregnancy. Real-world data support protocol adjustments across cycles, improving clinical efficiency and member experience. Transparent reporting to employers strengthens measurable ROI cases by linking utilization to outcomes and cost avoidance.

Employer partnerships and brand
Large employers increasingly prioritize competitive, inclusive family benefits to attract talent, and Progyny's specialist brand in fertility and family-building resonates strongly with HR and employees. Strong client references reduce new-logo friction, while multi-year contracts provide predictable revenue visibility and lower churn. This positioning supports upsells, pricing leverage, and long-term client partnerships.
- Employer demand: competitive, inclusive benefits
- Brand: trusted in family-building for HR and employees
- Sales friction: strong client references
- Revenue: multi-year contracts = visibility
Member support and experience
Dedicated advisors and concierge-style navigation reduce stress across complex fertility and family-building journeys, driving higher engagement and adherence to prescribed care pathways. Simplified benefits design increases utilization of high-value services, improving clinical outcomes and cost efficiency for employers. Positive member experience fuels word-of-mouth that enhances employer reputation and retention.
- Dedicated advisors
- Higher utilization of high-value care
- Improved clinical adherence
- Stronger employer retention
Med-pharmacy fertility model raises adherence, outcomes; 40–50% live-birth rate
Progyny’s integrated medical+pharmacy model reduces fragmentation and drives higher adherence, supporting reported year-over-year client program growth through 2024. Curated networks align with SART live-birth rates near 40–50% per transfer for patients under 35, improving outcomes and lowering per-member costs. Concierge navigation and multi-year contracts increase utilization and revenue visibility.
| Metric | Value |
|---|---|
| SART live-birth rate (age <35) | 40–50% per transfer (SART) |
| Progyny client programs | Reported YoY growth through 2024 (company filings) |
What is included in the product
 Detailed Word Document
Provides a concise SWOT analysis of Progyny, outlining internal strengths and weaknesses and external opportunities and threats to assess its competitive position, growth drivers, and risks in fertility benefits and healthcare services.

 Customizable Excel Spreadsheet
Provides a concise Progyny SWOT matrix that highlights strengths (differentiated fertility benefits, employer relationships), exposes weaknesses and regulatory risks, and enables fast, actionable strategy alignment for stakeholder decision-making.
Weaknesses

Concentration in employer channel
Progyny derives a majority of its revenue from employer‑sponsored benefits per public filings through 2023, leaving top-line results exposed to HR budget cycles and annual renewal timing. Client churn or employer headcount reductions can quickly depress utilization and revenue per contract. Sales cycles remain long and seasonal, and expansion into other payers and direct-to-consumer channels is still a work-in-progress.
Exposure to specialty drug costs
Fertility medications are costly and volatile, with injectable gonadotropins typically running $3,000–6,000 per cycle and total IVF costs often $20,000–25,000. Pharmacy margins can compress if manufacturers or wholesalers shift pricing or distribution. Rebates and formulary dynamics—where specialty drugs now drive roughly half of US drug spend—add billing complexity. Sudden cost spikes can force Progyny to renegotiate pricing or pass pressure to employer clients.

Dependence on clinic capacity
Dependence on clinic capacity limits access: over 300,000 annual ART cycles in the US strain top centers, where new-patient wait times in major metros often extend several months. Capacity bottlenecks can delay cycles and outcomes, reducing utilization and member satisfaction. Scaling the network demands rigorous quality oversight because clinic success rates vary widely, causing inconsistent results across regions.

Regulatory and compliance complexity
Regulatory and compliance complexity strains Progyny as fertility coverage laws vary across more than 15 states (2024) and evolve quickly, forcing frequent benefit adjustments. Heightened PBM scrutiny, HIPAA and state privacy rules, plus benefit mandates increase legal exposure and administrative costs, pressuring margins and requiring rapid product changes to remain compliant.
- State mandates: >15 states (2024)
- Compliance drivers: PBM audits, privacy laws, mandates
- Impact: higher legal/admin costs and faster product updates
Competitive pricing pressure
Insurers and digital health rivals increasingly offer fertility bundles and benefits navigation, shrinking Progyny’s price premium and forcing reactive discounting that erodes margins. Employers frequently run price-driven RFPs, driving short-term wins at the expense of long-term unit economics. To sustain pricing power Progyny must prove superior outcomes and ROI, not just feature parity.
- Price competition from insurers and digital entrants
- Employers favor price in RFPs
- Discounting compresses gross margins
- Need outcomes-driven differentiation
Employer-tied fertility benefits face margin pressure from drug/IVF costs and regulatory patchwork
Progyny relies heavily on employer‑sponsored benefits per public filings through 2023, leaving revenue tied to HR budget cycles and renewal timing. Fertility drug costs (injectables $3,000–6,000 per cycle; IVF $20,000–25,000) and rebate/formulary volatility compress margins. Clinic capacity (>300,000 US ART cycles annually) and variable success rates limit scaling. Regulatory patchwork (>15 states, 2024) raises compliance costs.
| Metric | Figure | Implication |
|---|---|---|
| Employer revenue | Majority (filings through 2023) | Concentration risk |
| Drug/IVF costs | $3k–6k injectables; $20k–25k IVF | Margin pressure |
| ART capacity | >300,000 cycles/yr (US) | Access limits |
| State mandates | >15 states (2024) | Compliance burden |
What You See Is What You Get
Progyny SWOT Analysis
This is the actual Progyny SWOT analysis document you’ll receive upon purchase—no surprises, just professional quality. The preview below is taken directly from the full report and reflects the same structured, editable file available after checkout. Buy now to unlock the complete, detailed analysis.

Elevate Your Analysis with the Complete SWOT Report
Explore Progyny’s strategic position with a concise SWOT snapshot highlighting its clinical partnerships, technology differentiation, regulatory exposure, and market growth vectors. Want the full picture—financial context, competitive mapping, and tactical recommendations? Purchase the complete SWOT analysis for a professionally formatted, editable Word and Excel package to support investment, strategy, or pitch preparation.
Strengths
Integrated fertility + pharmacy model
Combining medical and pharmacy benefits creates a single, coordinated care pathway that reduces fragmentation, improves adherence, and streamlines authorizations; Progyny reported year-over-year growth in client programs through 2024, reflecting strong market uptake. This integrated model can lower total cost of care while improving outcomes—Progyny cites improved success metrics across bundled care. End-to-end accountability deepens client stickiness and increases renewal rates.
High-quality provider network
Curated provider networks steer members to clinics with higher success rates and standardized, evidence-based protocols, aligning care delivery with SART-reported live-birth rates near 40–50% per transfer for patients under 35. Better clinic selection raises live-births per cycle and cuts unnecessary interventions and complications, lowering overall per-member cost. Employers prize this quality assurance for predictable outcomes and plan ROI.
Data-driven care management
Progyny’s outcomes tracking and analytics enable personalized treatment guidance and protocol optimization, driving earlier interventions that reduce cycle waste and shorten time-to-pregnancy. Real-world data support protocol adjustments across cycles, improving clinical efficiency and member experience. Transparent reporting to employers strengthens measurable ROI cases by linking utilization to outcomes and cost avoidance.
Employer partnerships and brand
Large employers increasingly prioritize competitive, inclusive family benefits to attract talent, and Progyny's specialist brand in fertility and family-building resonates strongly with HR and employees. Strong client references reduce new-logo friction, while multi-year contracts provide predictable revenue visibility and lower churn. This positioning supports upsells, pricing leverage, and long-term client partnerships.
- Employer demand: competitive, inclusive benefits
- Brand: trusted in family-building for HR and employees
- Sales friction: strong client references
- Revenue: multi-year contracts = visibility
Member support and experience
Dedicated advisors and concierge-style navigation reduce stress across complex fertility and family-building journeys, driving higher engagement and adherence to prescribed care pathways. Simplified benefits design increases utilization of high-value services, improving clinical outcomes and cost efficiency for employers. Positive member experience fuels word-of-mouth that enhances employer reputation and retention.
- Dedicated advisors
- Higher utilization of high-value care
- Improved clinical adherence
- Stronger employer retention
Med-pharmacy fertility model raises adherence, outcomes; 40–50% live-birth rate
Progyny’s integrated medical+pharmacy model reduces fragmentation and drives higher adherence, supporting reported year-over-year client program growth through 2024. Curated networks align with SART live-birth rates near 40–50% per transfer for patients under 35, improving outcomes and lowering per-member costs. Concierge navigation and multi-year contracts increase utilization and revenue visibility.
| Metric | Value |
|---|---|
| SART live-birth rate (age <35) | 40–50% per transfer (SART) |
| Progyny client programs | Reported YoY growth through 2024 (company filings) |
What is included in the product
Detailed Word Document
Provides a concise SWOT analysis of Progyny, outlining internal strengths and weaknesses and external opportunities and threats to assess its competitive position, growth drivers, and risks in fertility benefits and healthcare services.
Customizable Excel Spreadsheet
Provides a concise Progyny SWOT matrix that highlights strengths (differentiated fertility benefits, employer relationships), exposes weaknesses and regulatory risks, and enables fast, actionable strategy alignment for stakeholder decision-making.
Weaknesses
Concentration in employer channel
Progyny derives a majority of its revenue from employer‑sponsored benefits per public filings through 2023, leaving top-line results exposed to HR budget cycles and annual renewal timing. Client churn or employer headcount reductions can quickly depress utilization and revenue per contract. Sales cycles remain long and seasonal, and expansion into other payers and direct-to-consumer channels is still a work-in-progress.
Exposure to specialty drug costs
Fertility medications are costly and volatile, with injectable gonadotropins typically running $3,000–6,000 per cycle and total IVF costs often $20,000–25,000. Pharmacy margins can compress if manufacturers or wholesalers shift pricing or distribution. Rebates and formulary dynamics—where specialty drugs now drive roughly half of US drug spend—add billing complexity. Sudden cost spikes can force Progyny to renegotiate pricing or pass pressure to employer clients.
Dependence on clinic capacity
Dependence on clinic capacity limits access: over 300,000 annual ART cycles in the US strain top centers, where new-patient wait times in major metros often extend several months. Capacity bottlenecks can delay cycles and outcomes, reducing utilization and member satisfaction. Scaling the network demands rigorous quality oversight because clinic success rates vary widely, causing inconsistent results across regions.
Regulatory and compliance complexity
Regulatory and compliance complexity strains Progyny as fertility coverage laws vary across more than 15 states (2024) and evolve quickly, forcing frequent benefit adjustments. Heightened PBM scrutiny, HIPAA and state privacy rules, plus benefit mandates increase legal exposure and administrative costs, pressuring margins and requiring rapid product changes to remain compliant.
- State mandates: >15 states (2024)
- Compliance drivers: PBM audits, privacy laws, mandates
- Impact: higher legal/admin costs and faster product updates
Competitive pricing pressure
Insurers and digital health rivals increasingly offer fertility bundles and benefits navigation, shrinking Progyny’s price premium and forcing reactive discounting that erodes margins. Employers frequently run price-driven RFPs, driving short-term wins at the expense of long-term unit economics. To sustain pricing power Progyny must prove superior outcomes and ROI, not just feature parity.
- Price competition from insurers and digital entrants
- Employers favor price in RFPs
- Discounting compresses gross margins
- Need outcomes-driven differentiation
Employer-tied fertility benefits face margin pressure from drug/IVF costs and regulatory patchwork
Progyny relies heavily on employer‑sponsored benefits per public filings through 2023, leaving revenue tied to HR budget cycles and renewal timing. Fertility drug costs (injectables $3,000–6,000 per cycle; IVF $20,000–25,000) and rebate/formulary volatility compress margins. Clinic capacity (>300,000 US ART cycles annually) and variable success rates limit scaling. Regulatory patchwork (>15 states, 2024) raises compliance costs.
| Metric | Figure | Implication |
|---|---|---|
| Employer revenue | Majority (filings through 2023) | Concentration risk |
| Drug/IVF costs | $3k–6k injectables; $20k–25k IVF | Margin pressure |
| ART capacity | >300,000 cycles/yr (US) | Access limits |
| State mandates | >15 states (2024) | Compliance burden |
What You See Is What You Get
Progyny SWOT Analysis
This is the actual Progyny SWOT analysis document you’ll receive upon purchase—no surprises, just professional quality. The preview below is taken directly from the full report and reflects the same structured, editable file available after checkout. Buy now to unlock the complete, detailed analysis.
Original: $10.00
-65%$10.00
$3.50Description
Elevate Your Analysis with the Complete SWOT Report
Explore Progyny’s strategic position with a concise SWOT snapshot highlighting its clinical partnerships, technology differentiation, regulatory exposure, and market growth vectors. Want the full picture—financial context, competitive mapping, and tactical recommendations? Purchase the complete SWOT analysis for a professionally formatted, editable Word and Excel package to support investment, strategy, or pitch preparation.
Strengths
Integrated fertility + pharmacy model
Combining medical and pharmacy benefits creates a single, coordinated care pathway that reduces fragmentation, improves adherence, and streamlines authorizations; Progyny reported year-over-year growth in client programs through 2024, reflecting strong market uptake. This integrated model can lower total cost of care while improving outcomes—Progyny cites improved success metrics across bundled care. End-to-end accountability deepens client stickiness and increases renewal rates.
High-quality provider network
Curated provider networks steer members to clinics with higher success rates and standardized, evidence-based protocols, aligning care delivery with SART-reported live-birth rates near 40–50% per transfer for patients under 35. Better clinic selection raises live-births per cycle and cuts unnecessary interventions and complications, lowering overall per-member cost. Employers prize this quality assurance for predictable outcomes and plan ROI.
Data-driven care management
Progyny’s outcomes tracking and analytics enable personalized treatment guidance and protocol optimization, driving earlier interventions that reduce cycle waste and shorten time-to-pregnancy. Real-world data support protocol adjustments across cycles, improving clinical efficiency and member experience. Transparent reporting to employers strengthens measurable ROI cases by linking utilization to outcomes and cost avoidance.
Employer partnerships and brand
Large employers increasingly prioritize competitive, inclusive family benefits to attract talent, and Progyny's specialist brand in fertility and family-building resonates strongly with HR and employees. Strong client references reduce new-logo friction, while multi-year contracts provide predictable revenue visibility and lower churn. This positioning supports upsells, pricing leverage, and long-term client partnerships.
- Employer demand: competitive, inclusive benefits
- Brand: trusted in family-building for HR and employees
- Sales friction: strong client references
- Revenue: multi-year contracts = visibility
Member support and experience
Dedicated advisors and concierge-style navigation reduce stress across complex fertility and family-building journeys, driving higher engagement and adherence to prescribed care pathways. Simplified benefits design increases utilization of high-value services, improving clinical outcomes and cost efficiency for employers. Positive member experience fuels word-of-mouth that enhances employer reputation and retention.
- Dedicated advisors
- Higher utilization of high-value care
- Improved clinical adherence
- Stronger employer retention
Med-pharmacy fertility model raises adherence, outcomes; 40–50% live-birth rate
Progyny’s integrated medical+pharmacy model reduces fragmentation and drives higher adherence, supporting reported year-over-year client program growth through 2024. Curated networks align with SART live-birth rates near 40–50% per transfer for patients under 35, improving outcomes and lowering per-member costs. Concierge navigation and multi-year contracts increase utilization and revenue visibility.
| Metric | Value |
|---|---|
| SART live-birth rate (age <35) | 40–50% per transfer (SART) |
| Progyny client programs | Reported YoY growth through 2024 (company filings) |
What is included in the product
Detailed Word Document
Provides a concise SWOT analysis of Progyny, outlining internal strengths and weaknesses and external opportunities and threats to assess its competitive position, growth drivers, and risks in fertility benefits and healthcare services.
Customizable Excel Spreadsheet
Provides a concise Progyny SWOT matrix that highlights strengths (differentiated fertility benefits, employer relationships), exposes weaknesses and regulatory risks, and enables fast, actionable strategy alignment for stakeholder decision-making.
Weaknesses
Concentration in employer channel
Progyny derives a majority of its revenue from employer‑sponsored benefits per public filings through 2023, leaving top-line results exposed to HR budget cycles and annual renewal timing. Client churn or employer headcount reductions can quickly depress utilization and revenue per contract. Sales cycles remain long and seasonal, and expansion into other payers and direct-to-consumer channels is still a work-in-progress.
Exposure to specialty drug costs
Fertility medications are costly and volatile, with injectable gonadotropins typically running $3,000–6,000 per cycle and total IVF costs often $20,000–25,000. Pharmacy margins can compress if manufacturers or wholesalers shift pricing or distribution. Rebates and formulary dynamics—where specialty drugs now drive roughly half of US drug spend—add billing complexity. Sudden cost spikes can force Progyny to renegotiate pricing or pass pressure to employer clients.
Dependence on clinic capacity
Dependence on clinic capacity limits access: over 300,000 annual ART cycles in the US strain top centers, where new-patient wait times in major metros often extend several months. Capacity bottlenecks can delay cycles and outcomes, reducing utilization and member satisfaction. Scaling the network demands rigorous quality oversight because clinic success rates vary widely, causing inconsistent results across regions.
Regulatory and compliance complexity
Regulatory and compliance complexity strains Progyny as fertility coverage laws vary across more than 15 states (2024) and evolve quickly, forcing frequent benefit adjustments. Heightened PBM scrutiny, HIPAA and state privacy rules, plus benefit mandates increase legal exposure and administrative costs, pressuring margins and requiring rapid product changes to remain compliant.
- State mandates: >15 states (2024)
- Compliance drivers: PBM audits, privacy laws, mandates
- Impact: higher legal/admin costs and faster product updates
Competitive pricing pressure
Insurers and digital health rivals increasingly offer fertility bundles and benefits navigation, shrinking Progyny’s price premium and forcing reactive discounting that erodes margins. Employers frequently run price-driven RFPs, driving short-term wins at the expense of long-term unit economics. To sustain pricing power Progyny must prove superior outcomes and ROI, not just feature parity.
- Price competition from insurers and digital entrants
- Employers favor price in RFPs
- Discounting compresses gross margins
- Need outcomes-driven differentiation
Employer-tied fertility benefits face margin pressure from drug/IVF costs and regulatory patchwork
Progyny relies heavily on employer‑sponsored benefits per public filings through 2023, leaving revenue tied to HR budget cycles and renewal timing. Fertility drug costs (injectables $3,000–6,000 per cycle; IVF $20,000–25,000) and rebate/formulary volatility compress margins. Clinic capacity (>300,000 US ART cycles annually) and variable success rates limit scaling. Regulatory patchwork (>15 states, 2024) raises compliance costs.
| Metric | Figure | Implication |
|---|---|---|
| Employer revenue | Majority (filings through 2023) | Concentration risk |
| Drug/IVF costs | $3k–6k injectables; $20k–25k IVF | Margin pressure |
| ART capacity | >300,000 cycles/yr (US) | Access limits |
| State mandates | >15 states (2024) | Compliance burden |
What You See Is What You Get
Progyny SWOT Analysis
This is the actual Progyny SWOT analysis document you’ll receive upon purchase—no surprises, just professional quality. The preview below is taken directly from the full report and reflects the same structured, editable file available after checkout. Buy now to unlock the complete, detailed analysis.











