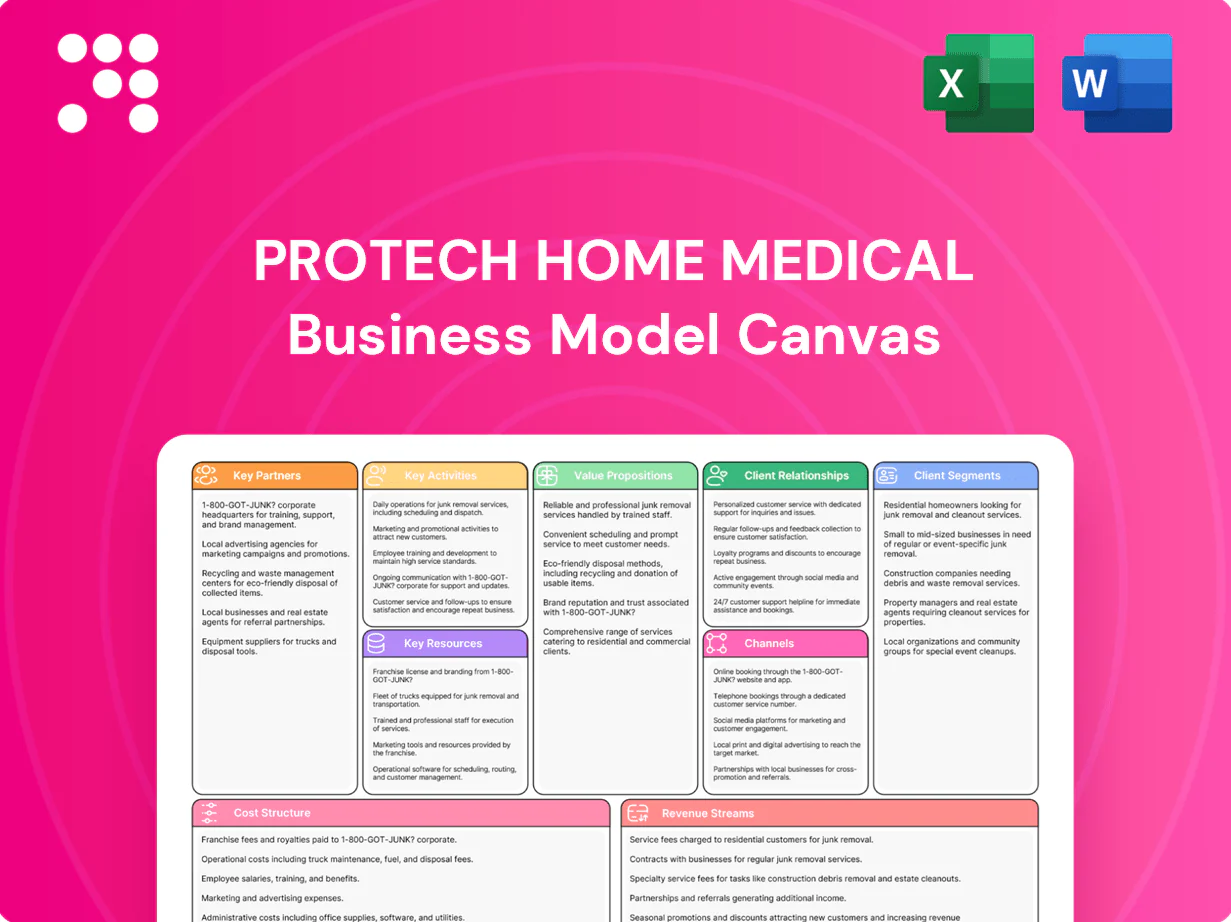
Protech Home Medical Business Model Canvas

Deep-Dive Business Model Canvas for Home Medical Equipment Providers
Unlock the full strategic blueprint behind Protech Home Medical's business model. This in-depth Business Model Canvas reveals how the company creates value, scales revenue, and sustains competitive advantage—perfect for entrepreneurs, consultants, and investors seeking actionable insights. Download the complete Word/Excel canvas to benchmark, plan, and execute with confidence.
Partnerships

Respiratory device OEMs
Partnerships with CPAP, BiPAP, oxygen concentrator and ventilator OEMs secure access to the latest devices and volume discounts, supporting competitive margins; with an estimated 22 million Americans affected by sleep apnea in 2024, clinician demand is sizable. Co-marketing and OEM-led training accelerate clinician adoption, joint inventory planning boosts fill rates and trims stockouts, and OEM alliances streamline warranty handling and recalls.
Payers and PBMs
Contracts with Medicare (≈67 million enrollees in 2024) and Medicaid (≈85 million enrollees in 2024), plus commercial insurers, drive the bulk of Protech Home Medical’s patient volume and reimbursements. PBMs streamline resupply and formulary alignment, reducing logistics and stockouts. Joint payer-PBM collaboration cuts prior-authorization friction and lowers denial rates. Timely data sharing enables tracking for value-based arrangements and outcome-based payments.

Physicians and sleep labs
Referring pulmonologists, primary care, and AASM-accredited sleep labs are primary demand generators, with AASM estimating about 1 in 5 adults have mild OSA and 1 in 15 moderate-to-severe OSA (AASM data cited through 2024). Integrated order workflows shorten administrative steps and speed time-to-therapy, while automated compliance feedback (Medicare adherence: ≥4 hours/night on 70% of nights within 90 days) improves clinical outcomes. Educational partnerships with physicians and labs build trust and referral stickiness by aligning care pathways and CPAP adherence support.

Hospitals and post-acute networks
- 24–48h setup SLA
- Embedded liaisons cut readmissions/LOS
- Supports IDN discharge workflows
- Protects against up to 3% HRRP penalties
Logistics and telehealth vendors
Third-party logistics handle last-mile across wide geographies, with last-mile representing up to 53% of delivery costs and outsourcing cutting ops costs 15-20% in 2024 benchmarks. Telemonitoring platforms—in the $89.2B global telehealth market (2024)—enable remote compliance tracking and can lower readmissions ~25%. API integrations unify scheduling, routing and patient engagement, reducing scheduling errors ~30% and enabling scalable operations.
- Last-mile cost share: 53%
- Telehealth market (2024): $89.2B
- Readmission reduction: ~25%
- Scheduling errors cut: ~30%
- Ops cost savings via outsourcing: 15-20%
OEMs, payers and 3PLs scale CPAP access, cut readmissions ~25% and last-mile costs ~53%
OEMs (CPAP/BiPAP/ventilator) secure device supply and training for large sleep apnea demand (~22M Americans, 2024). Payer contracts (Medicare ~67M, Medicaid ~85M, 2024) and PBMs streamline reimbursements and authorizations. Hospital/IDN liaisons enable 24–48h discharge setups, cut readmissions (~25%) and protect vs HRRP (up to 3%). 3PLs and telemonitoring reduce last-mile costs (~53%) and ops by 15–20%.
| Metric | Value (2024) |
|---|---|
| Sleep apnea prevalence | ~22M |
| Medicare enrollees | ~67M |
| Medicaid enrollees | ~85M |
| Last-mile cost share | ~53% |
| Telehealth market | $89.2B |
| Readmission reduction | ~25% |
| Ops savings via 3PL | 15–20% |
What is included in the product
 Detailed Word Document
A polished, ready-to-use Business Model Canvas for Protech Home Medical detailing value propositions, customer segments, channels, revenue and cost structures across the 9 BMC blocks, with linked SWOT, competitive advantages and investor-ready narrative to support strategy, presentations and funding discussions.

 Customizable Excel Spreadsheet
High-level view of Protech Home Medical’s business model that pinpoints patient and operational pain points and maps solutions in editable cells, speeding stakeholder alignment and decision-making.
Activities

Patient onboarding
Eligibility verification, Rx intake, and benefit checks start the onboarding—industry reports show DME payer denials averaged about 18% in 2024, making front-end checks critical. Clinical assessment and equipment matching follow established protocols to meet medical necessity. Education on device usage sets expectations and lowers return rates. Documentation ensures compliance with payer policies and supports appeals.
Delivery and setup
In-home or curbside delivery aligns with patient convenience while technicians assemble devices, fit masks, and configure settings onsite; safety checks and sanitation are completed before handoff. Initial adherence guidance targets CMS metrics of 4 hours/night on 70% of nights to reduce early drop-off and improve long-term use.

Compliance monitoring
Remote data capture logs nightly usage, leak, and AHI trends for each device and feeds dashboards used by clinicians; the remote patient monitoring market exceeded $30 billion in 2024, underscoring rapid adoption. Proactive outreach based on alerts resolves device or adherence issues before they become non-compliant, reducing service calls and penalties. Automated reminders drive timely resupply and credentialing, while standardized reports are shared with providers and payers for compliance and reimbursement audits.

Revenue cycle management
Revenue cycle management centralizes prior authorizations, accurate coding, and timely claims submission to maintain cash flow; industry 2024 benchmarks show a 7% average initial claim denial rate, with appeals overturning about 48% of denials. Robust denial prevention and appeals workflows, plus patient billing and structured payment plans, cut days in A/R by ~25% and lift collections ~12%. Analytics detect ~8% underpayment rates and reveal trend drivers for corrective action.
- Prior authorizations: centralized tracking
- Coding & claims: 7% denial benchmark
- Appeals: 48% overturn rate
- Collections: +12%, A/R down 25%
- Underpayments: ~8% identified via analytics
Maintenance and service
Routine device checks and timely repairs extend asset life and reduce total cost of ownership, supporting Protech's service margins; mask fitting and scheduled replacements increase adherence and patient comfort; formal recall management and traceability protect patient safety and regulatory standing; validated decontamination protocols ensure compliance with CDC and FDA guidance.
- 2024 US DME market ~30B
- Routine maintenance lowers failure rates
- Mask refit improves adherence
- Recall traceability required
Front-end checks cut denials 18%; RPM+RCM raise cash 12%
Front-end eligibility, Rx intake, and benefit checks cut 18% payer denial risk; clinical fit and education drive adherence. Delivery, setup, and sanitation ensure safety; RPM captures AHI, leak, usage to enable proactive outreach. Centralized RCM, appeals (48% overturn) and analytics reduce A/R 25% and lift collections 12%.
| Activity | 2024 Metric | Impact |
|---|---|---|
| DME market | $30B | Addressable |
| Payer denial | 18% | Front-end checks |
| Initial claim denial | 7% | RCM focus |
| Appeals overturn | 48% | Revenue recovery |
| Collections/A/R | +12% / -25% | Cash flow |
| Underpayments | 8% | Analytics |
Preview Before You Purchase
Business Model Canvas
The document you're previewing is the actual Protech Home Medical Business Model Canvas you will receive—it's not a mockup or sample. When you purchase, you'll get this same fully formatted, editable file ready to use in Word and Excel. No placeholders, no hidden pages—what you see is the finalized deliverable.

Deep-Dive Business Model Canvas for Home Medical Equipment Providers
Unlock the full strategic blueprint behind Protech Home Medical's business model. This in-depth Business Model Canvas reveals how the company creates value, scales revenue, and sustains competitive advantage—perfect for entrepreneurs, consultants, and investors seeking actionable insights. Download the complete Word/Excel canvas to benchmark, plan, and execute with confidence.
Partnerships
Respiratory device OEMs
Partnerships with CPAP, BiPAP, oxygen concentrator and ventilator OEMs secure access to the latest devices and volume discounts, supporting competitive margins; with an estimated 22 million Americans affected by sleep apnea in 2024, clinician demand is sizable. Co-marketing and OEM-led training accelerate clinician adoption, joint inventory planning boosts fill rates and trims stockouts, and OEM alliances streamline warranty handling and recalls.
Payers and PBMs
Contracts with Medicare (≈67 million enrollees in 2024) and Medicaid (≈85 million enrollees in 2024), plus commercial insurers, drive the bulk of Protech Home Medical’s patient volume and reimbursements. PBMs streamline resupply and formulary alignment, reducing logistics and stockouts. Joint payer-PBM collaboration cuts prior-authorization friction and lowers denial rates. Timely data sharing enables tracking for value-based arrangements and outcome-based payments.
Physicians and sleep labs
Referring pulmonologists, primary care, and AASM-accredited sleep labs are primary demand generators, with AASM estimating about 1 in 5 adults have mild OSA and 1 in 15 moderate-to-severe OSA (AASM data cited through 2024). Integrated order workflows shorten administrative steps and speed time-to-therapy, while automated compliance feedback (Medicare adherence: ≥4 hours/night on 70% of nights within 90 days) improves clinical outcomes. Educational partnerships with physicians and labs build trust and referral stickiness by aligning care pathways and CPAP adherence support.
Hospitals and post-acute networks
- 24–48h setup SLA
- Embedded liaisons cut readmissions/LOS
- Supports IDN discharge workflows
- Protects against up to 3% HRRP penalties
Logistics and telehealth vendors
Third-party logistics handle last-mile across wide geographies, with last-mile representing up to 53% of delivery costs and outsourcing cutting ops costs 15-20% in 2024 benchmarks. Telemonitoring platforms—in the $89.2B global telehealth market (2024)—enable remote compliance tracking and can lower readmissions ~25%. API integrations unify scheduling, routing and patient engagement, reducing scheduling errors ~30% and enabling scalable operations.
- Last-mile cost share: 53%
- Telehealth market (2024): $89.2B
- Readmission reduction: ~25%
- Scheduling errors cut: ~30%
- Ops cost savings via outsourcing: 15-20%
OEMs, payers and 3PLs scale CPAP access, cut readmissions ~25% and last-mile costs ~53%
OEMs (CPAP/BiPAP/ventilator) secure device supply and training for large sleep apnea demand (~22M Americans, 2024). Payer contracts (Medicare ~67M, Medicaid ~85M, 2024) and PBMs streamline reimbursements and authorizations. Hospital/IDN liaisons enable 24–48h discharge setups, cut readmissions (~25%) and protect vs HRRP (up to 3%). 3PLs and telemonitoring reduce last-mile costs (~53%) and ops by 15–20%.
| Metric | Value (2024) |
|---|---|
| Sleep apnea prevalence | ~22M |
| Medicare enrollees | ~67M |
| Medicaid enrollees | ~85M |
| Last-mile cost share | ~53% |
| Telehealth market | $89.2B |
| Readmission reduction | ~25% |
| Ops savings via 3PL | 15–20% |
What is included in the product
Detailed Word Document
A polished, ready-to-use Business Model Canvas for Protech Home Medical detailing value propositions, customer segments, channels, revenue and cost structures across the 9 BMC blocks, with linked SWOT, competitive advantages and investor-ready narrative to support strategy, presentations and funding discussions.
Customizable Excel Spreadsheet
High-level view of Protech Home Medical’s business model that pinpoints patient and operational pain points and maps solutions in editable cells, speeding stakeholder alignment and decision-making.
Activities
Patient onboarding
Eligibility verification, Rx intake, and benefit checks start the onboarding—industry reports show DME payer denials averaged about 18% in 2024, making front-end checks critical. Clinical assessment and equipment matching follow established protocols to meet medical necessity. Education on device usage sets expectations and lowers return rates. Documentation ensures compliance with payer policies and supports appeals.
Delivery and setup
In-home or curbside delivery aligns with patient convenience while technicians assemble devices, fit masks, and configure settings onsite; safety checks and sanitation are completed before handoff. Initial adherence guidance targets CMS metrics of 4 hours/night on 70% of nights to reduce early drop-off and improve long-term use.
Compliance monitoring
Remote data capture logs nightly usage, leak, and AHI trends for each device and feeds dashboards used by clinicians; the remote patient monitoring market exceeded $30 billion in 2024, underscoring rapid adoption. Proactive outreach based on alerts resolves device or adherence issues before they become non-compliant, reducing service calls and penalties. Automated reminders drive timely resupply and credentialing, while standardized reports are shared with providers and payers for compliance and reimbursement audits.
Revenue cycle management
Revenue cycle management centralizes prior authorizations, accurate coding, and timely claims submission to maintain cash flow; industry 2024 benchmarks show a 7% average initial claim denial rate, with appeals overturning about 48% of denials. Robust denial prevention and appeals workflows, plus patient billing and structured payment plans, cut days in A/R by ~25% and lift collections ~12%. Analytics detect ~8% underpayment rates and reveal trend drivers for corrective action.
- Prior authorizations: centralized tracking
- Coding & claims: 7% denial benchmark
- Appeals: 48% overturn rate
- Collections: +12%, A/R down 25%
- Underpayments: ~8% identified via analytics
Maintenance and service
Routine device checks and timely repairs extend asset life and reduce total cost of ownership, supporting Protech's service margins; mask fitting and scheduled replacements increase adherence and patient comfort; formal recall management and traceability protect patient safety and regulatory standing; validated decontamination protocols ensure compliance with CDC and FDA guidance.
- 2024 US DME market ~30B
- Routine maintenance lowers failure rates
- Mask refit improves adherence
- Recall traceability required
Front-end checks cut denials 18%; RPM+RCM raise cash 12%
Front-end eligibility, Rx intake, and benefit checks cut 18% payer denial risk; clinical fit and education drive adherence. Delivery, setup, and sanitation ensure safety; RPM captures AHI, leak, usage to enable proactive outreach. Centralized RCM, appeals (48% overturn) and analytics reduce A/R 25% and lift collections 12%.
| Activity | 2024 Metric | Impact |
|---|---|---|
| DME market | $30B | Addressable |
| Payer denial | 18% | Front-end checks |
| Initial claim denial | 7% | RCM focus |
| Appeals overturn | 48% | Revenue recovery |
| Collections/A/R | +12% / -25% | Cash flow |
| Underpayments | 8% | Analytics |
Preview Before You Purchase
Business Model Canvas
The document you're previewing is the actual Protech Home Medical Business Model Canvas you will receive—it's not a mockup or sample. When you purchase, you'll get this same fully formatted, editable file ready to use in Word and Excel. No placeholders, no hidden pages—what you see is the finalized deliverable.
Original: $10.00
-65%$10.00
$3.50Description
Deep-Dive Business Model Canvas for Home Medical Equipment Providers
Unlock the full strategic blueprint behind Protech Home Medical's business model. This in-depth Business Model Canvas reveals how the company creates value, scales revenue, and sustains competitive advantage—perfect for entrepreneurs, consultants, and investors seeking actionable insights. Download the complete Word/Excel canvas to benchmark, plan, and execute with confidence.
Partnerships
Respiratory device OEMs
Partnerships with CPAP, BiPAP, oxygen concentrator and ventilator OEMs secure access to the latest devices and volume discounts, supporting competitive margins; with an estimated 22 million Americans affected by sleep apnea in 2024, clinician demand is sizable. Co-marketing and OEM-led training accelerate clinician adoption, joint inventory planning boosts fill rates and trims stockouts, and OEM alliances streamline warranty handling and recalls.
Payers and PBMs
Contracts with Medicare (≈67 million enrollees in 2024) and Medicaid (≈85 million enrollees in 2024), plus commercial insurers, drive the bulk of Protech Home Medical’s patient volume and reimbursements. PBMs streamline resupply and formulary alignment, reducing logistics and stockouts. Joint payer-PBM collaboration cuts prior-authorization friction and lowers denial rates. Timely data sharing enables tracking for value-based arrangements and outcome-based payments.
Physicians and sleep labs
Referring pulmonologists, primary care, and AASM-accredited sleep labs are primary demand generators, with AASM estimating about 1 in 5 adults have mild OSA and 1 in 15 moderate-to-severe OSA (AASM data cited through 2024). Integrated order workflows shorten administrative steps and speed time-to-therapy, while automated compliance feedback (Medicare adherence: ≥4 hours/night on 70% of nights within 90 days) improves clinical outcomes. Educational partnerships with physicians and labs build trust and referral stickiness by aligning care pathways and CPAP adherence support.
Hospitals and post-acute networks
- 24–48h setup SLA
- Embedded liaisons cut readmissions/LOS
- Supports IDN discharge workflows
- Protects against up to 3% HRRP penalties
Logistics and telehealth vendors
Third-party logistics handle last-mile across wide geographies, with last-mile representing up to 53% of delivery costs and outsourcing cutting ops costs 15-20% in 2024 benchmarks. Telemonitoring platforms—in the $89.2B global telehealth market (2024)—enable remote compliance tracking and can lower readmissions ~25%. API integrations unify scheduling, routing and patient engagement, reducing scheduling errors ~30% and enabling scalable operations.
- Last-mile cost share: 53%
- Telehealth market (2024): $89.2B
- Readmission reduction: ~25%
- Scheduling errors cut: ~30%
- Ops cost savings via outsourcing: 15-20%
OEMs, payers and 3PLs scale CPAP access, cut readmissions ~25% and last-mile costs ~53%
OEMs (CPAP/BiPAP/ventilator) secure device supply and training for large sleep apnea demand (~22M Americans, 2024). Payer contracts (Medicare ~67M, Medicaid ~85M, 2024) and PBMs streamline reimbursements and authorizations. Hospital/IDN liaisons enable 24–48h discharge setups, cut readmissions (~25%) and protect vs HRRP (up to 3%). 3PLs and telemonitoring reduce last-mile costs (~53%) and ops by 15–20%.
| Metric | Value (2024) |
|---|---|
| Sleep apnea prevalence | ~22M |
| Medicare enrollees | ~67M |
| Medicaid enrollees | ~85M |
| Last-mile cost share | ~53% |
| Telehealth market | $89.2B |
| Readmission reduction | ~25% |
| Ops savings via 3PL | 15–20% |
What is included in the product
Detailed Word Document
A polished, ready-to-use Business Model Canvas for Protech Home Medical detailing value propositions, customer segments, channels, revenue and cost structures across the 9 BMC blocks, with linked SWOT, competitive advantages and investor-ready narrative to support strategy, presentations and funding discussions.
Customizable Excel Spreadsheet
High-level view of Protech Home Medical’s business model that pinpoints patient and operational pain points and maps solutions in editable cells, speeding stakeholder alignment and decision-making.
Activities
Patient onboarding
Eligibility verification, Rx intake, and benefit checks start the onboarding—industry reports show DME payer denials averaged about 18% in 2024, making front-end checks critical. Clinical assessment and equipment matching follow established protocols to meet medical necessity. Education on device usage sets expectations and lowers return rates. Documentation ensures compliance with payer policies and supports appeals.
Delivery and setup
In-home or curbside delivery aligns with patient convenience while technicians assemble devices, fit masks, and configure settings onsite; safety checks and sanitation are completed before handoff. Initial adherence guidance targets CMS metrics of 4 hours/night on 70% of nights to reduce early drop-off and improve long-term use.
Compliance monitoring
Remote data capture logs nightly usage, leak, and AHI trends for each device and feeds dashboards used by clinicians; the remote patient monitoring market exceeded $30 billion in 2024, underscoring rapid adoption. Proactive outreach based on alerts resolves device or adherence issues before they become non-compliant, reducing service calls and penalties. Automated reminders drive timely resupply and credentialing, while standardized reports are shared with providers and payers for compliance and reimbursement audits.
Revenue cycle management
Revenue cycle management centralizes prior authorizations, accurate coding, and timely claims submission to maintain cash flow; industry 2024 benchmarks show a 7% average initial claim denial rate, with appeals overturning about 48% of denials. Robust denial prevention and appeals workflows, plus patient billing and structured payment plans, cut days in A/R by ~25% and lift collections ~12%. Analytics detect ~8% underpayment rates and reveal trend drivers for corrective action.
- Prior authorizations: centralized tracking
- Coding & claims: 7% denial benchmark
- Appeals: 48% overturn rate
- Collections: +12%, A/R down 25%
- Underpayments: ~8% identified via analytics
Maintenance and service
Routine device checks and timely repairs extend asset life and reduce total cost of ownership, supporting Protech's service margins; mask fitting and scheduled replacements increase adherence and patient comfort; formal recall management and traceability protect patient safety and regulatory standing; validated decontamination protocols ensure compliance with CDC and FDA guidance.
- 2024 US DME market ~30B
- Routine maintenance lowers failure rates
- Mask refit improves adherence
- Recall traceability required
Front-end checks cut denials 18%; RPM+RCM raise cash 12%
Front-end eligibility, Rx intake, and benefit checks cut 18% payer denial risk; clinical fit and education drive adherence. Delivery, setup, and sanitation ensure safety; RPM captures AHI, leak, usage to enable proactive outreach. Centralized RCM, appeals (48% overturn) and analytics reduce A/R 25% and lift collections 12%.
| Activity | 2024 Metric | Impact |
|---|---|---|
| DME market | $30B | Addressable |
| Payer denial | 18% | Front-end checks |
| Initial claim denial | 7% | RCM focus |
| Appeals overturn | 48% | Revenue recovery |
| Collections/A/R | +12% / -25% | Cash flow |
| Underpayments | 8% | Analytics |
Preview Before You Purchase
Business Model Canvas
The document you're previewing is the actual Protech Home Medical Business Model Canvas you will receive—it's not a mockup or sample. When you purchase, you'll get this same fully formatted, editable file ready to use in Word and Excel. No placeholders, no hidden pages—what you see is the finalized deliverable.











