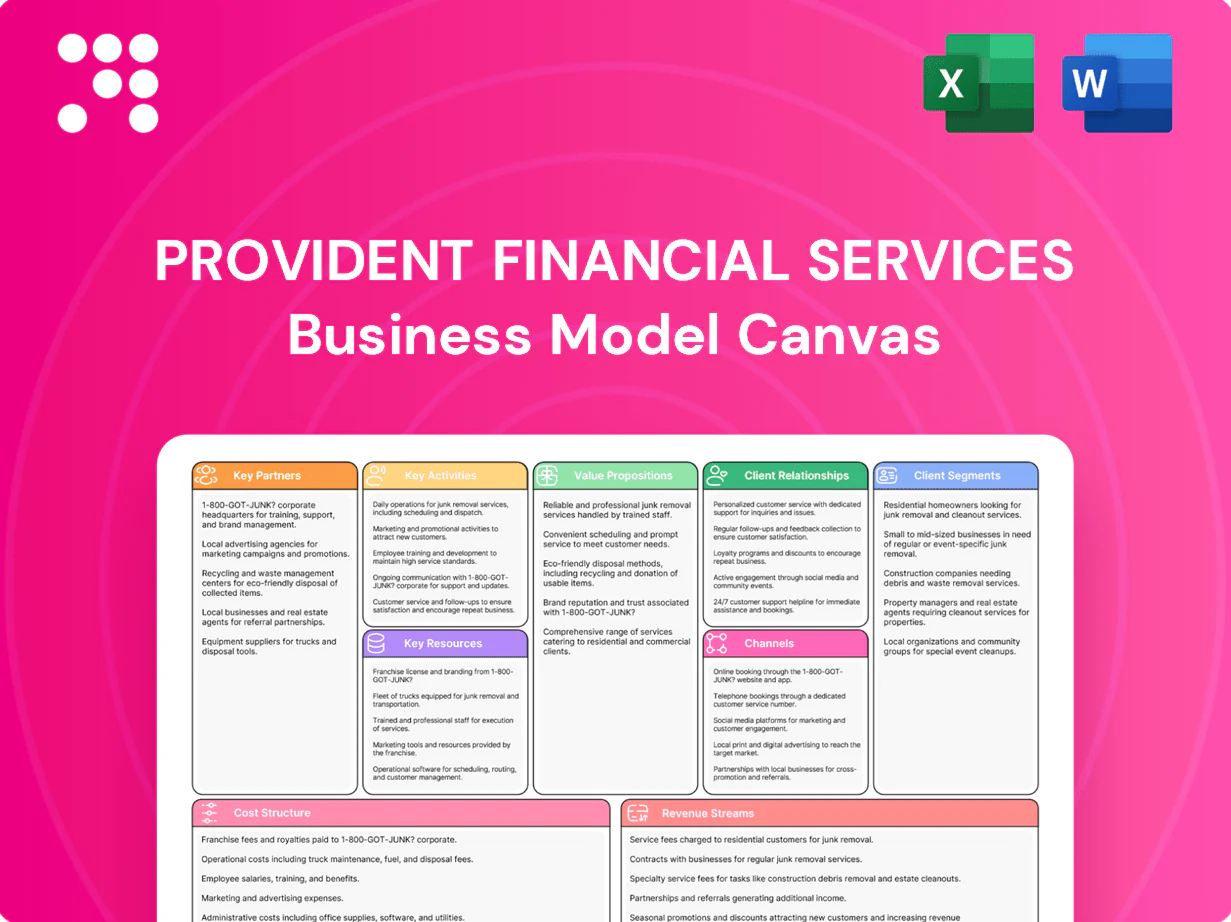
Provident Financial Services Business Model Canvas

Unlock the full strategic blueprint: Business Model Canvas for investors and founders
Unlock the full strategic blueprint behind Provident Financial Services with our Business Model Canvas. This concise, downloadable canvas maps value propositions, customer segments, revenue streams and key partners—perfect for investors, consultants and founders seeking actionable, ready-to-use insights. Purchase the complete file now.
Partnerships

Banking regulators & examiners
Regulatory bodies such as the FDIC, Federal Reserve and state banking departments set oversight and guidelines, including the FDIC deposit insurance limit of 250,000 and Basel-derived CET1 minimum of 4.5% plus a 2.5% conservation buffer. Strong relationships secure timely approvals and compliance clarity, reducing regulatory risk and enhancing consumer trust. Ongoing dialogue with examiners supports safe growth and faster, compliant product launches.
Fintech platforms & core processors
Fintech platforms and core processors supply Provident Financial Services with core banking, digital onboarding, payment rails, and fraud tools that drive operational efficiency and scalability. 2024 industry benchmarks show API-led integrations can cut development time by about 40% and lower implementation costs roughly 30%, accelerating feature delivery. Continuous co-innovation with partners refines UX and reduces time-to-market for new services.

Secondary market & loan investors
Relationships with agencies and whole-loan buyers let Provident manage the balance sheet by selling or securitizing mortgages, tapping a roughly $8.7 trillion agency MBS market in 2024. These sales improve liquidity and capital ratios by removing loans from RWAs and freeing funding capacity. They enable interest-rate risk management via duration transfers and hedges. Execution partners stabilize pricing and pipeline execution.

Insurance, brokerage, and wealth partners
Allied insurance, brokerage, and wealth partners expand Provident's noninterest offerings, enabling cross-selling of wealth and protection products that McKinsey 2024 found increases product holdings per client by about 25%. Revenue-sharing diversifies fee income while partners supply licensed capabilities and specialized advisory expertise, boosting retention.
- Allied providers expand noninterest revenue
- Cross-selling deepens client relationships (McKinsey 2024: ~25% uplift)
- Revenue sharing diversifies income
- Partners provide licensed expertise
Community organizations & business associations
Local nonprofits, chambers, and civic groups deepen Provident Financial Services community presence and support CRA initiatives and small-business outreach, leveraging relationships with over 30 million U.S. small businesses (2024) to expand reach.
- Strengthens community presence
- Supports CRA & small-business outreach
- Builds goodwill and referral pipelines
- Joint programs advance financial inclusion & education
Regulators set $250k coverage; cores cut dev 40%, MBS liquidity $8.7T
Regulators (FDIC, Fed, state) enforce deposit insurance $250,000 and CET1 target ~7%, ensuring capital/compliance. Fintechs/core processors cut dev time ~40% and costs ~30% via API integrations, speeding digital rollout. Agency buyers access $8.7T MBS market, improving liquidity; allied wealth/insurance partnerships lift per-client product holdings ~25% (McKinsey 2024).
| Partner | Role | 2024 metric |
|---|---|---|
| Regulators | Oversight | $250k deposit limit; CET1 ~7% |
| Fintechs | Core & APIs | -40% dev time,-30% cost |
| Agency buyers | Liquidity | $8.7T MBS market |
| Wealth/insurers | Cross-sell | +25% products/client |
What is included in the product
 Detailed Word Document
A comprehensive Business Model Canvas for Provident Financial Services that maps all 9 BMC blocks—customer segments, value propositions, channels, revenue streams, key resources, activities, partners, cost structure and customer relationships—while linking competitive advantages and SWOT insights to support presentations, investor discussions and strategic decision-making.

 Customizable Excel Spreadsheet
Editable one-page Business Model Canvas that distills Provident Financial Services’ customer segments, revenue streams, and risk controls into a clean, shareable layout—saves hours of structuring and speeds boardroom decisions. Ideal for quick comparisons, team collaboration, and fast executive summaries.
Activities

Deposit gathering & liquidity management
Design and price checking, savings and money‑market accounts to secure stable funding, targeting a diversified deposit mix as US bank deposits hovered near $17 trillion in 2024 while the fed funds target was 5.25–5.50% (Dec 2024). Manage liquidity buffers and daily cash flow to meet stress scenarios, monitor cost of funds and deposit beta to protect NIM, and execute ALM strategies (duration, hedges, repricing) to maintain margins.
Lending origination & underwriting
Sourcing and evaluating residential mortgages, CRE and commercial loans, Provident emphasizes diversified channels and stress-testing against 2024 market conditions, including a 30-year mortgage rate near 7% in 2024. Underwriting applies firm credit policies and quantitative risk scoring to limit concentration and expected-loss exposure. Terms are structured to match borrower cash flow and risk appetite while documentation and collateral perfection are confirmed before funding.

Risk, compliance & audit
Maintains regulatory compliance across BSA/AML, fair lending and consumer protection with ongoing monitoring and policy updates; Provident reported total assets of $13.6 billion in 2024 supporting scale of controls. Runs regular internal controls and audits and conducts quarterly stress tests of credit and interest-rate exposure, including scenario-driven capital impact analysis. Remediates findings promptly and upgrades frameworks, reducing repeat audit issues and strengthening governance.

Digital banking & customer experience
Operating mobile and online platforms for account opening, payments and servicing drives acquisition and retention; in 2024 banks prioritized seamless onboarding and instant payments to cut drop-off. Enhancing UX uses analytics and NPS/feedback loops to raise engagement; security, multifactor authentication and machine-learning fraud prevention reduce losses. New features are rolled out iteratively via A/B testing and CI/CD pipelines.
Treasury, ALM & capital optimization
Treasury manages securities portfolios and interest-rate hedging to protect duration risk and maintain a target net interest margin, aiming near 3.0% industry NIM in 2024; asset/liability pricing is tightened to preserve spreads. Capital optimization balances growth with regulatory CET1 targets (around 13% industry median in 2024) while optimizing funding mix and contingency liquidity plans.
- securities & hedges
- pricing to protect NIM ~3.0% (2024)
- CET1 ~13% (2024)
- funding mix & contingency plans
Deposit pricing, liquidity and ALM hedges to protect NIM in higher-rate 2024 market
Design/pricing of deposit products to secure diversified funding as US bank deposits approached 17T in 2024 and fed funds were 5.25–5.50%; manage liquidity, deposit beta and ALM hedges to protect NIM. Originate and underwrite residential, CRE and commercial loans with stress tests (30y rate ~7%) and strict credit scoring. Maintain BSA/AML, fair lending, quarterly stress tests and CI/CD digital servicing with MFA and ML fraud controls.
| Metric | 2024 |
|---|---|
| Total assets | $13.6B |
| US bank deposits | $17T |
| Fed funds | 5.25–5.50% |
| 30y mortgage | ~7% |
| Industry NIM | ~3.0% |
| Industry CET1 | ~13% |
Full Document Unlocks After Purchase
Business Model Canvas
The document previewed here is the exact Provident Financial Services Business Model Canvas you will receive—this is not a mockup or sample. Upon purchase you’ll instantly download the full, editable file formatted exactly as shown, ready for presentation, editing, or sharing.

Unlock the full strategic blueprint: Business Model Canvas for investors and founders
Unlock the full strategic blueprint behind Provident Financial Services with our Business Model Canvas. This concise, downloadable canvas maps value propositions, customer segments, revenue streams and key partners—perfect for investors, consultants and founders seeking actionable, ready-to-use insights. Purchase the complete file now.
Partnerships
Banking regulators & examiners
Regulatory bodies such as the FDIC, Federal Reserve and state banking departments set oversight and guidelines, including the FDIC deposit insurance limit of 250,000 and Basel-derived CET1 minimum of 4.5% plus a 2.5% conservation buffer. Strong relationships secure timely approvals and compliance clarity, reducing regulatory risk and enhancing consumer trust. Ongoing dialogue with examiners supports safe growth and faster, compliant product launches.
Fintech platforms & core processors
Fintech platforms and core processors supply Provident Financial Services with core banking, digital onboarding, payment rails, and fraud tools that drive operational efficiency and scalability. 2024 industry benchmarks show API-led integrations can cut development time by about 40% and lower implementation costs roughly 30%, accelerating feature delivery. Continuous co-innovation with partners refines UX and reduces time-to-market for new services.
Secondary market & loan investors
Relationships with agencies and whole-loan buyers let Provident manage the balance sheet by selling or securitizing mortgages, tapping a roughly $8.7 trillion agency MBS market in 2024. These sales improve liquidity and capital ratios by removing loans from RWAs and freeing funding capacity. They enable interest-rate risk management via duration transfers and hedges. Execution partners stabilize pricing and pipeline execution.
Insurance, brokerage, and wealth partners
Allied insurance, brokerage, and wealth partners expand Provident's noninterest offerings, enabling cross-selling of wealth and protection products that McKinsey 2024 found increases product holdings per client by about 25%. Revenue-sharing diversifies fee income while partners supply licensed capabilities and specialized advisory expertise, boosting retention.
- Allied providers expand noninterest revenue
- Cross-selling deepens client relationships (McKinsey 2024: ~25% uplift)
- Revenue sharing diversifies income
- Partners provide licensed expertise
Community organizations & business associations
Local nonprofits, chambers, and civic groups deepen Provident Financial Services community presence and support CRA initiatives and small-business outreach, leveraging relationships with over 30 million U.S. small businesses (2024) to expand reach.
- Strengthens community presence
- Supports CRA & small-business outreach
- Builds goodwill and referral pipelines
- Joint programs advance financial inclusion & education
Regulators set $250k coverage; cores cut dev 40%, MBS liquidity $8.7T
Regulators (FDIC, Fed, state) enforce deposit insurance $250,000 and CET1 target ~7%, ensuring capital/compliance. Fintechs/core processors cut dev time ~40% and costs ~30% via API integrations, speeding digital rollout. Agency buyers access $8.7T MBS market, improving liquidity; allied wealth/insurance partnerships lift per-client product holdings ~25% (McKinsey 2024).
| Partner | Role | 2024 metric |
|---|---|---|
| Regulators | Oversight | $250k deposit limit; CET1 ~7% |
| Fintechs | Core & APIs | -40% dev time,-30% cost |
| Agency buyers | Liquidity | $8.7T MBS market |
| Wealth/insurers | Cross-sell | +25% products/client |
What is included in the product
Detailed Word Document
A comprehensive Business Model Canvas for Provident Financial Services that maps all 9 BMC blocks—customer segments, value propositions, channels, revenue streams, key resources, activities, partners, cost structure and customer relationships—while linking competitive advantages and SWOT insights to support presentations, investor discussions and strategic decision-making.
Customizable Excel Spreadsheet
Editable one-page Business Model Canvas that distills Provident Financial Services’ customer segments, revenue streams, and risk controls into a clean, shareable layout—saves hours of structuring and speeds boardroom decisions. Ideal for quick comparisons, team collaboration, and fast executive summaries.
Activities
Deposit gathering & liquidity management
Design and price checking, savings and money‑market accounts to secure stable funding, targeting a diversified deposit mix as US bank deposits hovered near $17 trillion in 2024 while the fed funds target was 5.25–5.50% (Dec 2024). Manage liquidity buffers and daily cash flow to meet stress scenarios, monitor cost of funds and deposit beta to protect NIM, and execute ALM strategies (duration, hedges, repricing) to maintain margins.
Lending origination & underwriting
Sourcing and evaluating residential mortgages, CRE and commercial loans, Provident emphasizes diversified channels and stress-testing against 2024 market conditions, including a 30-year mortgage rate near 7% in 2024. Underwriting applies firm credit policies and quantitative risk scoring to limit concentration and expected-loss exposure. Terms are structured to match borrower cash flow and risk appetite while documentation and collateral perfection are confirmed before funding.
Risk, compliance & audit
Maintains regulatory compliance across BSA/AML, fair lending and consumer protection with ongoing monitoring and policy updates; Provident reported total assets of $13.6 billion in 2024 supporting scale of controls. Runs regular internal controls and audits and conducts quarterly stress tests of credit and interest-rate exposure, including scenario-driven capital impact analysis. Remediates findings promptly and upgrades frameworks, reducing repeat audit issues and strengthening governance.
Digital banking & customer experience
Operating mobile and online platforms for account opening, payments and servicing drives acquisition and retention; in 2024 banks prioritized seamless onboarding and instant payments to cut drop-off. Enhancing UX uses analytics and NPS/feedback loops to raise engagement; security, multifactor authentication and machine-learning fraud prevention reduce losses. New features are rolled out iteratively via A/B testing and CI/CD pipelines.
Treasury, ALM & capital optimization
Treasury manages securities portfolios and interest-rate hedging to protect duration risk and maintain a target net interest margin, aiming near 3.0% industry NIM in 2024; asset/liability pricing is tightened to preserve spreads. Capital optimization balances growth with regulatory CET1 targets (around 13% industry median in 2024) while optimizing funding mix and contingency liquidity plans.
- securities & hedges
- pricing to protect NIM ~3.0% (2024)
- CET1 ~13% (2024)
- funding mix & contingency plans
Deposit pricing, liquidity and ALM hedges to protect NIM in higher-rate 2024 market
Design/pricing of deposit products to secure diversified funding as US bank deposits approached 17T in 2024 and fed funds were 5.25–5.50%; manage liquidity, deposit beta and ALM hedges to protect NIM. Originate and underwrite residential, CRE and commercial loans with stress tests (30y rate ~7%) and strict credit scoring. Maintain BSA/AML, fair lending, quarterly stress tests and CI/CD digital servicing with MFA and ML fraud controls.
| Metric | 2024 |
|---|---|
| Total assets | $13.6B |
| US bank deposits | $17T |
| Fed funds | 5.25–5.50% |
| 30y mortgage | ~7% |
| Industry NIM | ~3.0% |
| Industry CET1 | ~13% |
Full Document Unlocks After Purchase
Business Model Canvas
The document previewed here is the exact Provident Financial Services Business Model Canvas you will receive—this is not a mockup or sample. Upon purchase you’ll instantly download the full, editable file formatted exactly as shown, ready for presentation, editing, or sharing.
Original: $10.00
-65%$10.00
$3.50Description
Unlock the full strategic blueprint: Business Model Canvas for investors and founders
Unlock the full strategic blueprint behind Provident Financial Services with our Business Model Canvas. This concise, downloadable canvas maps value propositions, customer segments, revenue streams and key partners—perfect for investors, consultants and founders seeking actionable, ready-to-use insights. Purchase the complete file now.
Partnerships
Banking regulators & examiners
Regulatory bodies such as the FDIC, Federal Reserve and state banking departments set oversight and guidelines, including the FDIC deposit insurance limit of 250,000 and Basel-derived CET1 minimum of 4.5% plus a 2.5% conservation buffer. Strong relationships secure timely approvals and compliance clarity, reducing regulatory risk and enhancing consumer trust. Ongoing dialogue with examiners supports safe growth and faster, compliant product launches.
Fintech platforms & core processors
Fintech platforms and core processors supply Provident Financial Services with core banking, digital onboarding, payment rails, and fraud tools that drive operational efficiency and scalability. 2024 industry benchmarks show API-led integrations can cut development time by about 40% and lower implementation costs roughly 30%, accelerating feature delivery. Continuous co-innovation with partners refines UX and reduces time-to-market for new services.
Secondary market & loan investors
Relationships with agencies and whole-loan buyers let Provident manage the balance sheet by selling or securitizing mortgages, tapping a roughly $8.7 trillion agency MBS market in 2024. These sales improve liquidity and capital ratios by removing loans from RWAs and freeing funding capacity. They enable interest-rate risk management via duration transfers and hedges. Execution partners stabilize pricing and pipeline execution.
Insurance, brokerage, and wealth partners
Allied insurance, brokerage, and wealth partners expand Provident's noninterest offerings, enabling cross-selling of wealth and protection products that McKinsey 2024 found increases product holdings per client by about 25%. Revenue-sharing diversifies fee income while partners supply licensed capabilities and specialized advisory expertise, boosting retention.
- Allied providers expand noninterest revenue
- Cross-selling deepens client relationships (McKinsey 2024: ~25% uplift)
- Revenue sharing diversifies income
- Partners provide licensed expertise
Community organizations & business associations
Local nonprofits, chambers, and civic groups deepen Provident Financial Services community presence and support CRA initiatives and small-business outreach, leveraging relationships with over 30 million U.S. small businesses (2024) to expand reach.
- Strengthens community presence
- Supports CRA & small-business outreach
- Builds goodwill and referral pipelines
- Joint programs advance financial inclusion & education
Regulators set $250k coverage; cores cut dev 40%, MBS liquidity $8.7T
Regulators (FDIC, Fed, state) enforce deposit insurance $250,000 and CET1 target ~7%, ensuring capital/compliance. Fintechs/core processors cut dev time ~40% and costs ~30% via API integrations, speeding digital rollout. Agency buyers access $8.7T MBS market, improving liquidity; allied wealth/insurance partnerships lift per-client product holdings ~25% (McKinsey 2024).
| Partner | Role | 2024 metric |
|---|---|---|
| Regulators | Oversight | $250k deposit limit; CET1 ~7% |
| Fintechs | Core & APIs | -40% dev time,-30% cost |
| Agency buyers | Liquidity | $8.7T MBS market |
| Wealth/insurers | Cross-sell | +25% products/client |
What is included in the product
Detailed Word Document
A comprehensive Business Model Canvas for Provident Financial Services that maps all 9 BMC blocks—customer segments, value propositions, channels, revenue streams, key resources, activities, partners, cost structure and customer relationships—while linking competitive advantages and SWOT insights to support presentations, investor discussions and strategic decision-making.
Customizable Excel Spreadsheet
Editable one-page Business Model Canvas that distills Provident Financial Services’ customer segments, revenue streams, and risk controls into a clean, shareable layout—saves hours of structuring and speeds boardroom decisions. Ideal for quick comparisons, team collaboration, and fast executive summaries.
Activities
Deposit gathering & liquidity management
Design and price checking, savings and money‑market accounts to secure stable funding, targeting a diversified deposit mix as US bank deposits hovered near $17 trillion in 2024 while the fed funds target was 5.25–5.50% (Dec 2024). Manage liquidity buffers and daily cash flow to meet stress scenarios, monitor cost of funds and deposit beta to protect NIM, and execute ALM strategies (duration, hedges, repricing) to maintain margins.
Lending origination & underwriting
Sourcing and evaluating residential mortgages, CRE and commercial loans, Provident emphasizes diversified channels and stress-testing against 2024 market conditions, including a 30-year mortgage rate near 7% in 2024. Underwriting applies firm credit policies and quantitative risk scoring to limit concentration and expected-loss exposure. Terms are structured to match borrower cash flow and risk appetite while documentation and collateral perfection are confirmed before funding.
Risk, compliance & audit
Maintains regulatory compliance across BSA/AML, fair lending and consumer protection with ongoing monitoring and policy updates; Provident reported total assets of $13.6 billion in 2024 supporting scale of controls. Runs regular internal controls and audits and conducts quarterly stress tests of credit and interest-rate exposure, including scenario-driven capital impact analysis. Remediates findings promptly and upgrades frameworks, reducing repeat audit issues and strengthening governance.
Digital banking & customer experience
Operating mobile and online platforms for account opening, payments and servicing drives acquisition and retention; in 2024 banks prioritized seamless onboarding and instant payments to cut drop-off. Enhancing UX uses analytics and NPS/feedback loops to raise engagement; security, multifactor authentication and machine-learning fraud prevention reduce losses. New features are rolled out iteratively via A/B testing and CI/CD pipelines.
Treasury, ALM & capital optimization
Treasury manages securities portfolios and interest-rate hedging to protect duration risk and maintain a target net interest margin, aiming near 3.0% industry NIM in 2024; asset/liability pricing is tightened to preserve spreads. Capital optimization balances growth with regulatory CET1 targets (around 13% industry median in 2024) while optimizing funding mix and contingency liquidity plans.
- securities & hedges
- pricing to protect NIM ~3.0% (2024)
- CET1 ~13% (2024)
- funding mix & contingency plans
Deposit pricing, liquidity and ALM hedges to protect NIM in higher-rate 2024 market
Design/pricing of deposit products to secure diversified funding as US bank deposits approached 17T in 2024 and fed funds were 5.25–5.50%; manage liquidity, deposit beta and ALM hedges to protect NIM. Originate and underwrite residential, CRE and commercial loans with stress tests (30y rate ~7%) and strict credit scoring. Maintain BSA/AML, fair lending, quarterly stress tests and CI/CD digital servicing with MFA and ML fraud controls.
| Metric | 2024 |
|---|---|
| Total assets | $13.6B |
| US bank deposits | $17T |
| Fed funds | 5.25–5.50% |
| 30y mortgage | ~7% |
| Industry NIM | ~3.0% |
| Industry CET1 | ~13% |
Full Document Unlocks After Purchase
Business Model Canvas
The document previewed here is the exact Provident Financial Services Business Model Canvas you will receive—this is not a mockup or sample. Upon purchase you’ll instantly download the full, editable file formatted exactly as shown, ready for presentation, editing, or sharing.











