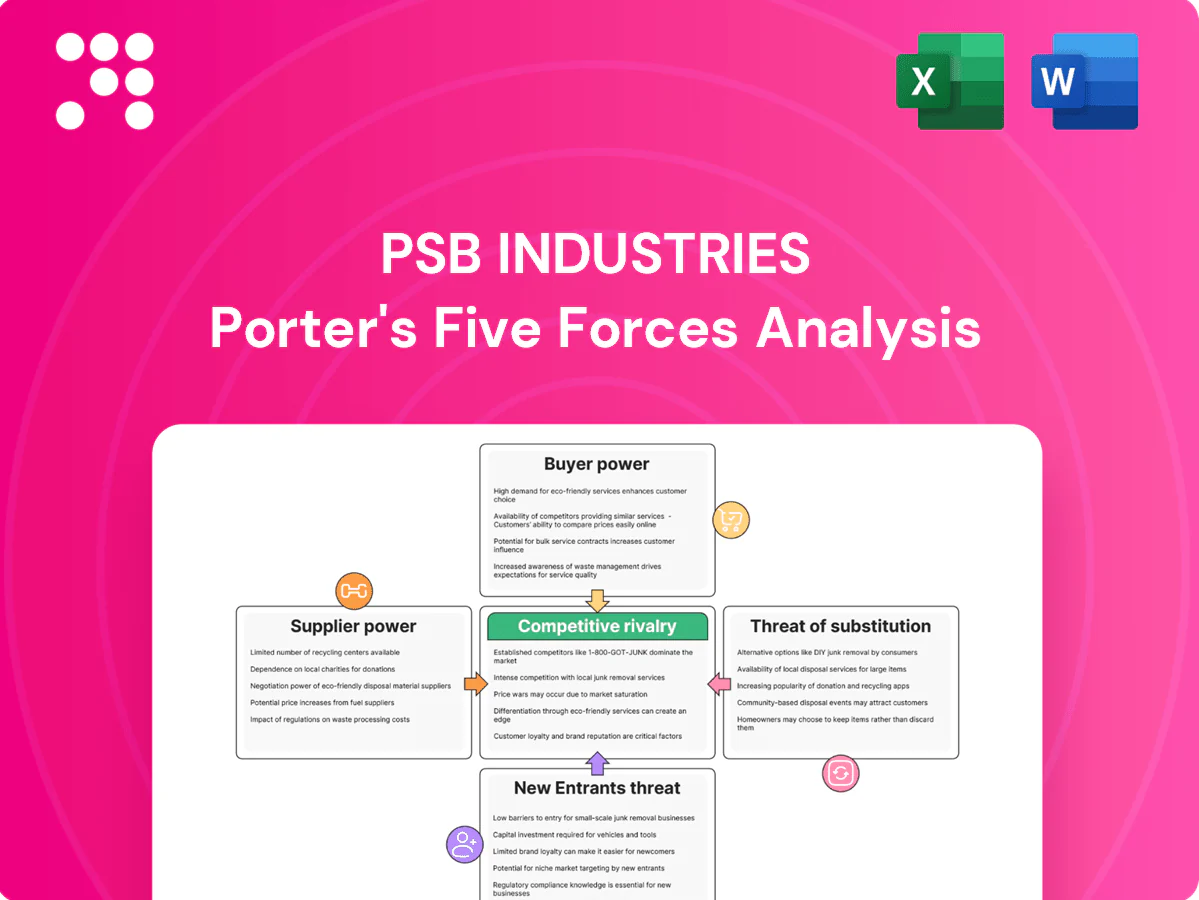
PSB Industries Porter's Five Forces Analysis

Don't Miss the Bigger Picture
PSB Industries faces moderate buyer power, concentrated suppliers for specialty components, and niche substitute threats that together shape tight margin pressure and innovation-driven competition. Competitive rivalry is intense among regional peers, while barriers to entry remain mixed due to regulatory and capital requirements. This brief snapshot only scratches the surface—unlock the full Porter's Five Forces Analysis for detailed ratings, visuals, and strategic actions.
Suppliers Bargaining Power

Concentrated resin and specialty inputs
PSB depends on petrochemical resins (top producers like LyondellBasell, SABIC, INEOS), paperboard, glass, pigments and specialty additives where the top 5 suppliers hold roughly 50–60% of global capacity, concentrating price-setting power. 2024 volatility—Brent averaging about $86/barrel and NBSK pulp near $850/ton—amplified supplier leverage. Hedging and multi-sourcing reduce but do not eliminate spike exposure.
Tooling, molds, and equipment lock-in
Custom molds and high-spec machinery create switching frictions and lead times of 8–26 weeks, elevating supplier leverage over PSB. Re-qualification for beauty and healthcare lines can take 3–12 months and be costly, reinforcing lock-in. OEM service contracts and spare-parts dependency further strengthen supplier power. PSB mitigates this via standardized platforms and dual-approved tools.

Regulatory-grade chemicals and compliance
REACH (≈22,000 substances registered in 2024) and CLP plus pharma‑grade input requirements shrink qualified supplier pools, concentrating supplier power. Compliance documentation and batch traceability extend supplier qualification cycles to 6–12 months, raising switching costs and operational risk. Certified suppliers commonly command 5–15% premiums, while long‑term technical partnerships can trade price for reliability, cutting volatility-related costs by up to ~10%.

Sustainability-grade materials constraints
Sustainability-grade materials—recycled content, bio-based polymers and low-carbon substrates—remain tight in 2024, boosting supplier influence as ISCC+ and similar certifications and quality variability constrain usable volumes and raise verification costs. Premiums for green feedstocks—reported up to ~20% in some segments—pressure PSB margins; forward contracts and closed-loop programs are key to stabilizing supply.
- Recycled content: constrained, drives price premia
- Certification: ISCC+ raises supplier leverage
- Premiums: up to ~20% in 2024
- Mitigation: forward contracts, closed-loop sourcing
Logistics and lead-time sensitivity
Global supply chains and freight‑intensive glass and paper shipments give local suppliers with spare capacity leverage, as logistics costs and spot rates remained elevated into 2024, keeping landed costs and margins volatile. Lead‑time reliability is critical for launches and promotions; PSB faces higher stockout risk when lead‑time variance spikes during port congestion and energy rationing episodes. Regionalizing supply chains has started to dilute supplier power by shortening lead times and shifting freight from ocean to rail/road.
- Freight pressure: elevated spot rates into 2024 affecting margins
- Lead‑time sensitivity: launch windows vulnerable to delay spikes
- Disruption drivers: port congestion and energy rationing
- Mitigation: regionalization reduces supplier leverage
Supplier power: Top-5 50-60%, Brent ~86 $/bbl, NBSK ~850 $/t, premiums up to ~20%
Supplier power is high: top-5 suppliers hold ~50–60% capacity, with Brent ~86$/bbl and NBSK ~850$/t in 2024 driving input volatility. Switching frictions (molds/machinery 8–26 weeks; re-qualification 3–12 months) and regulatory certification (REACH, ISCC+) concentrate suppliers and add 5–15% premiums. Green feedstock tightness pushed premiums up to ~20%; forward contracts and regionalization are primary mitigants.
| Metric | 2024 value |
|---|---|
| Top-5 supplier share | 50–60% |
| Brent | ~86 $/bbl |
| NBSK pulp | ~850 $/t |
| Supplier premiums | 5–15% (cert), up to ~20% green |
| Lead times / re-qual | 8–26 wks / 3–12 mos |
What is included in the product
 Detailed Word Document
Comprehensive Porter's Five Forces analysis tailored to PSB Industries, highlighting competitive rivalry, buyer and supplier power, substitute threats, and entry barriers, with strategic insights on market positioning and profitability drivers.

 Customizable Excel Spreadsheet
One-sheet Porter's Five Forces for PSB Industries—clear spider chart and editable pressure levels so you can swap in your data, paste into pitch decks, and integrate with reports without macros or fuss.
Customers Bargaining Power

Large FMCG and beauty brands negotiate hard
Top cosmetics, personal care and food firms such as P&G, Unilever, LOréal and Estée Lauder buy at scale and routinely benchmark supplier pricing across categories. Vendor consolidation and preferred-supplier programs in 2024 have intensified buyers exposure and bargaining clout, forcing annual cost-downs and value-engineering demands. Losing a single major account can materially reduce plant utilization and margins for PSB Industries, given concentrated revenue from large buyers.
Quality, design, and service differentiation
When packaging enables brand identity and dosing performance, buyers are less price-driven; premium packaging demand rose 7% in 2024, tightening focus on design over unit cost. Co-design and complex decoration raise switching costs as development cycles and tooling can add 20–30% to CAPEX. High service levels and speed-to-market (often cutting lead times by ~30%) can outweigh unit price. PSB can leverage luxury capabilities to soften buyer power.

Regulatory and validation switching costs
Healthcare and sensitive formulas require stability and validation, with regulatory validation timelines often spanning 6–12 months, raising tangible changeover costs. Tooling transfer and line trials can add 3–9 months and substantial CAPEX, delaying supplier swaps. Buyers weigh the risk of recalls and compliance gaps—recall events commonly incur direct and indirect costs often exceeding $10 million. This dynamic tempers price pressure in regulated segments.

Sustainability and ESG demands
Buyers increasingly mandate recycled content, refillability and LCA improvements; in 2024 about 68% of CPG procurement teams set recycled-content targets and 58% used supplier ESG scorecards, pushing suppliers to invest and shift costs upstream. Failure to meet specs risks delisting—studies show 20–30% of noncompliant suppliers lost contracts in 2024. Meeting ESG specs can secure preferred-supplier status and pricing resilience.
- recycled-content mandates: 68% (2024)
- ESG scorecard use: 58% (2024)
- delisting risk for noncompliance: 20–30% (2024)
Multi-sourcing and e-auctions
Procurement teams run competitive tenders and e-auctions that delivered median savings of about 7–9% in 2024 industry surveys, while multi-sourcing across alternative materials and geographies keeps quotes competitive and supply risk dispersed. Framework agreements commonly cap annual price moves to roughly ±3–5%, though differentiated IP and unique finishes—about 20% of PSB SKUs—reduce direct bid comparability.
- e-auction savings: 7–9% (2024)
- Framework cap: ±3–5% annually
- Multi-sourcing lowers supplier leverage
- Unique IP/finishes ≈20% SKUs limit comparability
CPG tenders cut prices 7–9%; ESG recycled mandates 68% limit switching
Large CPG buyers (P&G, Unilever, LOréal) exert strong price pressure via tenders/e-auctions (median savings 7–9% in 2024) and consolidation, risking PSB utilization if a major account is lost. Premium/regulated SKUs (≈20% unique) and validation timelines (6–12 months) reduce switching. ESG mandates (68% recycled, 58% ESG scorecards in 2024) raise supplier costs but can earn preferred status.
| Metric | 2024 Value |
|---|---|
| E-auction savings | 7–9% |
| Recycled-content mandates | 68% |
| ESG scorecard use | 58% |
| Unique SKUs | ≈20% |
Preview Before You Purchase
PSB Industries Porter's Five Forces Analysis
This preview shows the exact Porter's Five Forces analysis for PSB Industries you'll receive upon purchase. It is the full, professionally formatted document—no placeholders or samples. Instant download and ready for use in decision-making and reporting. What you see is what you get.

Don't Miss the Bigger Picture
PSB Industries faces moderate buyer power, concentrated suppliers for specialty components, and niche substitute threats that together shape tight margin pressure and innovation-driven competition. Competitive rivalry is intense among regional peers, while barriers to entry remain mixed due to regulatory and capital requirements. This brief snapshot only scratches the surface—unlock the full Porter's Five Forces Analysis for detailed ratings, visuals, and strategic actions.
Suppliers Bargaining Power
Concentrated resin and specialty inputs
PSB depends on petrochemical resins (top producers like LyondellBasell, SABIC, INEOS), paperboard, glass, pigments and specialty additives where the top 5 suppliers hold roughly 50–60% of global capacity, concentrating price-setting power. 2024 volatility—Brent averaging about $86/barrel and NBSK pulp near $850/ton—amplified supplier leverage. Hedging and multi-sourcing reduce but do not eliminate spike exposure.
Tooling, molds, and equipment lock-in
Custom molds and high-spec machinery create switching frictions and lead times of 8–26 weeks, elevating supplier leverage over PSB. Re-qualification for beauty and healthcare lines can take 3–12 months and be costly, reinforcing lock-in. OEM service contracts and spare-parts dependency further strengthen supplier power. PSB mitigates this via standardized platforms and dual-approved tools.
Regulatory-grade chemicals and compliance
REACH (≈22,000 substances registered in 2024) and CLP plus pharma‑grade input requirements shrink qualified supplier pools, concentrating supplier power. Compliance documentation and batch traceability extend supplier qualification cycles to 6–12 months, raising switching costs and operational risk. Certified suppliers commonly command 5–15% premiums, while long‑term technical partnerships can trade price for reliability, cutting volatility-related costs by up to ~10%.
Sustainability-grade materials constraints
Sustainability-grade materials—recycled content, bio-based polymers and low-carbon substrates—remain tight in 2024, boosting supplier influence as ISCC+ and similar certifications and quality variability constrain usable volumes and raise verification costs. Premiums for green feedstocks—reported up to ~20% in some segments—pressure PSB margins; forward contracts and closed-loop programs are key to stabilizing supply.
- Recycled content: constrained, drives price premia
- Certification: ISCC+ raises supplier leverage
- Premiums: up to ~20% in 2024
- Mitigation: forward contracts, closed-loop sourcing
Logistics and lead-time sensitivity
Global supply chains and freight‑intensive glass and paper shipments give local suppliers with spare capacity leverage, as logistics costs and spot rates remained elevated into 2024, keeping landed costs and margins volatile. Lead‑time reliability is critical for launches and promotions; PSB faces higher stockout risk when lead‑time variance spikes during port congestion and energy rationing episodes. Regionalizing supply chains has started to dilute supplier power by shortening lead times and shifting freight from ocean to rail/road.
- Freight pressure: elevated spot rates into 2024 affecting margins
- Lead‑time sensitivity: launch windows vulnerable to delay spikes
- Disruption drivers: port congestion and energy rationing
- Mitigation: regionalization reduces supplier leverage
Supplier power: Top-5 50-60%, Brent ~86 $/bbl, NBSK ~850 $/t, premiums up to ~20%
Supplier power is high: top-5 suppliers hold ~50–60% capacity, with Brent ~86$/bbl and NBSK ~850$/t in 2024 driving input volatility. Switching frictions (molds/machinery 8–26 weeks; re-qualification 3–12 months) and regulatory certification (REACH, ISCC+) concentrate suppliers and add 5–15% premiums. Green feedstock tightness pushed premiums up to ~20%; forward contracts and regionalization are primary mitigants.
| Metric | 2024 value |
|---|---|
| Top-5 supplier share | 50–60% |
| Brent | ~86 $/bbl |
| NBSK pulp | ~850 $/t |
| Supplier premiums | 5–15% (cert), up to ~20% green |
| Lead times / re-qual | 8–26 wks / 3–12 mos |
What is included in the product
Detailed Word Document
Comprehensive Porter's Five Forces analysis tailored to PSB Industries, highlighting competitive rivalry, buyer and supplier power, substitute threats, and entry barriers, with strategic insights on market positioning and profitability drivers.
Customizable Excel Spreadsheet
One-sheet Porter's Five Forces for PSB Industries—clear spider chart and editable pressure levels so you can swap in your data, paste into pitch decks, and integrate with reports without macros or fuss.
Customers Bargaining Power
Large FMCG and beauty brands negotiate hard
Top cosmetics, personal care and food firms such as P&G, Unilever, LOréal and Estée Lauder buy at scale and routinely benchmark supplier pricing across categories. Vendor consolidation and preferred-supplier programs in 2024 have intensified buyers exposure and bargaining clout, forcing annual cost-downs and value-engineering demands. Losing a single major account can materially reduce plant utilization and margins for PSB Industries, given concentrated revenue from large buyers.
Quality, design, and service differentiation
When packaging enables brand identity and dosing performance, buyers are less price-driven; premium packaging demand rose 7% in 2024, tightening focus on design over unit cost. Co-design and complex decoration raise switching costs as development cycles and tooling can add 20–30% to CAPEX. High service levels and speed-to-market (often cutting lead times by ~30%) can outweigh unit price. PSB can leverage luxury capabilities to soften buyer power.
Regulatory and validation switching costs
Healthcare and sensitive formulas require stability and validation, with regulatory validation timelines often spanning 6–12 months, raising tangible changeover costs. Tooling transfer and line trials can add 3–9 months and substantial CAPEX, delaying supplier swaps. Buyers weigh the risk of recalls and compliance gaps—recall events commonly incur direct and indirect costs often exceeding $10 million. This dynamic tempers price pressure in regulated segments.
Sustainability and ESG demands
Buyers increasingly mandate recycled content, refillability and LCA improvements; in 2024 about 68% of CPG procurement teams set recycled-content targets and 58% used supplier ESG scorecards, pushing suppliers to invest and shift costs upstream. Failure to meet specs risks delisting—studies show 20–30% of noncompliant suppliers lost contracts in 2024. Meeting ESG specs can secure preferred-supplier status and pricing resilience.
- recycled-content mandates: 68% (2024)
- ESG scorecard use: 58% (2024)
- delisting risk for noncompliance: 20–30% (2024)
Multi-sourcing and e-auctions
Procurement teams run competitive tenders and e-auctions that delivered median savings of about 7–9% in 2024 industry surveys, while multi-sourcing across alternative materials and geographies keeps quotes competitive and supply risk dispersed. Framework agreements commonly cap annual price moves to roughly ±3–5%, though differentiated IP and unique finishes—about 20% of PSB SKUs—reduce direct bid comparability.
- e-auction savings: 7–9% (2024)
- Framework cap: ±3–5% annually
- Multi-sourcing lowers supplier leverage
- Unique IP/finishes ≈20% SKUs limit comparability
CPG tenders cut prices 7–9%; ESG recycled mandates 68% limit switching
Large CPG buyers (P&G, Unilever, LOréal) exert strong price pressure via tenders/e-auctions (median savings 7–9% in 2024) and consolidation, risking PSB utilization if a major account is lost. Premium/regulated SKUs (≈20% unique) and validation timelines (6–12 months) reduce switching. ESG mandates (68% recycled, 58% ESG scorecards in 2024) raise supplier costs but can earn preferred status.
| Metric | 2024 Value |
|---|---|
| E-auction savings | 7–9% |
| Recycled-content mandates | 68% |
| ESG scorecard use | 58% |
| Unique SKUs | ≈20% |
Preview Before You Purchase
PSB Industries Porter's Five Forces Analysis
This preview shows the exact Porter's Five Forces analysis for PSB Industries you'll receive upon purchase. It is the full, professionally formatted document—no placeholders or samples. Instant download and ready for use in decision-making and reporting. What you see is what you get.
Original: $10.00
-65%$10.00
$3.50Description
Don't Miss the Bigger Picture
PSB Industries faces moderate buyer power, concentrated suppliers for specialty components, and niche substitute threats that together shape tight margin pressure and innovation-driven competition. Competitive rivalry is intense among regional peers, while barriers to entry remain mixed due to regulatory and capital requirements. This brief snapshot only scratches the surface—unlock the full Porter's Five Forces Analysis for detailed ratings, visuals, and strategic actions.
Suppliers Bargaining Power
Concentrated resin and specialty inputs
PSB depends on petrochemical resins (top producers like LyondellBasell, SABIC, INEOS), paperboard, glass, pigments and specialty additives where the top 5 suppliers hold roughly 50–60% of global capacity, concentrating price-setting power. 2024 volatility—Brent averaging about $86/barrel and NBSK pulp near $850/ton—amplified supplier leverage. Hedging and multi-sourcing reduce but do not eliminate spike exposure.
Tooling, molds, and equipment lock-in
Custom molds and high-spec machinery create switching frictions and lead times of 8–26 weeks, elevating supplier leverage over PSB. Re-qualification for beauty and healthcare lines can take 3–12 months and be costly, reinforcing lock-in. OEM service contracts and spare-parts dependency further strengthen supplier power. PSB mitigates this via standardized platforms and dual-approved tools.
Regulatory-grade chemicals and compliance
REACH (≈22,000 substances registered in 2024) and CLP plus pharma‑grade input requirements shrink qualified supplier pools, concentrating supplier power. Compliance documentation and batch traceability extend supplier qualification cycles to 6–12 months, raising switching costs and operational risk. Certified suppliers commonly command 5–15% premiums, while long‑term technical partnerships can trade price for reliability, cutting volatility-related costs by up to ~10%.
Sustainability-grade materials constraints
Sustainability-grade materials—recycled content, bio-based polymers and low-carbon substrates—remain tight in 2024, boosting supplier influence as ISCC+ and similar certifications and quality variability constrain usable volumes and raise verification costs. Premiums for green feedstocks—reported up to ~20% in some segments—pressure PSB margins; forward contracts and closed-loop programs are key to stabilizing supply.
- Recycled content: constrained, drives price premia
- Certification: ISCC+ raises supplier leverage
- Premiums: up to ~20% in 2024
- Mitigation: forward contracts, closed-loop sourcing
Logistics and lead-time sensitivity
Global supply chains and freight‑intensive glass and paper shipments give local suppliers with spare capacity leverage, as logistics costs and spot rates remained elevated into 2024, keeping landed costs and margins volatile. Lead‑time reliability is critical for launches and promotions; PSB faces higher stockout risk when lead‑time variance spikes during port congestion and energy rationing episodes. Regionalizing supply chains has started to dilute supplier power by shortening lead times and shifting freight from ocean to rail/road.
- Freight pressure: elevated spot rates into 2024 affecting margins
- Lead‑time sensitivity: launch windows vulnerable to delay spikes
- Disruption drivers: port congestion and energy rationing
- Mitigation: regionalization reduces supplier leverage
Supplier power: Top-5 50-60%, Brent ~86 $/bbl, NBSK ~850 $/t, premiums up to ~20%
Supplier power is high: top-5 suppliers hold ~50–60% capacity, with Brent ~86$/bbl and NBSK ~850$/t in 2024 driving input volatility. Switching frictions (molds/machinery 8–26 weeks; re-qualification 3–12 months) and regulatory certification (REACH, ISCC+) concentrate suppliers and add 5–15% premiums. Green feedstock tightness pushed premiums up to ~20%; forward contracts and regionalization are primary mitigants.
| Metric | 2024 value |
|---|---|
| Top-5 supplier share | 50–60% |
| Brent | ~86 $/bbl |
| NBSK pulp | ~850 $/t |
| Supplier premiums | 5–15% (cert), up to ~20% green |
| Lead times / re-qual | 8–26 wks / 3–12 mos |
What is included in the product
Detailed Word Document
Comprehensive Porter's Five Forces analysis tailored to PSB Industries, highlighting competitive rivalry, buyer and supplier power, substitute threats, and entry barriers, with strategic insights on market positioning and profitability drivers.
Customizable Excel Spreadsheet
One-sheet Porter's Five Forces for PSB Industries—clear spider chart and editable pressure levels so you can swap in your data, paste into pitch decks, and integrate with reports without macros or fuss.
Customers Bargaining Power
Large FMCG and beauty brands negotiate hard
Top cosmetics, personal care and food firms such as P&G, Unilever, LOréal and Estée Lauder buy at scale and routinely benchmark supplier pricing across categories. Vendor consolidation and preferred-supplier programs in 2024 have intensified buyers exposure and bargaining clout, forcing annual cost-downs and value-engineering demands. Losing a single major account can materially reduce plant utilization and margins for PSB Industries, given concentrated revenue from large buyers.
Quality, design, and service differentiation
When packaging enables brand identity and dosing performance, buyers are less price-driven; premium packaging demand rose 7% in 2024, tightening focus on design over unit cost. Co-design and complex decoration raise switching costs as development cycles and tooling can add 20–30% to CAPEX. High service levels and speed-to-market (often cutting lead times by ~30%) can outweigh unit price. PSB can leverage luxury capabilities to soften buyer power.
Regulatory and validation switching costs
Healthcare and sensitive formulas require stability and validation, with regulatory validation timelines often spanning 6–12 months, raising tangible changeover costs. Tooling transfer and line trials can add 3–9 months and substantial CAPEX, delaying supplier swaps. Buyers weigh the risk of recalls and compliance gaps—recall events commonly incur direct and indirect costs often exceeding $10 million. This dynamic tempers price pressure in regulated segments.
Sustainability and ESG demands
Buyers increasingly mandate recycled content, refillability and LCA improvements; in 2024 about 68% of CPG procurement teams set recycled-content targets and 58% used supplier ESG scorecards, pushing suppliers to invest and shift costs upstream. Failure to meet specs risks delisting—studies show 20–30% of noncompliant suppliers lost contracts in 2024. Meeting ESG specs can secure preferred-supplier status and pricing resilience.
- recycled-content mandates: 68% (2024)
- ESG scorecard use: 58% (2024)
- delisting risk for noncompliance: 20–30% (2024)
Multi-sourcing and e-auctions
Procurement teams run competitive tenders and e-auctions that delivered median savings of about 7–9% in 2024 industry surveys, while multi-sourcing across alternative materials and geographies keeps quotes competitive and supply risk dispersed. Framework agreements commonly cap annual price moves to roughly ±3–5%, though differentiated IP and unique finishes—about 20% of PSB SKUs—reduce direct bid comparability.
- e-auction savings: 7–9% (2024)
- Framework cap: ±3–5% annually
- Multi-sourcing lowers supplier leverage
- Unique IP/finishes ≈20% SKUs limit comparability
CPG tenders cut prices 7–9%; ESG recycled mandates 68% limit switching
Large CPG buyers (P&G, Unilever, LOréal) exert strong price pressure via tenders/e-auctions (median savings 7–9% in 2024) and consolidation, risking PSB utilization if a major account is lost. Premium/regulated SKUs (≈20% unique) and validation timelines (6–12 months) reduce switching. ESG mandates (68% recycled, 58% ESG scorecards in 2024) raise supplier costs but can earn preferred status.
| Metric | 2024 Value |
|---|---|
| E-auction savings | 7–9% |
| Recycled-content mandates | 68% |
| ESG scorecard use | 58% |
| Unique SKUs | ≈20% |
Preview Before You Purchase
PSB Industries Porter's Five Forces Analysis
This preview shows the exact Porter's Five Forces analysis for PSB Industries you'll receive upon purchase. It is the full, professionally formatted document—no placeholders or samples. Instant download and ready for use in decision-making and reporting. What you see is what you get.











