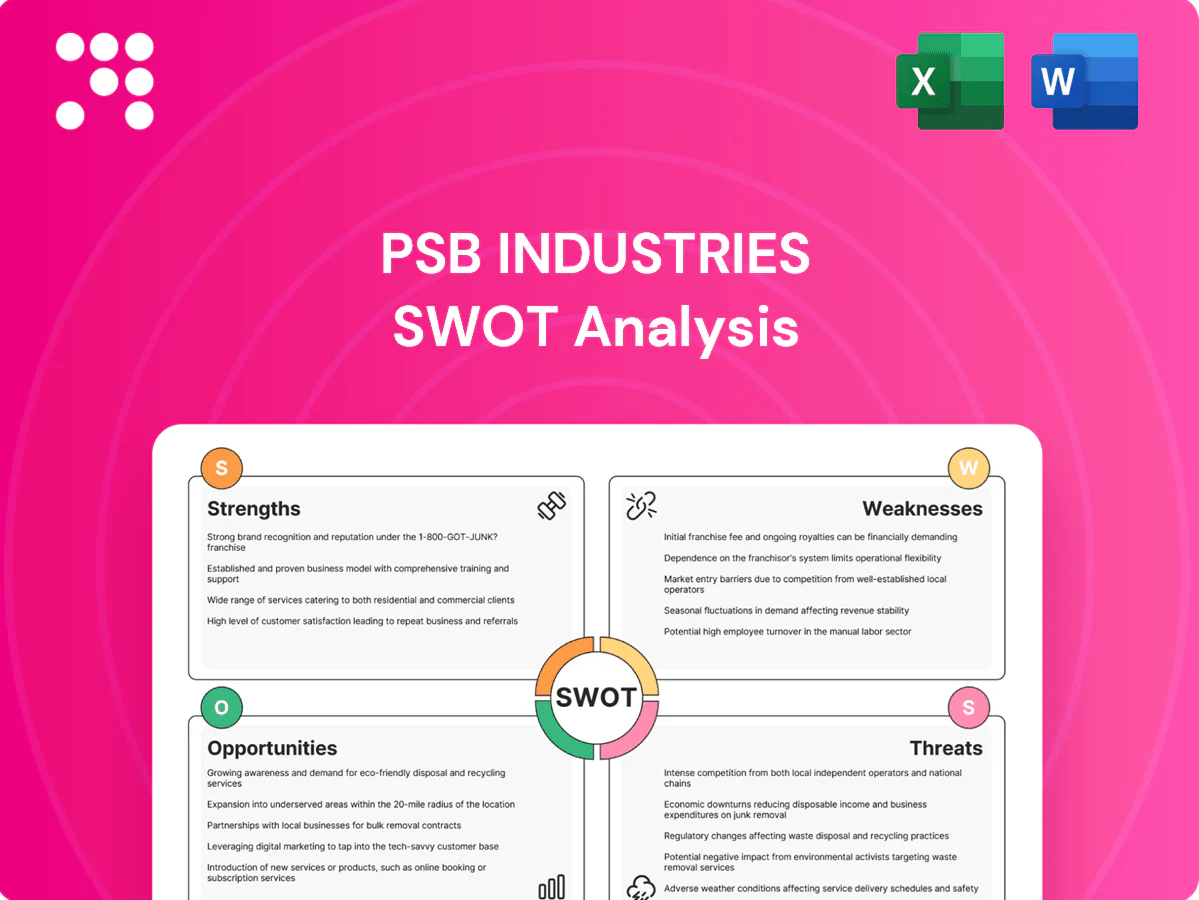
PSB Industries SWOT Analysis

Go Beyond the Preview—Access the Full Strategic Report
PSB Industries SWOT Analysis reveals strengths, weaknesses, opportunities, and threats shaping its market position. Purchase the full SWOT for in-depth, research-backed insights, strategic takeaways, and financial context. Get editable Word and Excel deliverables to plan, pitch, and invest with confidence.
Strengths

Diversified portfolio across packaging and specialty chemicals
Operating across materials and finished packaging reduces revenue volatility and broadened profit pools, with global packaging market ~USD 1.02 trillion (2023) and specialty chemicals ~USD 700 billion (2024), allowing PSB to capture higher-margin downstream sales. Cross-selling between chemicals and packaging enables integrated solutions that lift average order values and client retention. The multi-vertical footprint cushions cyclical demand dips in any single end-market and strengthens bargaining power with multinational accounts.
Exposure to resilient end-markets (beauty, healthcare, food)
Exposure to beauty, healthcare and food taps resilient end-markets: global beauty sales reached about $511B in 2023, pharmaceuticals ~ $1.5T in 2023 and global packaged food ~ $2.3T in 2023, underpinning steady demand and brand-led pricing power. These sectors prioritize quality and reliability, favoring established suppliers and enabling PSB to win repeat business. Long qualification cycles in healthcare create sticky relationships, while premium beauty and pharma support higher value-added margins.

Luxury division capabilities for high-value premium packaging
Luxury packaging demands precision, superior aesthetics, and clear sustainability credentials; mastery here unlocks access to the €375bn global luxury market (Bain 2023). This capability supports premium pricing and deep brand partnerships, setting PSB apart from commodity packaging peers. Luxury-grade processes and materials often cascade into mainstream lines as operational best practices, raising overall margins and brand value.

End-to-end solutions from design to formulation services
Offering design, manufacturing, functional ingredients and formulation creates genuine one-stop convenience that shortens clients’ time-to-market and simplifies supplier management.
Integrated offerings boost wallet share and increase switching costs by embedding multiple stages of the value chain into single contracts.
Tighter feedback loops across design and formulation accelerate innovation cycles and enable faster product iterations.
- One-stop convenience
- Reduced supplier complexity
- Higher wallet share
- Faster innovation cycles
Manufacturing know-how in both rigid and flexible formats
Process breadth lets PSB match optimal rigid or flexible substrates to each application, improving technical fit and tender competitiveness; multi-format capability raises win rates in bids with mixed-format briefs. Operational flexibility enables capacity rebalancing as demand shifts, while shared tooling, consolidated procurement and cross-trained technical teams drive measurable cost efficiencies.
- Multi-format match: better tender outcomes
- Operational flexibility: dynamic capacity rebalance
- Shared assets: lower unit costs
- Cross-skilled teams: faster ramp-up
Platform captures margins across USD 1.02T packaging and USD 700B specialty chemicals
Integrated materials-to-packaging platform captures downstream margin pools across USD 1.02T packaging (2023) and USD 700B specialty chemicals (2024), enabling cross-sell and resilient exposure to beauty, pharma and food. Luxury packaging expertise opens premium brand partnerships in the €375B luxury market (2023). Multi-format operations and shared assets drive cost and tender advantages.
| Market | Size |
|---|---|
| Global packaging | USD 1.02T (2023) |
| Specialty chemicals | USD 700B (2024) |
| Luxury market | €375B (2023) |
| Beauty | USD 511B (2023) |
| Pharma | USD 1.5T (2023) |
| Packaged food | USD 2.3T (2023) |
What is included in the product
 Detailed Word Document
Provides a concise SWOT analysis of PSB Industries, highlighting internal strengths and weaknesses and external opportunities and threats to assess its competitive position and strategic risks.

 Customizable Excel Spreadsheet
Provides a concise SWOT matrix tailored to PSB Industries for rapid strategic alignment and risk mitigation, offering an editable snapshot that supports quick decisions and stakeholder updates.
Weaknesses

Potential capital intensity and maintenance of advanced lines
High-spec packaging and specialty chemical plants demand continual capex, exposing PSB to significant asset intensity that can squeeze free cash flow in market downturns. Recurring investments for automation and sustainability upgrades raise operating capital needs and compress margins. If demand softens, underutilization risks can materially weaken returns and elongate payback periods.
Exposure to raw material price volatility
PSB faces exposure to volatile resins, solvents, pigments and specialty inputs, which have seen swings often in the 10–30% range in recent years, amplifying input cost risk for coatings producers.
Lagged pass-through clauses can compress gross margins temporarily—industry cases show margin hits of several percentage points during pass-through lags.
Hedging reduces headline risk but leaves basis and timing gaps, and sudden price spikes frequently force customers to change specs or shift order timing, disrupting production planning.

Complexity from serving multiple regulated sectors
Serving both healthcare and food sectors forces adherence to stringent compliance and regular audits—US healthcare spending was $4.7 trillion in 2022, amplifying regulatory scrutiny—while diverse certification demands raise overhead and lengthen time-to-market, often adding measurable administrative costs; any quality deviation risks steep reputational and financial penalties, and operational complexity can materially slow scale-up for new programs.

Geographic footprint may be uneven versus global peers
Concentrated manufacturing and sales expose PSB Industries to missed growth in faster-growing regions, reducing addressable market relative to diversified peers. Multinational buyers often favor suppliers with mirrored global footprints, limiting PSB’s appeal for large cross-border contracts. Higher logistics and export costs from limited hubs can erode margin competitiveness in distant markets.
- Concentration risk: limited regional presence
- Contract disadvantage: lower appeal to multinationals
- Logistics drag: higher export costs, thinner margins
Brand visibility lower than top-tier global packaging majors
PSB Industries shows lower brand visibility versus top-tier global packaging majors, while the global packaging market was about USD 1 trillion in 2023, concentrating client mindshare among Amcor, Tetra Pak and other leaders; this lowers PSB’s access to flagship beauty and pharma programs, forces higher commercial spend and lengthens sales cycles, and reduces negotiating leverage versus larger peers.
- Mindshare dominated by top global players
- Hinders entry to flagship beauty/pharma contracts
- Requires higher commercial effort and longer sales cycles
- Scale disadvantage limits pricing and supply negotiation power
High capex and 10–30% input swings squeeze margins; weak global reach limits pricing
High capex and asset intensity strain free cash flow in downturns, with automation/sustainability capex rising. Input volatility (10–30% swings) and lagged pass-throughs compress margins. Limited global footprint and lower brand share versus USD 1.1T market reduce access to flagship contracts and weaken pricing power.
| Metric | Value | Impact |
|---|---|---|
| Global packaging | ~USD 1.1T (2024) | Concentrated competitors |
| Input volatility | 10–30% | Margin risk |
Preview the Actual Deliverable
PSB Industries SWOT Analysis
This is the actual SWOT analysis document you’ll receive upon purchase—no surprises, just professional quality. The preview below is taken directly from the full SWOT report you'll get, and the complete, editable version is unlocked after checkout. It’s structured for immediate use in presentations, strategy sessions, or further editing.

Go Beyond the Preview—Access the Full Strategic Report
PSB Industries SWOT Analysis reveals strengths, weaknesses, opportunities, and threats shaping its market position. Purchase the full SWOT for in-depth, research-backed insights, strategic takeaways, and financial context. Get editable Word and Excel deliverables to plan, pitch, and invest with confidence.
Strengths
Diversified portfolio across packaging and specialty chemicals
Operating across materials and finished packaging reduces revenue volatility and broadened profit pools, with global packaging market ~USD 1.02 trillion (2023) and specialty chemicals ~USD 700 billion (2024), allowing PSB to capture higher-margin downstream sales. Cross-selling between chemicals and packaging enables integrated solutions that lift average order values and client retention. The multi-vertical footprint cushions cyclical demand dips in any single end-market and strengthens bargaining power with multinational accounts.
Exposure to resilient end-markets (beauty, healthcare, food)
Exposure to beauty, healthcare and food taps resilient end-markets: global beauty sales reached about $511B in 2023, pharmaceuticals ~ $1.5T in 2023 and global packaged food ~ $2.3T in 2023, underpinning steady demand and brand-led pricing power. These sectors prioritize quality and reliability, favoring established suppliers and enabling PSB to win repeat business. Long qualification cycles in healthcare create sticky relationships, while premium beauty and pharma support higher value-added margins.
Luxury division capabilities for high-value premium packaging
Luxury packaging demands precision, superior aesthetics, and clear sustainability credentials; mastery here unlocks access to the €375bn global luxury market (Bain 2023). This capability supports premium pricing and deep brand partnerships, setting PSB apart from commodity packaging peers. Luxury-grade processes and materials often cascade into mainstream lines as operational best practices, raising overall margins and brand value.
End-to-end solutions from design to formulation services
Offering design, manufacturing, functional ingredients and formulation creates genuine one-stop convenience that shortens clients’ time-to-market and simplifies supplier management.
Integrated offerings boost wallet share and increase switching costs by embedding multiple stages of the value chain into single contracts.
Tighter feedback loops across design and formulation accelerate innovation cycles and enable faster product iterations.
- One-stop convenience
- Reduced supplier complexity
- Higher wallet share
- Faster innovation cycles
Manufacturing know-how in both rigid and flexible formats
Process breadth lets PSB match optimal rigid or flexible substrates to each application, improving technical fit and tender competitiveness; multi-format capability raises win rates in bids with mixed-format briefs. Operational flexibility enables capacity rebalancing as demand shifts, while shared tooling, consolidated procurement and cross-trained technical teams drive measurable cost efficiencies.
- Multi-format match: better tender outcomes
- Operational flexibility: dynamic capacity rebalance
- Shared assets: lower unit costs
- Cross-skilled teams: faster ramp-up
Platform captures margins across USD 1.02T packaging and USD 700B specialty chemicals
Integrated materials-to-packaging platform captures downstream margin pools across USD 1.02T packaging (2023) and USD 700B specialty chemicals (2024), enabling cross-sell and resilient exposure to beauty, pharma and food. Luxury packaging expertise opens premium brand partnerships in the €375B luxury market (2023). Multi-format operations and shared assets drive cost and tender advantages.
| Market | Size |
|---|---|
| Global packaging | USD 1.02T (2023) |
| Specialty chemicals | USD 700B (2024) |
| Luxury market | €375B (2023) |
| Beauty | USD 511B (2023) |
| Pharma | USD 1.5T (2023) |
| Packaged food | USD 2.3T (2023) |
What is included in the product
Detailed Word Document
Provides a concise SWOT analysis of PSB Industries, highlighting internal strengths and weaknesses and external opportunities and threats to assess its competitive position and strategic risks.
Customizable Excel Spreadsheet
Provides a concise SWOT matrix tailored to PSB Industries for rapid strategic alignment and risk mitigation, offering an editable snapshot that supports quick decisions and stakeholder updates.
Weaknesses
Potential capital intensity and maintenance of advanced lines
High-spec packaging and specialty chemical plants demand continual capex, exposing PSB to significant asset intensity that can squeeze free cash flow in market downturns. Recurring investments for automation and sustainability upgrades raise operating capital needs and compress margins. If demand softens, underutilization risks can materially weaken returns and elongate payback periods.
Exposure to raw material price volatility
PSB faces exposure to volatile resins, solvents, pigments and specialty inputs, which have seen swings often in the 10–30% range in recent years, amplifying input cost risk for coatings producers.
Lagged pass-through clauses can compress gross margins temporarily—industry cases show margin hits of several percentage points during pass-through lags.
Hedging reduces headline risk but leaves basis and timing gaps, and sudden price spikes frequently force customers to change specs or shift order timing, disrupting production planning.
Complexity from serving multiple regulated sectors
Serving both healthcare and food sectors forces adherence to stringent compliance and regular audits—US healthcare spending was $4.7 trillion in 2022, amplifying regulatory scrutiny—while diverse certification demands raise overhead and lengthen time-to-market, often adding measurable administrative costs; any quality deviation risks steep reputational and financial penalties, and operational complexity can materially slow scale-up for new programs.
Geographic footprint may be uneven versus global peers
Concentrated manufacturing and sales expose PSB Industries to missed growth in faster-growing regions, reducing addressable market relative to diversified peers. Multinational buyers often favor suppliers with mirrored global footprints, limiting PSB’s appeal for large cross-border contracts. Higher logistics and export costs from limited hubs can erode margin competitiveness in distant markets.
- Concentration risk: limited regional presence
- Contract disadvantage: lower appeal to multinationals
- Logistics drag: higher export costs, thinner margins
Brand visibility lower than top-tier global packaging majors
PSB Industries shows lower brand visibility versus top-tier global packaging majors, while the global packaging market was about USD 1 trillion in 2023, concentrating client mindshare among Amcor, Tetra Pak and other leaders; this lowers PSB’s access to flagship beauty and pharma programs, forces higher commercial spend and lengthens sales cycles, and reduces negotiating leverage versus larger peers.
- Mindshare dominated by top global players
- Hinders entry to flagship beauty/pharma contracts
- Requires higher commercial effort and longer sales cycles
- Scale disadvantage limits pricing and supply negotiation power
High capex and 10–30% input swings squeeze margins; weak global reach limits pricing
High capex and asset intensity strain free cash flow in downturns, with automation/sustainability capex rising. Input volatility (10–30% swings) and lagged pass-throughs compress margins. Limited global footprint and lower brand share versus USD 1.1T market reduce access to flagship contracts and weaken pricing power.
| Metric | Value | Impact |
|---|---|---|
| Global packaging | ~USD 1.1T (2024) | Concentrated competitors |
| Input volatility | 10–30% | Margin risk |
Preview the Actual Deliverable
PSB Industries SWOT Analysis
This is the actual SWOT analysis document you’ll receive upon purchase—no surprises, just professional quality. The preview below is taken directly from the full SWOT report you'll get, and the complete, editable version is unlocked after checkout. It’s structured for immediate use in presentations, strategy sessions, or further editing.
Original: $10.00
-65%$10.00
$3.50Description
Go Beyond the Preview—Access the Full Strategic Report
PSB Industries SWOT Analysis reveals strengths, weaknesses, opportunities, and threats shaping its market position. Purchase the full SWOT for in-depth, research-backed insights, strategic takeaways, and financial context. Get editable Word and Excel deliverables to plan, pitch, and invest with confidence.
Strengths
Diversified portfolio across packaging and specialty chemicals
Operating across materials and finished packaging reduces revenue volatility and broadened profit pools, with global packaging market ~USD 1.02 trillion (2023) and specialty chemicals ~USD 700 billion (2024), allowing PSB to capture higher-margin downstream sales. Cross-selling between chemicals and packaging enables integrated solutions that lift average order values and client retention. The multi-vertical footprint cushions cyclical demand dips in any single end-market and strengthens bargaining power with multinational accounts.
Exposure to resilient end-markets (beauty, healthcare, food)
Exposure to beauty, healthcare and food taps resilient end-markets: global beauty sales reached about $511B in 2023, pharmaceuticals ~ $1.5T in 2023 and global packaged food ~ $2.3T in 2023, underpinning steady demand and brand-led pricing power. These sectors prioritize quality and reliability, favoring established suppliers and enabling PSB to win repeat business. Long qualification cycles in healthcare create sticky relationships, while premium beauty and pharma support higher value-added margins.
Luxury division capabilities for high-value premium packaging
Luxury packaging demands precision, superior aesthetics, and clear sustainability credentials; mastery here unlocks access to the €375bn global luxury market (Bain 2023). This capability supports premium pricing and deep brand partnerships, setting PSB apart from commodity packaging peers. Luxury-grade processes and materials often cascade into mainstream lines as operational best practices, raising overall margins and brand value.
End-to-end solutions from design to formulation services
Offering design, manufacturing, functional ingredients and formulation creates genuine one-stop convenience that shortens clients’ time-to-market and simplifies supplier management.
Integrated offerings boost wallet share and increase switching costs by embedding multiple stages of the value chain into single contracts.
Tighter feedback loops across design and formulation accelerate innovation cycles and enable faster product iterations.
- One-stop convenience
- Reduced supplier complexity
- Higher wallet share
- Faster innovation cycles
Manufacturing know-how in both rigid and flexible formats
Process breadth lets PSB match optimal rigid or flexible substrates to each application, improving technical fit and tender competitiveness; multi-format capability raises win rates in bids with mixed-format briefs. Operational flexibility enables capacity rebalancing as demand shifts, while shared tooling, consolidated procurement and cross-trained technical teams drive measurable cost efficiencies.
- Multi-format match: better tender outcomes
- Operational flexibility: dynamic capacity rebalance
- Shared assets: lower unit costs
- Cross-skilled teams: faster ramp-up
Platform captures margins across USD 1.02T packaging and USD 700B specialty chemicals
Integrated materials-to-packaging platform captures downstream margin pools across USD 1.02T packaging (2023) and USD 700B specialty chemicals (2024), enabling cross-sell and resilient exposure to beauty, pharma and food. Luxury packaging expertise opens premium brand partnerships in the €375B luxury market (2023). Multi-format operations and shared assets drive cost and tender advantages.
| Market | Size |
|---|---|
| Global packaging | USD 1.02T (2023) |
| Specialty chemicals | USD 700B (2024) |
| Luxury market | €375B (2023) |
| Beauty | USD 511B (2023) |
| Pharma | USD 1.5T (2023) |
| Packaged food | USD 2.3T (2023) |
What is included in the product
Detailed Word Document
Provides a concise SWOT analysis of PSB Industries, highlighting internal strengths and weaknesses and external opportunities and threats to assess its competitive position and strategic risks.
Customizable Excel Spreadsheet
Provides a concise SWOT matrix tailored to PSB Industries for rapid strategic alignment and risk mitigation, offering an editable snapshot that supports quick decisions and stakeholder updates.
Weaknesses
Potential capital intensity and maintenance of advanced lines
High-spec packaging and specialty chemical plants demand continual capex, exposing PSB to significant asset intensity that can squeeze free cash flow in market downturns. Recurring investments for automation and sustainability upgrades raise operating capital needs and compress margins. If demand softens, underutilization risks can materially weaken returns and elongate payback periods.
Exposure to raw material price volatility
PSB faces exposure to volatile resins, solvents, pigments and specialty inputs, which have seen swings often in the 10–30% range in recent years, amplifying input cost risk for coatings producers.
Lagged pass-through clauses can compress gross margins temporarily—industry cases show margin hits of several percentage points during pass-through lags.
Hedging reduces headline risk but leaves basis and timing gaps, and sudden price spikes frequently force customers to change specs or shift order timing, disrupting production planning.
Complexity from serving multiple regulated sectors
Serving both healthcare and food sectors forces adherence to stringent compliance and regular audits—US healthcare spending was $4.7 trillion in 2022, amplifying regulatory scrutiny—while diverse certification demands raise overhead and lengthen time-to-market, often adding measurable administrative costs; any quality deviation risks steep reputational and financial penalties, and operational complexity can materially slow scale-up for new programs.
Geographic footprint may be uneven versus global peers
Concentrated manufacturing and sales expose PSB Industries to missed growth in faster-growing regions, reducing addressable market relative to diversified peers. Multinational buyers often favor suppliers with mirrored global footprints, limiting PSB’s appeal for large cross-border contracts. Higher logistics and export costs from limited hubs can erode margin competitiveness in distant markets.
- Concentration risk: limited regional presence
- Contract disadvantage: lower appeal to multinationals
- Logistics drag: higher export costs, thinner margins
Brand visibility lower than top-tier global packaging majors
PSB Industries shows lower brand visibility versus top-tier global packaging majors, while the global packaging market was about USD 1 trillion in 2023, concentrating client mindshare among Amcor, Tetra Pak and other leaders; this lowers PSB’s access to flagship beauty and pharma programs, forces higher commercial spend and lengthens sales cycles, and reduces negotiating leverage versus larger peers.
- Mindshare dominated by top global players
- Hinders entry to flagship beauty/pharma contracts
- Requires higher commercial effort and longer sales cycles
- Scale disadvantage limits pricing and supply negotiation power
High capex and 10–30% input swings squeeze margins; weak global reach limits pricing
High capex and asset intensity strain free cash flow in downturns, with automation/sustainability capex rising. Input volatility (10–30% swings) and lagged pass-throughs compress margins. Limited global footprint and lower brand share versus USD 1.1T market reduce access to flagship contracts and weaken pricing power.
| Metric | Value | Impact |
|---|---|---|
| Global packaging | ~USD 1.1T (2024) | Concentrated competitors |
| Input volatility | 10–30% | Margin risk |
Preview the Actual Deliverable
PSB Industries SWOT Analysis
This is the actual SWOT analysis document you’ll receive upon purchase—no surprises, just professional quality. The preview below is taken directly from the full SWOT report you'll get, and the complete, editable version is unlocked after checkout. It’s structured for immediate use in presentations, strategy sessions, or further editing.











