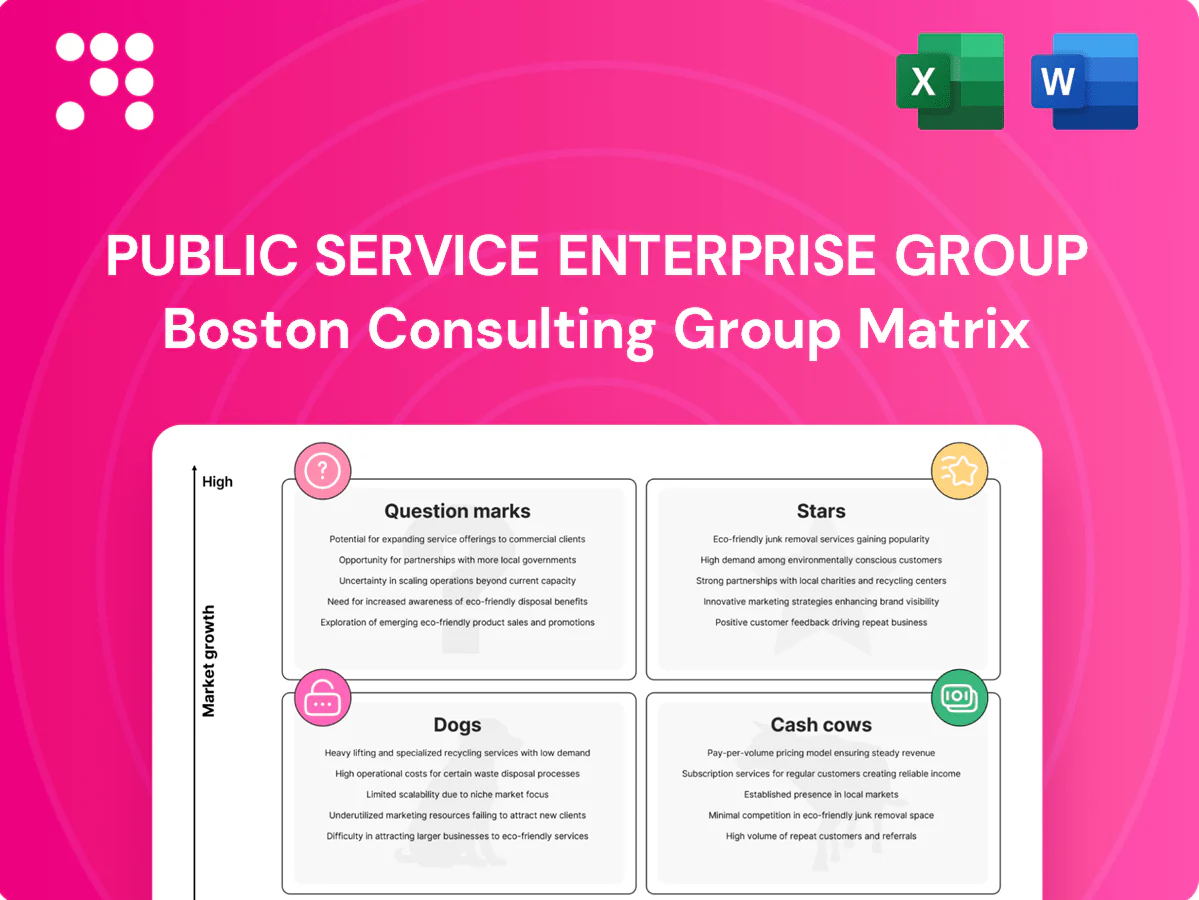
Public Service Enterprise Group Boston Consulting Group Matrix

Unlock Strategic Clarity
Public Service Enterprise Group’s BCG Matrix preview shows where its division units sit in a shifting energy market — which assets are Stars, which are steady Cash Cows, and which demand tough choices. You’ll see early signals of growth potential and areas eating cash, but this snapshot is only the start. Purchase the full BCG Matrix for quadrant-by-quadrant placement, data-backed recommendations, and a strategic roadmap tailored to PSEG’s unique mix. Get instant access in Word and Excel to present, plan, and act with confidence.
Stars

PSE&G Energy Efficiency Programs
PSE&G Energy Efficiency programs benefit from strong NJ policy tailwinds, including the state’s 100% clean energy target by 2050, driving fast-growing spend. PSE&G serves roughly 2.3 million customers, giving scale, brand access and high, defensible share. Programs require substantial upfront cash—hundreds of millions annually for incentives and delivery. Continue investing to cement leadership before the market matures.
Grid Modernization & AMI Rollout
Grid modernization and AMI rollout represent a large capex wave with big reliability wins and a long runway—classic high growth: PSE&G serves ~2.3 million electric and ~1.9 million gas customers, so meter and distribution upgrades scale in-house. Share sits firmly with PSE&G because it owns the wire and customer relationship. Cash needs are hefty now; payoff accrues through rate base recovery and performance incentives under 2024 regulatory frameworks. Push is to finish deployment fast and lock in operational gains.

Transmission Expansion for Renewable Interconnects
Regional demand for new lines and upgrades is rising quickly as New Jersey targets 7.5 GW of offshore wind by 2035 and broader clean-energy goals; interconnection needs are intensifying. As the dominant NJ utility serving about 2.3 million electric customers, PSE&G holds incumbent advantage and regulator credibility. These capital-hungry projects support durable, regulated earnings. Prioritize shovel-ready corridors to capture the surge.

Clean Energy Infrastructure (make-ready, fleet electrification)
Clean Energy Infrastructure (make-ready, fleet electrification) is a Stars play: EVs reached double-digit share of new U.S. car sales in 2024 and federal programs (Bipartisan Infrastructure Law $7.5B, NEVI ~$5B) accelerate demand. PSE&G can own the enablement layer and win high share via policy-backed programs but needs significant near-term capex and complex coordination. Scale early, standardize designs, turn volume into margin.
- Invest early to capture market share
- Standardize designs to lower unit cost
- Leverage $7.5B federal funding/NEVI to de-risk adoption
Community & Distributed Solar Enablement
Rapid, policy-driven solar growth—New Jersey reached about 4.8 GW of solar by 2024—creates strong customer pull; PSE&G, serving roughly 2.3 million customers, leverages interconnection, hosting-capacity maps and program administration to capture structural share. Capital outlays are upfront while benefits scale via throughput and rate base; streamlining interconnects keeps projects flowing and costs controlled.
- Policy growth: 4.8 GW NJ (2024)
- Structural share: interconnect + hosting capacity + program admin
- Economics: upfront capex → throughput/rate-base recovery
- Action: expedite interconnects to limit delays/costs
NJ utility poised to lock leadership: 2.3M customers, clean-by-2050 tailwinds
PSE&G Stars benefit from NJ 100% clean-by-2050 policy and strong 2024 tailwinds. Scale: ~2.3M electric customers, defensible share across grid, EE and interconnection. Capital-intensive now (hundreds of millions annually) with rate-base recovery and incentives; prioritize fast deployment to lock market leadership.
| Metric | 2024 value |
|---|---|
| Electric customers | ~2.3M |
| NJ solar capacity | 4.8 GW |
| Federal clean funds | $7.5B (BIL) / NEVI ~$5B |
What is included in the product
 Detailed Word Document
In-depth BCG Matrix review of Public Service Enterprise Group, detailing Stars, Cash Cows, Question Marks, Dogs and strategic moves.

 Customizable Excel Spreadsheet
One-page BCG matrix placing each Public Service Enterprise Group unit in a quadrant for clear, C-level ready decisions
Cash Cows

Regulated Electric Distribution Base
Regulated electric distribution is PSEG’s mature, sticky cash cow, serving roughly 2.2 million New Jersey customers and underpinning the utility’s stable earnings. It produces steady margins and dependable cash flow, historically representing over 50% of consolidated EBITDA. With limited organic growth and low promotional needs, focus is on reliability and cost discipline—milk returns without starving the asset.
Regulated Gas Distribution
Regulated gas distribution at PSEG (PSE&G serves about 2.3 million gas customers in 2024) provides a large installed base and predictable, utility-regulated returns. Growth is modest but cash conversion remains solid, funding dividends and capex. Investments prioritize safety and pipe replacement over expansion, and modernization continues while actively managing decarbonization and supply-risk exposures.

Existing Transmission in Rate Base
Existing transmission in rate base delivers high-share, regulated returns—authorized ROE in the utility sector hovered near 9.5% in 2024—providing steady cash to PSEG. Growth is lower than new-build renewables, but cash generation remains strong and funds dividends and reinvestment. Incremental marketing/overhead is minimal; focus on O&M optimization and high availability preserves yield and extends asset life.

Nuclear Fleet (with ZEC support)
Nuclear Fleet (Salem 1, Salem 2, Hope Creek) functions as a cash cow: market growth for baseload nuclear is low, but combined net capacity ~3.56 GW produced ~28.7 TWh in 2024 at ~92% capacity factor, delivering large, reliable output. New Jersey ZECs stabilize merchant revenue streams, converting volatile market swings into predictable cash. Ongoing capex is modest versus greenfield development; flawless operations plus hedging of refueling/cycle costs maximize free cash.
- Assets: 3 reactors (Salem/ Hope Creek)
- Capacity: ~3.56 GW
- 2024 output: ~28.7 TWh
- ZECs: revenue stability
- Strategy: operational excellence + refuel hedges
Customer Operations & Billing Platform
Customer Operations & Billing Platform is a cash cow: it serves PSEG’s core customer base (~3.5 million customers), delivers stable margins with incremental growth, and requires low promotional spend due to retention typically above 90% in the utility sector (2024). Continued automation and self-service investments keep operating costs down and cash generation steady.
- Essential service; scale efficiencies realized
- Steady margins; incremental growth
- Low promotional needs; >90% retention (2024 sector)
- Focus: automation and self-service to sustain cash flow
>50% cash from regulated electric & gas; nuclear 3.56GW
PSEG cash cows: regulated electric (≈2.2M customers) and gas (≈2.3M) deliver stable, >50% EBITDA-like cash flow; transmission yields regulated returns (~9.5% ROE in 2024); nuclear fleet (~3.56 GW, 28.7 TWh in 2024) produces predictable baseload cash aided by ZECs; customer ops (~3.5M customers, >90% retention) keeps margins and cash conversion high.
| Asset | Key metric (2024) |
|---|---|
| Electric customers | ≈2.2M |
| Gas customers | ≈2.3M |
| Nuclear | 3.56 GW / 28.7 TWh |
| ROE (transmission) | ~9.5% |
| Customer base | ≈3.5M / >90% retention |
What You See Is What You Get
Public Service Enterprise Group BCG Matrix
The file you're previewing is the final Public Service Enterprise Group BCG Matrix you'll receive after purchase. No watermarks or demo content—just a fully formatted, analysis-ready report tailored to PSEG's portfolio. It's the exact document you'll download: editable, printable, and built for immediate use in strategy meetings or investor decks. Buy once and get the ready-to-present file delivered instantly to your inbox—no surprises.

Unlock Strategic Clarity
Public Service Enterprise Group’s BCG Matrix preview shows where its division units sit in a shifting energy market — which assets are Stars, which are steady Cash Cows, and which demand tough choices. You’ll see early signals of growth potential and areas eating cash, but this snapshot is only the start. Purchase the full BCG Matrix for quadrant-by-quadrant placement, data-backed recommendations, and a strategic roadmap tailored to PSEG’s unique mix. Get instant access in Word and Excel to present, plan, and act with confidence.
Stars
PSE&G Energy Efficiency Programs
PSE&G Energy Efficiency programs benefit from strong NJ policy tailwinds, including the state’s 100% clean energy target by 2050, driving fast-growing spend. PSE&G serves roughly 2.3 million customers, giving scale, brand access and high, defensible share. Programs require substantial upfront cash—hundreds of millions annually for incentives and delivery. Continue investing to cement leadership before the market matures.
Grid Modernization & AMI Rollout
Grid modernization and AMI rollout represent a large capex wave with big reliability wins and a long runway—classic high growth: PSE&G serves ~2.3 million electric and ~1.9 million gas customers, so meter and distribution upgrades scale in-house. Share sits firmly with PSE&G because it owns the wire and customer relationship. Cash needs are hefty now; payoff accrues through rate base recovery and performance incentives under 2024 regulatory frameworks. Push is to finish deployment fast and lock in operational gains.
Transmission Expansion for Renewable Interconnects
Regional demand for new lines and upgrades is rising quickly as New Jersey targets 7.5 GW of offshore wind by 2035 and broader clean-energy goals; interconnection needs are intensifying. As the dominant NJ utility serving about 2.3 million electric customers, PSE&G holds incumbent advantage and regulator credibility. These capital-hungry projects support durable, regulated earnings. Prioritize shovel-ready corridors to capture the surge.
Clean Energy Infrastructure (make-ready, fleet electrification)
Clean Energy Infrastructure (make-ready, fleet electrification) is a Stars play: EVs reached double-digit share of new U.S. car sales in 2024 and federal programs (Bipartisan Infrastructure Law $7.5B, NEVI ~$5B) accelerate demand. PSE&G can own the enablement layer and win high share via policy-backed programs but needs significant near-term capex and complex coordination. Scale early, standardize designs, turn volume into margin.
- Invest early to capture market share
- Standardize designs to lower unit cost
- Leverage $7.5B federal funding/NEVI to de-risk adoption
Community & Distributed Solar Enablement
Rapid, policy-driven solar growth—New Jersey reached about 4.8 GW of solar by 2024—creates strong customer pull; PSE&G, serving roughly 2.3 million customers, leverages interconnection, hosting-capacity maps and program administration to capture structural share. Capital outlays are upfront while benefits scale via throughput and rate base; streamlining interconnects keeps projects flowing and costs controlled.
- Policy growth: 4.8 GW NJ (2024)
- Structural share: interconnect + hosting capacity + program admin
- Economics: upfront capex → throughput/rate-base recovery
- Action: expedite interconnects to limit delays/costs
NJ utility poised to lock leadership: 2.3M customers, clean-by-2050 tailwinds
PSE&G Stars benefit from NJ 100% clean-by-2050 policy and strong 2024 tailwinds. Scale: ~2.3M electric customers, defensible share across grid, EE and interconnection. Capital-intensive now (hundreds of millions annually) with rate-base recovery and incentives; prioritize fast deployment to lock market leadership.
| Metric | 2024 value |
|---|---|
| Electric customers | ~2.3M |
| NJ solar capacity | 4.8 GW |
| Federal clean funds | $7.5B (BIL) / NEVI ~$5B |
What is included in the product
Detailed Word Document
In-depth BCG Matrix review of Public Service Enterprise Group, detailing Stars, Cash Cows, Question Marks, Dogs and strategic moves.
Customizable Excel Spreadsheet
One-page BCG matrix placing each Public Service Enterprise Group unit in a quadrant for clear, C-level ready decisions
Cash Cows
Regulated Electric Distribution Base
Regulated electric distribution is PSEG’s mature, sticky cash cow, serving roughly 2.2 million New Jersey customers and underpinning the utility’s stable earnings. It produces steady margins and dependable cash flow, historically representing over 50% of consolidated EBITDA. With limited organic growth and low promotional needs, focus is on reliability and cost discipline—milk returns without starving the asset.
Regulated Gas Distribution
Regulated gas distribution at PSEG (PSE&G serves about 2.3 million gas customers in 2024) provides a large installed base and predictable, utility-regulated returns. Growth is modest but cash conversion remains solid, funding dividends and capex. Investments prioritize safety and pipe replacement over expansion, and modernization continues while actively managing decarbonization and supply-risk exposures.
Existing Transmission in Rate Base
Existing transmission in rate base delivers high-share, regulated returns—authorized ROE in the utility sector hovered near 9.5% in 2024—providing steady cash to PSEG. Growth is lower than new-build renewables, but cash generation remains strong and funds dividends and reinvestment. Incremental marketing/overhead is minimal; focus on O&M optimization and high availability preserves yield and extends asset life.
Nuclear Fleet (with ZEC support)
Nuclear Fleet (Salem 1, Salem 2, Hope Creek) functions as a cash cow: market growth for baseload nuclear is low, but combined net capacity ~3.56 GW produced ~28.7 TWh in 2024 at ~92% capacity factor, delivering large, reliable output. New Jersey ZECs stabilize merchant revenue streams, converting volatile market swings into predictable cash. Ongoing capex is modest versus greenfield development; flawless operations plus hedging of refueling/cycle costs maximize free cash.
- Assets: 3 reactors (Salem/ Hope Creek)
- Capacity: ~3.56 GW
- 2024 output: ~28.7 TWh
- ZECs: revenue stability
- Strategy: operational excellence + refuel hedges
Customer Operations & Billing Platform
Customer Operations & Billing Platform is a cash cow: it serves PSEG’s core customer base (~3.5 million customers), delivers stable margins with incremental growth, and requires low promotional spend due to retention typically above 90% in the utility sector (2024). Continued automation and self-service investments keep operating costs down and cash generation steady.
- Essential service; scale efficiencies realized
- Steady margins; incremental growth
- Low promotional needs; >90% retention (2024 sector)
- Focus: automation and self-service to sustain cash flow
>50% cash from regulated electric & gas; nuclear 3.56GW
PSEG cash cows: regulated electric (≈2.2M customers) and gas (≈2.3M) deliver stable, >50% EBITDA-like cash flow; transmission yields regulated returns (~9.5% ROE in 2024); nuclear fleet (~3.56 GW, 28.7 TWh in 2024) produces predictable baseload cash aided by ZECs; customer ops (~3.5M customers, >90% retention) keeps margins and cash conversion high.
| Asset | Key metric (2024) |
|---|---|
| Electric customers | ≈2.2M |
| Gas customers | ≈2.3M |
| Nuclear | 3.56 GW / 28.7 TWh |
| ROE (transmission) | ~9.5% |
| Customer base | ≈3.5M / >90% retention |
What You See Is What You Get
Public Service Enterprise Group BCG Matrix
The file you're previewing is the final Public Service Enterprise Group BCG Matrix you'll receive after purchase. No watermarks or demo content—just a fully formatted, analysis-ready report tailored to PSEG's portfolio. It's the exact document you'll download: editable, printable, and built for immediate use in strategy meetings or investor decks. Buy once and get the ready-to-present file delivered instantly to your inbox—no surprises.
Description
Unlock Strategic Clarity
Public Service Enterprise Group’s BCG Matrix preview shows where its division units sit in a shifting energy market — which assets are Stars, which are steady Cash Cows, and which demand tough choices. You’ll see early signals of growth potential and areas eating cash, but this snapshot is only the start. Purchase the full BCG Matrix for quadrant-by-quadrant placement, data-backed recommendations, and a strategic roadmap tailored to PSEG’s unique mix. Get instant access in Word and Excel to present, plan, and act with confidence.
Stars
PSE&G Energy Efficiency Programs
PSE&G Energy Efficiency programs benefit from strong NJ policy tailwinds, including the state’s 100% clean energy target by 2050, driving fast-growing spend. PSE&G serves roughly 2.3 million customers, giving scale, brand access and high, defensible share. Programs require substantial upfront cash—hundreds of millions annually for incentives and delivery. Continue investing to cement leadership before the market matures.
Grid Modernization & AMI Rollout
Grid modernization and AMI rollout represent a large capex wave with big reliability wins and a long runway—classic high growth: PSE&G serves ~2.3 million electric and ~1.9 million gas customers, so meter and distribution upgrades scale in-house. Share sits firmly with PSE&G because it owns the wire and customer relationship. Cash needs are hefty now; payoff accrues through rate base recovery and performance incentives under 2024 regulatory frameworks. Push is to finish deployment fast and lock in operational gains.
Transmission Expansion for Renewable Interconnects
Regional demand for new lines and upgrades is rising quickly as New Jersey targets 7.5 GW of offshore wind by 2035 and broader clean-energy goals; interconnection needs are intensifying. As the dominant NJ utility serving about 2.3 million electric customers, PSE&G holds incumbent advantage and regulator credibility. These capital-hungry projects support durable, regulated earnings. Prioritize shovel-ready corridors to capture the surge.
Clean Energy Infrastructure (make-ready, fleet electrification)
Clean Energy Infrastructure (make-ready, fleet electrification) is a Stars play: EVs reached double-digit share of new U.S. car sales in 2024 and federal programs (Bipartisan Infrastructure Law $7.5B, NEVI ~$5B) accelerate demand. PSE&G can own the enablement layer and win high share via policy-backed programs but needs significant near-term capex and complex coordination. Scale early, standardize designs, turn volume into margin.
- Invest early to capture market share
- Standardize designs to lower unit cost
- Leverage $7.5B federal funding/NEVI to de-risk adoption
Community & Distributed Solar Enablement
Rapid, policy-driven solar growth—New Jersey reached about 4.8 GW of solar by 2024—creates strong customer pull; PSE&G, serving roughly 2.3 million customers, leverages interconnection, hosting-capacity maps and program administration to capture structural share. Capital outlays are upfront while benefits scale via throughput and rate base; streamlining interconnects keeps projects flowing and costs controlled.
- Policy growth: 4.8 GW NJ (2024)
- Structural share: interconnect + hosting capacity + program admin
- Economics: upfront capex → throughput/rate-base recovery
- Action: expedite interconnects to limit delays/costs
NJ utility poised to lock leadership: 2.3M customers, clean-by-2050 tailwinds
PSE&G Stars benefit from NJ 100% clean-by-2050 policy and strong 2024 tailwinds. Scale: ~2.3M electric customers, defensible share across grid, EE and interconnection. Capital-intensive now (hundreds of millions annually) with rate-base recovery and incentives; prioritize fast deployment to lock market leadership.
| Metric | 2024 value |
|---|---|
| Electric customers | ~2.3M |
| NJ solar capacity | 4.8 GW |
| Federal clean funds | $7.5B (BIL) / NEVI ~$5B |
What is included in the product
Detailed Word Document
In-depth BCG Matrix review of Public Service Enterprise Group, detailing Stars, Cash Cows, Question Marks, Dogs and strategic moves.
Customizable Excel Spreadsheet
One-page BCG matrix placing each Public Service Enterprise Group unit in a quadrant for clear, C-level ready decisions
Cash Cows
Regulated Electric Distribution Base
Regulated electric distribution is PSEG’s mature, sticky cash cow, serving roughly 2.2 million New Jersey customers and underpinning the utility’s stable earnings. It produces steady margins and dependable cash flow, historically representing over 50% of consolidated EBITDA. With limited organic growth and low promotional needs, focus is on reliability and cost discipline—milk returns without starving the asset.
Regulated Gas Distribution
Regulated gas distribution at PSEG (PSE&G serves about 2.3 million gas customers in 2024) provides a large installed base and predictable, utility-regulated returns. Growth is modest but cash conversion remains solid, funding dividends and capex. Investments prioritize safety and pipe replacement over expansion, and modernization continues while actively managing decarbonization and supply-risk exposures.
Existing Transmission in Rate Base
Existing transmission in rate base delivers high-share, regulated returns—authorized ROE in the utility sector hovered near 9.5% in 2024—providing steady cash to PSEG. Growth is lower than new-build renewables, but cash generation remains strong and funds dividends and reinvestment. Incremental marketing/overhead is minimal; focus on O&M optimization and high availability preserves yield and extends asset life.
Nuclear Fleet (with ZEC support)
Nuclear Fleet (Salem 1, Salem 2, Hope Creek) functions as a cash cow: market growth for baseload nuclear is low, but combined net capacity ~3.56 GW produced ~28.7 TWh in 2024 at ~92% capacity factor, delivering large, reliable output. New Jersey ZECs stabilize merchant revenue streams, converting volatile market swings into predictable cash. Ongoing capex is modest versus greenfield development; flawless operations plus hedging of refueling/cycle costs maximize free cash.
- Assets: 3 reactors (Salem/ Hope Creek)
- Capacity: ~3.56 GW
- 2024 output: ~28.7 TWh
- ZECs: revenue stability
- Strategy: operational excellence + refuel hedges
Customer Operations & Billing Platform
Customer Operations & Billing Platform is a cash cow: it serves PSEG’s core customer base (~3.5 million customers), delivers stable margins with incremental growth, and requires low promotional spend due to retention typically above 90% in the utility sector (2024). Continued automation and self-service investments keep operating costs down and cash generation steady.
- Essential service; scale efficiencies realized
- Steady margins; incremental growth
- Low promotional needs; >90% retention (2024 sector)
- Focus: automation and self-service to sustain cash flow
>50% cash from regulated electric & gas; nuclear 3.56GW
PSEG cash cows: regulated electric (≈2.2M customers) and gas (≈2.3M) deliver stable, >50% EBITDA-like cash flow; transmission yields regulated returns (~9.5% ROE in 2024); nuclear fleet (~3.56 GW, 28.7 TWh in 2024) produces predictable baseload cash aided by ZECs; customer ops (~3.5M customers, >90% retention) keeps margins and cash conversion high.
| Asset | Key metric (2024) |
|---|---|
| Electric customers | ≈2.2M |
| Gas customers | ≈2.3M |
| Nuclear | 3.56 GW / 28.7 TWh |
| ROE (transmission) | ~9.5% |
| Customer base | ≈3.5M / >90% retention |
What You See Is What You Get
Public Service Enterprise Group BCG Matrix
The file you're previewing is the final Public Service Enterprise Group BCG Matrix you'll receive after purchase. No watermarks or demo content—just a fully formatted, analysis-ready report tailored to PSEG's portfolio. It's the exact document you'll download: editable, printable, and built for immediate use in strategy meetings or investor decks. Buy once and get the ready-to-present file delivered instantly to your inbox—no surprises.











