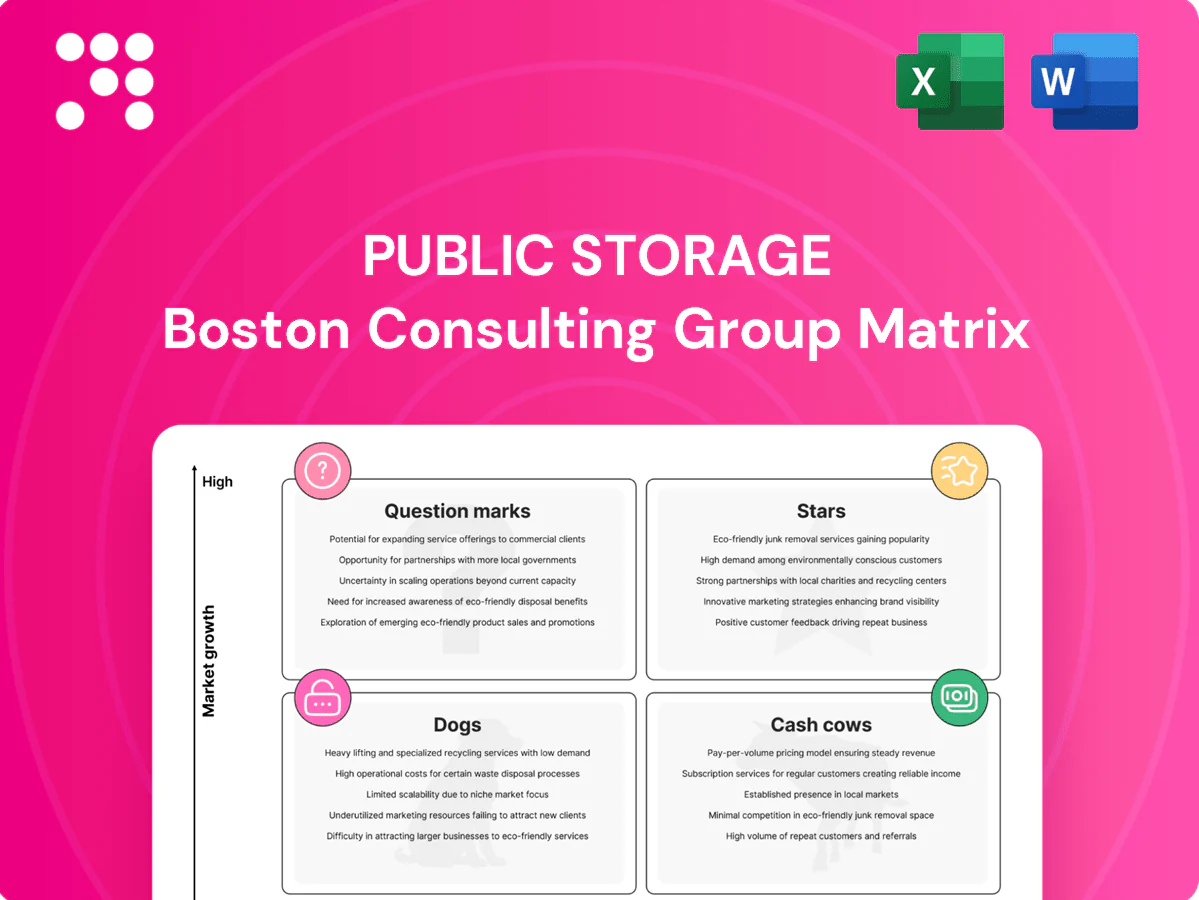
Public Storage Boston Consulting Group Matrix

See the Bigger Picture
Take a quick look at Public Storage’s BCG Matrix to see which offerings are Stars, Cash Cows, Dogs or Question Marks—and why that matters for your capital decisions. The full report maps every product to its quadrant, gives data-backed recommendations and a clear playbook for growth or containment. Purchase the complete BCG Matrix for instant Word and Excel deliverables you can present and act on—skip the research, get strategic clarity fast.
Stars

Urban infill facilities in fast-growing metros
High-density Sunbelt metros and migration hotspots added rooftops and small businesses in 2024, keeping self-storage absorption strong; Public Storage, the largest operator, held roughly 15% of U.S. store count in 2024, letting it price smart and sustain high occupancy without racing to the bottom. Feed these markets with selective new builds and tuck-ins to protect yields. As growth normalizes, these assets will transition toward Cash Cow status.
Digital leasing and revenue management engine
Online reservations, dynamic pricing, and frictionless move-ins are driving higher yields for Public Storage, with digital bookings exceeding 40% of move-ins in 2024 and contributing to an approximate 5% uplift in realized rent year-over-year. The platform scales across the portfolio, converting demand spikes into higher realized rent rather than just traffic. It remains capital-light but growth-heavy, supporting faster revenue compounding. Keep investing—this is a Star that compounds.

Premium climate-controlled and business storage
Climate-controlled units and business-friendly features (extended access, package handling) command roughly 10–20% rent premiums and drove stronger traction in 2024 as e‑commerce spillover and sensitive-goods storage tightened supply; national self-storage occupancy averaged about 92% in 2024. Public Storage, with about 2,600 properties in 2024 and dense urban footprints, is positioned to lead that segment. Targeted promotion spend in these markets typically pays back rapidly via higher yields and lower downtime.

Brand scale with top-of-funnel dominance
When customers think storage they think orange doors; Public Storage, the largest US self-storage REIT with thousands of facilities as of 2024, is the first call in a growing category, creating a durable moat. Brand trust plus national advertising keeps CAC efficient even as demand rises, but that leadership requires ongoing marketing spend to defend. Done right, it forces rivals to follow, not set, price.
- Top-of-funnel dominance: orange-brand recall
- Scale: thousands of 2024 facilities
- Defense: sustained ad spend to protect pricing
Select European expansion beachheads
Urban Europe remains underpenetrated versus the U.S.: 2024 self-storage supply roughly 8.5 sq ft per capita in the U.S. versus about 0.8 sq ft in major Western European cities, while Eurostat 2024 shows average household size near 2.3 and rising urban mobility—drivers mirror the U.S. Early share in the right cities can snowball as awareness builds; growth is marketing-intensive, so pick markets carefully and double down as adoption curves steepen.
- Tag: underpenetration
- Tag: 2024-data
- Tag: urban-mobility
- Tag: marketing-heavy
- Tag: double-down
Sunbelt demand: 92% occupancy, digital bookings >40% and ~5% realized rent uplift
Sunbelt metros drove strong 2024 absorption; Public Storage held ~15% of US stores (≈2,600 properties) and national occupancy averaged ~92%, keeping yields high. Digital bookings exceeded 40% of move-ins in 2024, supporting ~5% realized rent uplift year-over-year. Climate-controlled and business features fetched 10–20% rent premiums, making these Stars likely Cash Cows as growth normalizes.
| Metric | 2024 |
|---|---|
| Store count (PSA) | ≈2,600 |
| Market share (by stores) | ~15% |
| Occupancy (US avg) | ~92% |
| Digital bookings | >40% |
| Realized rent uplift | ~+5% YoY |
What is included in the product
 Detailed Word Document
In-depth BCG analysis of Public Storage's business units, identifying Stars, Cash Cows, Question Marks and Dogs with investment guidance.

 Customizable Excel Spreadsheet
One-page Public Storage BCG Matrix pinpointing underperformers and growth bets for fast strategic decisions
Cash Cows

Stabilized coastal and tier-1 assets
Decades-old Public Storage coastal and tier-1 assets sit in supply-constrained metros and operate at 90%+ occupancy, generating steady, high-margin cashflow. Low incremental capex, routine rent bumps and minimal promotions keep NOI margins elevated, allowing these units to bankroll expansion and redevelopment. Milk gently: maintain curb appeal and service levels, avoid costly over-engineering to preserve returns.
Long-tenured customers on autopay
Long-tenured renters on autopay form Public Storage’s dependable cash cow: with roughly 2,700 US facilities and consolidated occupancy near 93% in 2024, autopay keeps churn low and collections clean. Modest periodic rate bumps flow straight to NOI; autopay penetration (circa 55%) cuts late payments and turnover. Little marketing required to retain these customers—steady, predictable cash for the REIT.

Ancillary income: insurance, locks, admin fees
Ancillary income—insurance, locks, admin fees—scales with occupancy and carries minimal opex, supporting margins at Public Storage, which in 2024 operated over 2,600 facilities and roughly 170 million rentable square feet with occupancy near 95%. Insurance is especially high-margin and predictable, while small line items across millions of customers compound into material non-rent revenue. Keep compliance tight and the customer experience fair to preserve trust and conversion.

Stabilized suburban portfolios with limited new supply
Stabilized suburban portfolios dominate in mature suburbs where zoning blocks new builds, with occupancy averaging about 95% in 2024, keeping price competition muted and margins steady; same-store revenue grew roughly 6% in 2024. Minor capex (cosmetic, climate control adds) can lift ARPU ~3–4% without large outlays. Strategy: harvest and maintain—no heroics.
- Occupancy: ~95% (2024)
- Same-store rev growth: ~6% (2024)
- ARPU lift from minor upgrades: ~3–4%
- Strategy: harvest & maintain
Operating efficiency from scale (central call centers, tech)
Public Storage leverages centralized call centers and shared tech to shave operating costs per unit while maintaining consistent service; the company operates roughly 2,700 facilities and about 170 million rentable square feet (2024). At maturity the platform runs with light touch, producing cash flows that exceed reinvestment needs. Surplus cash funds high-growth assets and accelerates debt paydown.
- scale-efficiency
- low-maintenance cash flow
- funds-stars
- debt-retirement
Coastal & suburban storage cash cows - ~2.7K sites, ~95% occupancy
Public Storage cash cows: coastal and suburban portfolios (~2,700 facilities, 170M sqft) operate at ~95% occupancy in 2024, delivering high-margin, low-capex NOI that funds growth and debt reduction. Autopay (~55%) and ancillary fees boost collections and margins; same-store revenue +6% in 2024. Harvest with light-touch upkeep and modest ARPU-driving upgrades.
| Metric | 2024 |
|---|---|
| Facilities | ~2,700 |
| Rentable sqft | ~170M |
| Occupancy | ~95% |
| SS Rev Growth | ~6% |
| Autopay | ~55% |
What You’re Viewing Is Included
Public Storage BCG Matrix
The Public Storage BCG Matrix you're previewing is the exact file you'll get after purchase. No demo overlays, no watermarks—just a clean, fully formatted strategic report. It's built for immediate use: edit, print, or present without extra work. Crafted by analysts for clarity, it arrives ready to plug into your planning. Buy once, download instantly—no surprises.

See the Bigger Picture
Take a quick look at Public Storage’s BCG Matrix to see which offerings are Stars, Cash Cows, Dogs or Question Marks—and why that matters for your capital decisions. The full report maps every product to its quadrant, gives data-backed recommendations and a clear playbook for growth or containment. Purchase the complete BCG Matrix for instant Word and Excel deliverables you can present and act on—skip the research, get strategic clarity fast.
Stars
Urban infill facilities in fast-growing metros
High-density Sunbelt metros and migration hotspots added rooftops and small businesses in 2024, keeping self-storage absorption strong; Public Storage, the largest operator, held roughly 15% of U.S. store count in 2024, letting it price smart and sustain high occupancy without racing to the bottom. Feed these markets with selective new builds and tuck-ins to protect yields. As growth normalizes, these assets will transition toward Cash Cow status.
Digital leasing and revenue management engine
Online reservations, dynamic pricing, and frictionless move-ins are driving higher yields for Public Storage, with digital bookings exceeding 40% of move-ins in 2024 and contributing to an approximate 5% uplift in realized rent year-over-year. The platform scales across the portfolio, converting demand spikes into higher realized rent rather than just traffic. It remains capital-light but growth-heavy, supporting faster revenue compounding. Keep investing—this is a Star that compounds.
Premium climate-controlled and business storage
Climate-controlled units and business-friendly features (extended access, package handling) command roughly 10–20% rent premiums and drove stronger traction in 2024 as e‑commerce spillover and sensitive-goods storage tightened supply; national self-storage occupancy averaged about 92% in 2024. Public Storage, with about 2,600 properties in 2024 and dense urban footprints, is positioned to lead that segment. Targeted promotion spend in these markets typically pays back rapidly via higher yields and lower downtime.
Brand scale with top-of-funnel dominance
When customers think storage they think orange doors; Public Storage, the largest US self-storage REIT with thousands of facilities as of 2024, is the first call in a growing category, creating a durable moat. Brand trust plus national advertising keeps CAC efficient even as demand rises, but that leadership requires ongoing marketing spend to defend. Done right, it forces rivals to follow, not set, price.
- Top-of-funnel dominance: orange-brand recall
- Scale: thousands of 2024 facilities
- Defense: sustained ad spend to protect pricing
Select European expansion beachheads
Urban Europe remains underpenetrated versus the U.S.: 2024 self-storage supply roughly 8.5 sq ft per capita in the U.S. versus about 0.8 sq ft in major Western European cities, while Eurostat 2024 shows average household size near 2.3 and rising urban mobility—drivers mirror the U.S. Early share in the right cities can snowball as awareness builds; growth is marketing-intensive, so pick markets carefully and double down as adoption curves steepen.
- Tag: underpenetration
- Tag: 2024-data
- Tag: urban-mobility
- Tag: marketing-heavy
- Tag: double-down
Sunbelt demand: 92% occupancy, digital bookings >40% and ~5% realized rent uplift
Sunbelt metros drove strong 2024 absorption; Public Storage held ~15% of US stores (≈2,600 properties) and national occupancy averaged ~92%, keeping yields high. Digital bookings exceeded 40% of move-ins in 2024, supporting ~5% realized rent uplift year-over-year. Climate-controlled and business features fetched 10–20% rent premiums, making these Stars likely Cash Cows as growth normalizes.
| Metric | 2024 |
|---|---|
| Store count (PSA) | ≈2,600 |
| Market share (by stores) | ~15% |
| Occupancy (US avg) | ~92% |
| Digital bookings | >40% |
| Realized rent uplift | ~+5% YoY |
What is included in the product
Detailed Word Document
In-depth BCG analysis of Public Storage's business units, identifying Stars, Cash Cows, Question Marks and Dogs with investment guidance.
Customizable Excel Spreadsheet
One-page Public Storage BCG Matrix pinpointing underperformers and growth bets for fast strategic decisions
Cash Cows
Stabilized coastal and tier-1 assets
Decades-old Public Storage coastal and tier-1 assets sit in supply-constrained metros and operate at 90%+ occupancy, generating steady, high-margin cashflow. Low incremental capex, routine rent bumps and minimal promotions keep NOI margins elevated, allowing these units to bankroll expansion and redevelopment. Milk gently: maintain curb appeal and service levels, avoid costly over-engineering to preserve returns.
Long-tenured customers on autopay
Long-tenured renters on autopay form Public Storage’s dependable cash cow: with roughly 2,700 US facilities and consolidated occupancy near 93% in 2024, autopay keeps churn low and collections clean. Modest periodic rate bumps flow straight to NOI; autopay penetration (circa 55%) cuts late payments and turnover. Little marketing required to retain these customers—steady, predictable cash for the REIT.
Ancillary income: insurance, locks, admin fees
Ancillary income—insurance, locks, admin fees—scales with occupancy and carries minimal opex, supporting margins at Public Storage, which in 2024 operated over 2,600 facilities and roughly 170 million rentable square feet with occupancy near 95%. Insurance is especially high-margin and predictable, while small line items across millions of customers compound into material non-rent revenue. Keep compliance tight and the customer experience fair to preserve trust and conversion.
Stabilized suburban portfolios with limited new supply
Stabilized suburban portfolios dominate in mature suburbs where zoning blocks new builds, with occupancy averaging about 95% in 2024, keeping price competition muted and margins steady; same-store revenue grew roughly 6% in 2024. Minor capex (cosmetic, climate control adds) can lift ARPU ~3–4% without large outlays. Strategy: harvest and maintain—no heroics.
- Occupancy: ~95% (2024)
- Same-store rev growth: ~6% (2024)
- ARPU lift from minor upgrades: ~3–4%
- Strategy: harvest & maintain
Operating efficiency from scale (central call centers, tech)
Public Storage leverages centralized call centers and shared tech to shave operating costs per unit while maintaining consistent service; the company operates roughly 2,700 facilities and about 170 million rentable square feet (2024). At maturity the platform runs with light touch, producing cash flows that exceed reinvestment needs. Surplus cash funds high-growth assets and accelerates debt paydown.
- scale-efficiency
- low-maintenance cash flow
- funds-stars
- debt-retirement
Coastal & suburban storage cash cows - ~2.7K sites, ~95% occupancy
Public Storage cash cows: coastal and suburban portfolios (~2,700 facilities, 170M sqft) operate at ~95% occupancy in 2024, delivering high-margin, low-capex NOI that funds growth and debt reduction. Autopay (~55%) and ancillary fees boost collections and margins; same-store revenue +6% in 2024. Harvest with light-touch upkeep and modest ARPU-driving upgrades.
| Metric | 2024 |
|---|---|
| Facilities | ~2,700 |
| Rentable sqft | ~170M |
| Occupancy | ~95% |
| SS Rev Growth | ~6% |
| Autopay | ~55% |
What You’re Viewing Is Included
Public Storage BCG Matrix
The Public Storage BCG Matrix you're previewing is the exact file you'll get after purchase. No demo overlays, no watermarks—just a clean, fully formatted strategic report. It's built for immediate use: edit, print, or present without extra work. Crafted by analysts for clarity, it arrives ready to plug into your planning. Buy once, download instantly—no surprises.
Original: $10.00
-65%$10.00
$3.50Description
See the Bigger Picture
Take a quick look at Public Storage’s BCG Matrix to see which offerings are Stars, Cash Cows, Dogs or Question Marks—and why that matters for your capital decisions. The full report maps every product to its quadrant, gives data-backed recommendations and a clear playbook for growth or containment. Purchase the complete BCG Matrix for instant Word and Excel deliverables you can present and act on—skip the research, get strategic clarity fast.
Stars
Urban infill facilities in fast-growing metros
High-density Sunbelt metros and migration hotspots added rooftops and small businesses in 2024, keeping self-storage absorption strong; Public Storage, the largest operator, held roughly 15% of U.S. store count in 2024, letting it price smart and sustain high occupancy without racing to the bottom. Feed these markets with selective new builds and tuck-ins to protect yields. As growth normalizes, these assets will transition toward Cash Cow status.
Digital leasing and revenue management engine
Online reservations, dynamic pricing, and frictionless move-ins are driving higher yields for Public Storage, with digital bookings exceeding 40% of move-ins in 2024 and contributing to an approximate 5% uplift in realized rent year-over-year. The platform scales across the portfolio, converting demand spikes into higher realized rent rather than just traffic. It remains capital-light but growth-heavy, supporting faster revenue compounding. Keep investing—this is a Star that compounds.
Premium climate-controlled and business storage
Climate-controlled units and business-friendly features (extended access, package handling) command roughly 10–20% rent premiums and drove stronger traction in 2024 as e‑commerce spillover and sensitive-goods storage tightened supply; national self-storage occupancy averaged about 92% in 2024. Public Storage, with about 2,600 properties in 2024 and dense urban footprints, is positioned to lead that segment. Targeted promotion spend in these markets typically pays back rapidly via higher yields and lower downtime.
Brand scale with top-of-funnel dominance
When customers think storage they think orange doors; Public Storage, the largest US self-storage REIT with thousands of facilities as of 2024, is the first call in a growing category, creating a durable moat. Brand trust plus national advertising keeps CAC efficient even as demand rises, but that leadership requires ongoing marketing spend to defend. Done right, it forces rivals to follow, not set, price.
- Top-of-funnel dominance: orange-brand recall
- Scale: thousands of 2024 facilities
- Defense: sustained ad spend to protect pricing
Select European expansion beachheads
Urban Europe remains underpenetrated versus the U.S.: 2024 self-storage supply roughly 8.5 sq ft per capita in the U.S. versus about 0.8 sq ft in major Western European cities, while Eurostat 2024 shows average household size near 2.3 and rising urban mobility—drivers mirror the U.S. Early share in the right cities can snowball as awareness builds; growth is marketing-intensive, so pick markets carefully and double down as adoption curves steepen.
- Tag: underpenetration
- Tag: 2024-data
- Tag: urban-mobility
- Tag: marketing-heavy
- Tag: double-down
Sunbelt demand: 92% occupancy, digital bookings >40% and ~5% realized rent uplift
Sunbelt metros drove strong 2024 absorption; Public Storage held ~15% of US stores (≈2,600 properties) and national occupancy averaged ~92%, keeping yields high. Digital bookings exceeded 40% of move-ins in 2024, supporting ~5% realized rent uplift year-over-year. Climate-controlled and business features fetched 10–20% rent premiums, making these Stars likely Cash Cows as growth normalizes.
| Metric | 2024 |
|---|---|
| Store count (PSA) | ≈2,600 |
| Market share (by stores) | ~15% |
| Occupancy (US avg) | ~92% |
| Digital bookings | >40% |
| Realized rent uplift | ~+5% YoY |
What is included in the product
Detailed Word Document
In-depth BCG analysis of Public Storage's business units, identifying Stars, Cash Cows, Question Marks and Dogs with investment guidance.
Customizable Excel Spreadsheet
One-page Public Storage BCG Matrix pinpointing underperformers and growth bets for fast strategic decisions
Cash Cows
Stabilized coastal and tier-1 assets
Decades-old Public Storage coastal and tier-1 assets sit in supply-constrained metros and operate at 90%+ occupancy, generating steady, high-margin cashflow. Low incremental capex, routine rent bumps and minimal promotions keep NOI margins elevated, allowing these units to bankroll expansion and redevelopment. Milk gently: maintain curb appeal and service levels, avoid costly over-engineering to preserve returns.
Long-tenured customers on autopay
Long-tenured renters on autopay form Public Storage’s dependable cash cow: with roughly 2,700 US facilities and consolidated occupancy near 93% in 2024, autopay keeps churn low and collections clean. Modest periodic rate bumps flow straight to NOI; autopay penetration (circa 55%) cuts late payments and turnover. Little marketing required to retain these customers—steady, predictable cash for the REIT.
Ancillary income: insurance, locks, admin fees
Ancillary income—insurance, locks, admin fees—scales with occupancy and carries minimal opex, supporting margins at Public Storage, which in 2024 operated over 2,600 facilities and roughly 170 million rentable square feet with occupancy near 95%. Insurance is especially high-margin and predictable, while small line items across millions of customers compound into material non-rent revenue. Keep compliance tight and the customer experience fair to preserve trust and conversion.
Stabilized suburban portfolios with limited new supply
Stabilized suburban portfolios dominate in mature suburbs where zoning blocks new builds, with occupancy averaging about 95% in 2024, keeping price competition muted and margins steady; same-store revenue grew roughly 6% in 2024. Minor capex (cosmetic, climate control adds) can lift ARPU ~3–4% without large outlays. Strategy: harvest and maintain—no heroics.
- Occupancy: ~95% (2024)
- Same-store rev growth: ~6% (2024)
- ARPU lift from minor upgrades: ~3–4%
- Strategy: harvest & maintain
Operating efficiency from scale (central call centers, tech)
Public Storage leverages centralized call centers and shared tech to shave operating costs per unit while maintaining consistent service; the company operates roughly 2,700 facilities and about 170 million rentable square feet (2024). At maturity the platform runs with light touch, producing cash flows that exceed reinvestment needs. Surplus cash funds high-growth assets and accelerates debt paydown.
- scale-efficiency
- low-maintenance cash flow
- funds-stars
- debt-retirement
Coastal & suburban storage cash cows - ~2.7K sites, ~95% occupancy
Public Storage cash cows: coastal and suburban portfolios (~2,700 facilities, 170M sqft) operate at ~95% occupancy in 2024, delivering high-margin, low-capex NOI that funds growth and debt reduction. Autopay (~55%) and ancillary fees boost collections and margins; same-store revenue +6% in 2024. Harvest with light-touch upkeep and modest ARPU-driving upgrades.
| Metric | 2024 |
|---|---|
| Facilities | ~2,700 |
| Rentable sqft | ~170M |
| Occupancy | ~95% |
| SS Rev Growth | ~6% |
| Autopay | ~55% |
What You’re Viewing Is Included
Public Storage BCG Matrix
The Public Storage BCG Matrix you're previewing is the exact file you'll get after purchase. No demo overlays, no watermarks—just a clean, fully formatted strategic report. It's built for immediate use: edit, print, or present without extra work. Crafted by analysts for clarity, it arrives ready to plug into your planning. Buy once, download instantly—no surprises.











