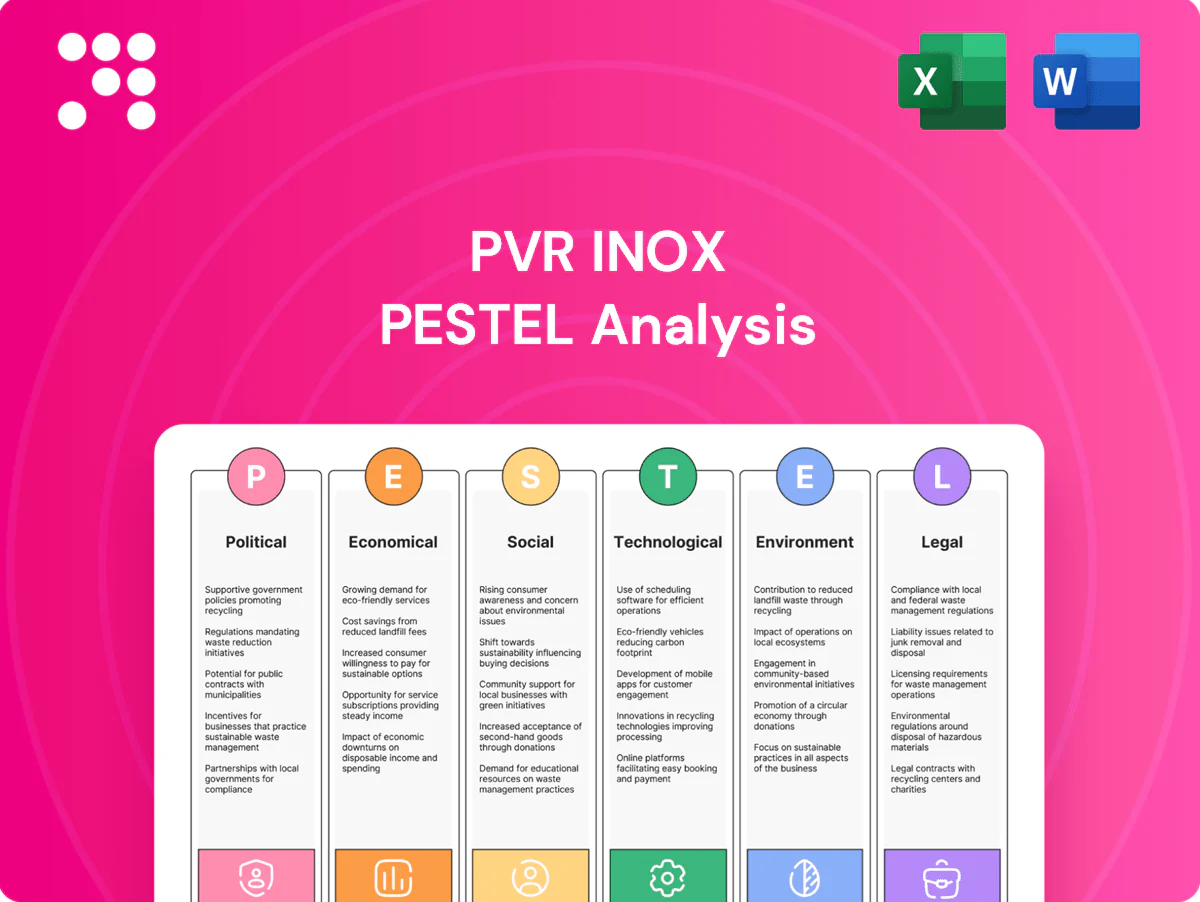
PVR INOX PESTLE Analysis

Skip the Research. Get the Strategy.
Unlock strategic clarity with our concise PESTLE Analysis of PVR INOX—highlighting political, economic, social, technological, legal, and environmental forces shaping its outlook. Use these insights to anticipate risks, pinpoint growth opportunities, and sharpen your investment or strategic plan. Purchase the full, fully editable report for a complete, actionable breakdown you can apply instantly.
Political factors

State policies on entertainment tax and incentives
State-by-state variation in local levies, municipal charges and incentives materially alters PVR INOX site selection, pricing power and margins; negotiating concessions is key to lowering capex and breakeven in Tier-2/3 markets. GST is uniform at 12% for tickets under ₹100 and 18% above ₹100, while state-level waivers/holidays for new screens (commonly 1–3 years) can boost early profitability. The PVR‑INOX merger completed April 2023 expanded negotiating leverage with state governments, but the chain remains sensitive to sudden policy reversals during election cycles that can hit collections and cash flow.
Film certification and content regulation
CBFC certification delays and mandated cuts directly shift release dates, compress marketing windows and force reprogramming across PVR INOX circuits, increasing holding costs and reducing weekend occupancy; high-profile cases like The Kashmir Files (reported ~₹340 crore India gross) show how political content can drive or deter audiences. Bans, regional sensitivities and required edits raise risk of cancellation or reduced screen counts, so PVR INOX builds contingency plans for multi-language dubs/subtitles and staggered regional rollouts to protect revenues. Political sentiment notably boosts or suppresses genres tied to nationalism, religion or regional issues, affecting box-office volatility and forecasting accuracy.

Government support for cultural infrastructure
Central schemes such as Smart Cities Mission (100 cities selected) alongside tourism programs like Swadesh Darshan and PRASAD create federal incentives for cultural infrastructure and urban renewal that multiplex chains can leverage via PPPs. Municipal cultural hubs and civic complexes often offer concessional leasing frameworks to encourage private operators, boosting site access and footfall during festivals. However, state-level permit backlogs and layered approvals routinely delay mall/cinema fit-outs and openings.

Public safety directives and crowd-control rules
PVR INOX, formed by the 2023 merger of PVR and INOX, faces government mandates—occupancy caps, extended screening/entry checks, and festival crowd rules—that alter show timings and seat sell-through, while sudden directives (health alerts, security orders, elections invoking Section 144) force cancellations and revenue loss. Compliance requires pre-approved SOPs and direct liaison with local authorities to maintain resilient operations during sensitive periods.
- Section 144 enforcement affects assemblies
- SOPs for screening reduce delay-related cancellations
- Direct authority communication preserves licensing
FDI norms, local sourcing, and import approvals
- FDI impact: affects scale and capex pace
- Approval: 4–12 weeks
- Trade-off: premium import vs local cost
- Policy risk: margin/capex volatility
State levies, GST 12/18%, 4–12wk CBFC delays, merger ~1,600 screens shift margins
State-level levies, GST 12/18% and election-related policy reversals materially affect site selection, pricing and margins. CBFC delays, bans and regional sensitivities shift releases and occupancy; approval times 4–12 weeks increase holding costs. Merger (Apr 2023) plus ~1,600 screens raises negotiating leverage but heightens compliance exposure (Section 144, crowd rules).
| Item | Metric |
|---|---|
| Screens | ~1,600 |
| GST | 12/18% |
| Approvals | 4–12 weeks |
What is included in the product
 Detailed Word Document
Explores how Political, Economic, Social, Technological, Environmental and Legal forces uniquely impact PVR INOX, with data-backed trends, forward-looking insights and actionable implications to inform strategy, risk management and investor communications.

 Customizable Excel Spreadsheet
A condensed PVR INOX PESTLE summary, visually segmented by PESTEL categories, easily editable and shareable for presentations, planning sessions and client reports—helping teams quickly align on external risks, market positioning and strategic actions.
Economic factors

Disposable income and urban consumption cycles
Ticket and F&B spend track urban middle‑class disposable income: with India GDP growth near 6.8% (IMF 2025) and rising formal employment, metro occupancy and premium format (IMAX/Gold Class) adoption rise, boosting ARPU. Festive cycles lift footfalls ~30–50%, showing high cyclical elasticity. Metros record ~25–40% higher ticket/F&B spend than Tier‑2/3 markets, reflecting income and lifestyle gaps.
Inflation, pricing power, and input costs
Rising food inflation and utility/wage inflation since 2024 have squeezed margins for PVR INOX—India's RBI inflation target is 4% with recent CPI running above target—while rentals remain a fixed cost pressure in top-city sites. The chains use dynamic pricing, bundling and premium screens (IMAX/Gold Class) to lift average ticket and F&B yields and protect margins. Consumer tolerance typically falls when cumulative ticket+F&B rises exceed ~8–10% year-on-year, so long-term supplier contracts and indexed procurement are used to stabilize input volatility.

Content supply volatility and box-office concentration
Reliance on a few tentpole releases drives large quarterly swings in admissions and revenue, with post-merger PVR INOX operating about 1,800 screens across 360 locations (2024) concentrating impact of hits. Diversifying regional slates and genres smooths revenue and reduces single-release dependency. Pipeline risks from 2023–24 production delays and strikes can create content gaps. Model scenario planning for weak-content quarters with stress cases for -20% to -40% box-office revenue.

Capex intensity and interest rate environment
Higher rates (RBI repo ~6.5% in 2024–25) lift corporate borrowing costs to roughly 8–9% for rated issuers, raising financing costs for new screens, refurbishments and tech upgrades and extending project hurdle rates. Premium formats (IMAX/4DX/PLF) typically show paybacks of about 3–5 years versus 6–8 years for standard screens. Mall lease liabilities and rental escalations commonly run 5–7% annually, inflating operating leverage. Capital allocation increasingly balances measured expansion with deleveraging to contain interest burden.
- Repo rate ~6.5% (2024–25)
- Corporate borrowing ~8–9%
- Premium payback 3–5 yrs; standard 6–8 yrs
- Lease escalations 5–7% p.a.
Competition from OTT and leisure substitutes
Competition from OTT and leisure substitutes pressures mid-tier theatrical titles: low-cost OTT plans (Amazon Prime India ₹1,499/yr, Disney+ Hotstar ₹899/yr, Netflix mobile ₹149/mo) and convenience cut into footfall, especially for non-event films. PVR INOX’s experiential formats, events and loyalty (combined ~1,600 screens) and premium pricing (avg ticket ₹250–300) help defend share; major releases still drive co-existence and box-office spikes.
- OTT pricing vs mid-tier substitution
- Experiential formats, events, loyalty defend share
- Average ticket ₹250–300 vs OTT subscription value
- Major releases sustain theatrical co-existence
State levies, GST 12/18%, 4–12wk CBFC delays, merger ~1,600 screens shift margins
Urban income growth (IMF GDP 6.8% 2025) and premium-format adoption lift ARPU, while food/utility inflation and fixed rents compress margins. Heavy reliance on tentpole releases (≈1,800 screens, 360 locations 2024) creates volatility; diversification and dynamic pricing mitigate. Higher funding costs (repo ~6.5%, corporate borrowing ~8–9%) raise project hurdle rates and prioritize measured expansion.
| Metric | Value (2024–25) |
|---|---|
| GDP growth (IMF) | 6.8% |
| Repo rate | ~6.5% |
| Corp borrowing | 8–9% |
| Screens / locations | ~1,800 / 360 |
| Avg ticket | ₹250–300 |
| Lease escalations | 5–7% p.a. |
Preview Before You Purchase
PVR INOX PESTLE Analysis
This PVR INOX PESTLE Analysis outlines the political, economic, social, technological, legal and environmental factors affecting the cinema and entertainment business, supporting strategic decisions and investor review. The preview shown here is the exact document you’ll receive after purchase—fully formatted and ready to use. Everything displayed is the final file, ready to download immediately after payment.

Skip the Research. Get the Strategy.
Unlock strategic clarity with our concise PESTLE Analysis of PVR INOX—highlighting political, economic, social, technological, legal, and environmental forces shaping its outlook. Use these insights to anticipate risks, pinpoint growth opportunities, and sharpen your investment or strategic plan. Purchase the full, fully editable report for a complete, actionable breakdown you can apply instantly.
Political factors
State policies on entertainment tax and incentives
State-by-state variation in local levies, municipal charges and incentives materially alters PVR INOX site selection, pricing power and margins; negotiating concessions is key to lowering capex and breakeven in Tier-2/3 markets. GST is uniform at 12% for tickets under ₹100 and 18% above ₹100, while state-level waivers/holidays for new screens (commonly 1–3 years) can boost early profitability. The PVR‑INOX merger completed April 2023 expanded negotiating leverage with state governments, but the chain remains sensitive to sudden policy reversals during election cycles that can hit collections and cash flow.
Film certification and content regulation
CBFC certification delays and mandated cuts directly shift release dates, compress marketing windows and force reprogramming across PVR INOX circuits, increasing holding costs and reducing weekend occupancy; high-profile cases like The Kashmir Files (reported ~₹340 crore India gross) show how political content can drive or deter audiences. Bans, regional sensitivities and required edits raise risk of cancellation or reduced screen counts, so PVR INOX builds contingency plans for multi-language dubs/subtitles and staggered regional rollouts to protect revenues. Political sentiment notably boosts or suppresses genres tied to nationalism, religion or regional issues, affecting box-office volatility and forecasting accuracy.
Government support for cultural infrastructure
Central schemes such as Smart Cities Mission (100 cities selected) alongside tourism programs like Swadesh Darshan and PRASAD create federal incentives for cultural infrastructure and urban renewal that multiplex chains can leverage via PPPs. Municipal cultural hubs and civic complexes often offer concessional leasing frameworks to encourage private operators, boosting site access and footfall during festivals. However, state-level permit backlogs and layered approvals routinely delay mall/cinema fit-outs and openings.
Public safety directives and crowd-control rules
PVR INOX, formed by the 2023 merger of PVR and INOX, faces government mandates—occupancy caps, extended screening/entry checks, and festival crowd rules—that alter show timings and seat sell-through, while sudden directives (health alerts, security orders, elections invoking Section 144) force cancellations and revenue loss. Compliance requires pre-approved SOPs and direct liaison with local authorities to maintain resilient operations during sensitive periods.
- Section 144 enforcement affects assemblies
- SOPs for screening reduce delay-related cancellations
- Direct authority communication preserves licensing
FDI norms, local sourcing, and import approvals
- FDI impact: affects scale and capex pace
- Approval: 4–12 weeks
- Trade-off: premium import vs local cost
- Policy risk: margin/capex volatility
State levies, GST 12/18%, 4–12wk CBFC delays, merger ~1,600 screens shift margins
State-level levies, GST 12/18% and election-related policy reversals materially affect site selection, pricing and margins. CBFC delays, bans and regional sensitivities shift releases and occupancy; approval times 4–12 weeks increase holding costs. Merger (Apr 2023) plus ~1,600 screens raises negotiating leverage but heightens compliance exposure (Section 144, crowd rules).
| Item | Metric |
|---|---|
| Screens | ~1,600 |
| GST | 12/18% |
| Approvals | 4–12 weeks |
What is included in the product
Detailed Word Document
Explores how Political, Economic, Social, Technological, Environmental and Legal forces uniquely impact PVR INOX, with data-backed trends, forward-looking insights and actionable implications to inform strategy, risk management and investor communications.
Customizable Excel Spreadsheet
A condensed PVR INOX PESTLE summary, visually segmented by PESTEL categories, easily editable and shareable for presentations, planning sessions and client reports—helping teams quickly align on external risks, market positioning and strategic actions.
Economic factors
Disposable income and urban consumption cycles
Ticket and F&B spend track urban middle‑class disposable income: with India GDP growth near 6.8% (IMF 2025) and rising formal employment, metro occupancy and premium format (IMAX/Gold Class) adoption rise, boosting ARPU. Festive cycles lift footfalls ~30–50%, showing high cyclical elasticity. Metros record ~25–40% higher ticket/F&B spend than Tier‑2/3 markets, reflecting income and lifestyle gaps.
Inflation, pricing power, and input costs
Rising food inflation and utility/wage inflation since 2024 have squeezed margins for PVR INOX—India's RBI inflation target is 4% with recent CPI running above target—while rentals remain a fixed cost pressure in top-city sites. The chains use dynamic pricing, bundling and premium screens (IMAX/Gold Class) to lift average ticket and F&B yields and protect margins. Consumer tolerance typically falls when cumulative ticket+F&B rises exceed ~8–10% year-on-year, so long-term supplier contracts and indexed procurement are used to stabilize input volatility.
Content supply volatility and box-office concentration
Reliance on a few tentpole releases drives large quarterly swings in admissions and revenue, with post-merger PVR INOX operating about 1,800 screens across 360 locations (2024) concentrating impact of hits. Diversifying regional slates and genres smooths revenue and reduces single-release dependency. Pipeline risks from 2023–24 production delays and strikes can create content gaps. Model scenario planning for weak-content quarters with stress cases for -20% to -40% box-office revenue.
Capex intensity and interest rate environment
Higher rates (RBI repo ~6.5% in 2024–25) lift corporate borrowing costs to roughly 8–9% for rated issuers, raising financing costs for new screens, refurbishments and tech upgrades and extending project hurdle rates. Premium formats (IMAX/4DX/PLF) typically show paybacks of about 3–5 years versus 6–8 years for standard screens. Mall lease liabilities and rental escalations commonly run 5–7% annually, inflating operating leverage. Capital allocation increasingly balances measured expansion with deleveraging to contain interest burden.
- Repo rate ~6.5% (2024–25)
- Corporate borrowing ~8–9%
- Premium payback 3–5 yrs; standard 6–8 yrs
- Lease escalations 5–7% p.a.
Competition from OTT and leisure substitutes
Competition from OTT and leisure substitutes pressures mid-tier theatrical titles: low-cost OTT plans (Amazon Prime India ₹1,499/yr, Disney+ Hotstar ₹899/yr, Netflix mobile ₹149/mo) and convenience cut into footfall, especially for non-event films. PVR INOX’s experiential formats, events and loyalty (combined ~1,600 screens) and premium pricing (avg ticket ₹250–300) help defend share; major releases still drive co-existence and box-office spikes.
- OTT pricing vs mid-tier substitution
- Experiential formats, events, loyalty defend share
- Average ticket ₹250–300 vs OTT subscription value
- Major releases sustain theatrical co-existence
State levies, GST 12/18%, 4–12wk CBFC delays, merger ~1,600 screens shift margins
Urban income growth (IMF GDP 6.8% 2025) and premium-format adoption lift ARPU, while food/utility inflation and fixed rents compress margins. Heavy reliance on tentpole releases (≈1,800 screens, 360 locations 2024) creates volatility; diversification and dynamic pricing mitigate. Higher funding costs (repo ~6.5%, corporate borrowing ~8–9%) raise project hurdle rates and prioritize measured expansion.
| Metric | Value (2024–25) |
|---|---|
| GDP growth (IMF) | 6.8% |
| Repo rate | ~6.5% |
| Corp borrowing | 8–9% |
| Screens / locations | ~1,800 / 360 |
| Avg ticket | ₹250–300 |
| Lease escalations | 5–7% p.a. |
Preview Before You Purchase
PVR INOX PESTLE Analysis
This PVR INOX PESTLE Analysis outlines the political, economic, social, technological, legal and environmental factors affecting the cinema and entertainment business, supporting strategic decisions and investor review. The preview shown here is the exact document you’ll receive after purchase—fully formatted and ready to use. Everything displayed is the final file, ready to download immediately after payment.
Original: $10.00
-65%$10.00
$3.50Description
Skip the Research. Get the Strategy.
Unlock strategic clarity with our concise PESTLE Analysis of PVR INOX—highlighting political, economic, social, technological, legal, and environmental forces shaping its outlook. Use these insights to anticipate risks, pinpoint growth opportunities, and sharpen your investment or strategic plan. Purchase the full, fully editable report for a complete, actionable breakdown you can apply instantly.
Political factors
State policies on entertainment tax and incentives
State-by-state variation in local levies, municipal charges and incentives materially alters PVR INOX site selection, pricing power and margins; negotiating concessions is key to lowering capex and breakeven in Tier-2/3 markets. GST is uniform at 12% for tickets under ₹100 and 18% above ₹100, while state-level waivers/holidays for new screens (commonly 1–3 years) can boost early profitability. The PVR‑INOX merger completed April 2023 expanded negotiating leverage with state governments, but the chain remains sensitive to sudden policy reversals during election cycles that can hit collections and cash flow.
Film certification and content regulation
CBFC certification delays and mandated cuts directly shift release dates, compress marketing windows and force reprogramming across PVR INOX circuits, increasing holding costs and reducing weekend occupancy; high-profile cases like The Kashmir Files (reported ~₹340 crore India gross) show how political content can drive or deter audiences. Bans, regional sensitivities and required edits raise risk of cancellation or reduced screen counts, so PVR INOX builds contingency plans for multi-language dubs/subtitles and staggered regional rollouts to protect revenues. Political sentiment notably boosts or suppresses genres tied to nationalism, religion or regional issues, affecting box-office volatility and forecasting accuracy.
Government support for cultural infrastructure
Central schemes such as Smart Cities Mission (100 cities selected) alongside tourism programs like Swadesh Darshan and PRASAD create federal incentives for cultural infrastructure and urban renewal that multiplex chains can leverage via PPPs. Municipal cultural hubs and civic complexes often offer concessional leasing frameworks to encourage private operators, boosting site access and footfall during festivals. However, state-level permit backlogs and layered approvals routinely delay mall/cinema fit-outs and openings.
Public safety directives and crowd-control rules
PVR INOX, formed by the 2023 merger of PVR and INOX, faces government mandates—occupancy caps, extended screening/entry checks, and festival crowd rules—that alter show timings and seat sell-through, while sudden directives (health alerts, security orders, elections invoking Section 144) force cancellations and revenue loss. Compliance requires pre-approved SOPs and direct liaison with local authorities to maintain resilient operations during sensitive periods.
- Section 144 enforcement affects assemblies
- SOPs for screening reduce delay-related cancellations
- Direct authority communication preserves licensing
FDI norms, local sourcing, and import approvals
- FDI impact: affects scale and capex pace
- Approval: 4–12 weeks
- Trade-off: premium import vs local cost
- Policy risk: margin/capex volatility
State levies, GST 12/18%, 4–12wk CBFC delays, merger ~1,600 screens shift margins
State-level levies, GST 12/18% and election-related policy reversals materially affect site selection, pricing and margins. CBFC delays, bans and regional sensitivities shift releases and occupancy; approval times 4–12 weeks increase holding costs. Merger (Apr 2023) plus ~1,600 screens raises negotiating leverage but heightens compliance exposure (Section 144, crowd rules).
| Item | Metric |
|---|---|
| Screens | ~1,600 |
| GST | 12/18% |
| Approvals | 4–12 weeks |
What is included in the product
Detailed Word Document
Explores how Political, Economic, Social, Technological, Environmental and Legal forces uniquely impact PVR INOX, with data-backed trends, forward-looking insights and actionable implications to inform strategy, risk management and investor communications.
Customizable Excel Spreadsheet
A condensed PVR INOX PESTLE summary, visually segmented by PESTEL categories, easily editable and shareable for presentations, planning sessions and client reports—helping teams quickly align on external risks, market positioning and strategic actions.
Economic factors
Disposable income and urban consumption cycles
Ticket and F&B spend track urban middle‑class disposable income: with India GDP growth near 6.8% (IMF 2025) and rising formal employment, metro occupancy and premium format (IMAX/Gold Class) adoption rise, boosting ARPU. Festive cycles lift footfalls ~30–50%, showing high cyclical elasticity. Metros record ~25–40% higher ticket/F&B spend than Tier‑2/3 markets, reflecting income and lifestyle gaps.
Inflation, pricing power, and input costs
Rising food inflation and utility/wage inflation since 2024 have squeezed margins for PVR INOX—India's RBI inflation target is 4% with recent CPI running above target—while rentals remain a fixed cost pressure in top-city sites. The chains use dynamic pricing, bundling and premium screens (IMAX/Gold Class) to lift average ticket and F&B yields and protect margins. Consumer tolerance typically falls when cumulative ticket+F&B rises exceed ~8–10% year-on-year, so long-term supplier contracts and indexed procurement are used to stabilize input volatility.
Content supply volatility and box-office concentration
Reliance on a few tentpole releases drives large quarterly swings in admissions and revenue, with post-merger PVR INOX operating about 1,800 screens across 360 locations (2024) concentrating impact of hits. Diversifying regional slates and genres smooths revenue and reduces single-release dependency. Pipeline risks from 2023–24 production delays and strikes can create content gaps. Model scenario planning for weak-content quarters with stress cases for -20% to -40% box-office revenue.
Capex intensity and interest rate environment
Higher rates (RBI repo ~6.5% in 2024–25) lift corporate borrowing costs to roughly 8–9% for rated issuers, raising financing costs for new screens, refurbishments and tech upgrades and extending project hurdle rates. Premium formats (IMAX/4DX/PLF) typically show paybacks of about 3–5 years versus 6–8 years for standard screens. Mall lease liabilities and rental escalations commonly run 5–7% annually, inflating operating leverage. Capital allocation increasingly balances measured expansion with deleveraging to contain interest burden.
- Repo rate ~6.5% (2024–25)
- Corporate borrowing ~8–9%
- Premium payback 3–5 yrs; standard 6–8 yrs
- Lease escalations 5–7% p.a.
Competition from OTT and leisure substitutes
Competition from OTT and leisure substitutes pressures mid-tier theatrical titles: low-cost OTT plans (Amazon Prime India ₹1,499/yr, Disney+ Hotstar ₹899/yr, Netflix mobile ₹149/mo) and convenience cut into footfall, especially for non-event films. PVR INOX’s experiential formats, events and loyalty (combined ~1,600 screens) and premium pricing (avg ticket ₹250–300) help defend share; major releases still drive co-existence and box-office spikes.
- OTT pricing vs mid-tier substitution
- Experiential formats, events, loyalty defend share
- Average ticket ₹250–300 vs OTT subscription value
- Major releases sustain theatrical co-existence
State levies, GST 12/18%, 4–12wk CBFC delays, merger ~1,600 screens shift margins
Urban income growth (IMF GDP 6.8% 2025) and premium-format adoption lift ARPU, while food/utility inflation and fixed rents compress margins. Heavy reliance on tentpole releases (≈1,800 screens, 360 locations 2024) creates volatility; diversification and dynamic pricing mitigate. Higher funding costs (repo ~6.5%, corporate borrowing ~8–9%) raise project hurdle rates and prioritize measured expansion.
| Metric | Value (2024–25) |
|---|---|
| GDP growth (IMF) | 6.8% |
| Repo rate | ~6.5% |
| Corp borrowing | 8–9% |
| Screens / locations | ~1,800 / 360 |
| Avg ticket | ₹250–300 |
| Lease escalations | 5–7% p.a. |
Preview Before You Purchase
PVR INOX PESTLE Analysis
This PVR INOX PESTLE Analysis outlines the political, economic, social, technological, legal and environmental factors affecting the cinema and entertainment business, supporting strategic decisions and investor review. The preview shown here is the exact document you’ll receive after purchase—fully formatted and ready to use. Everything displayed is the final file, ready to download immediately after payment.











