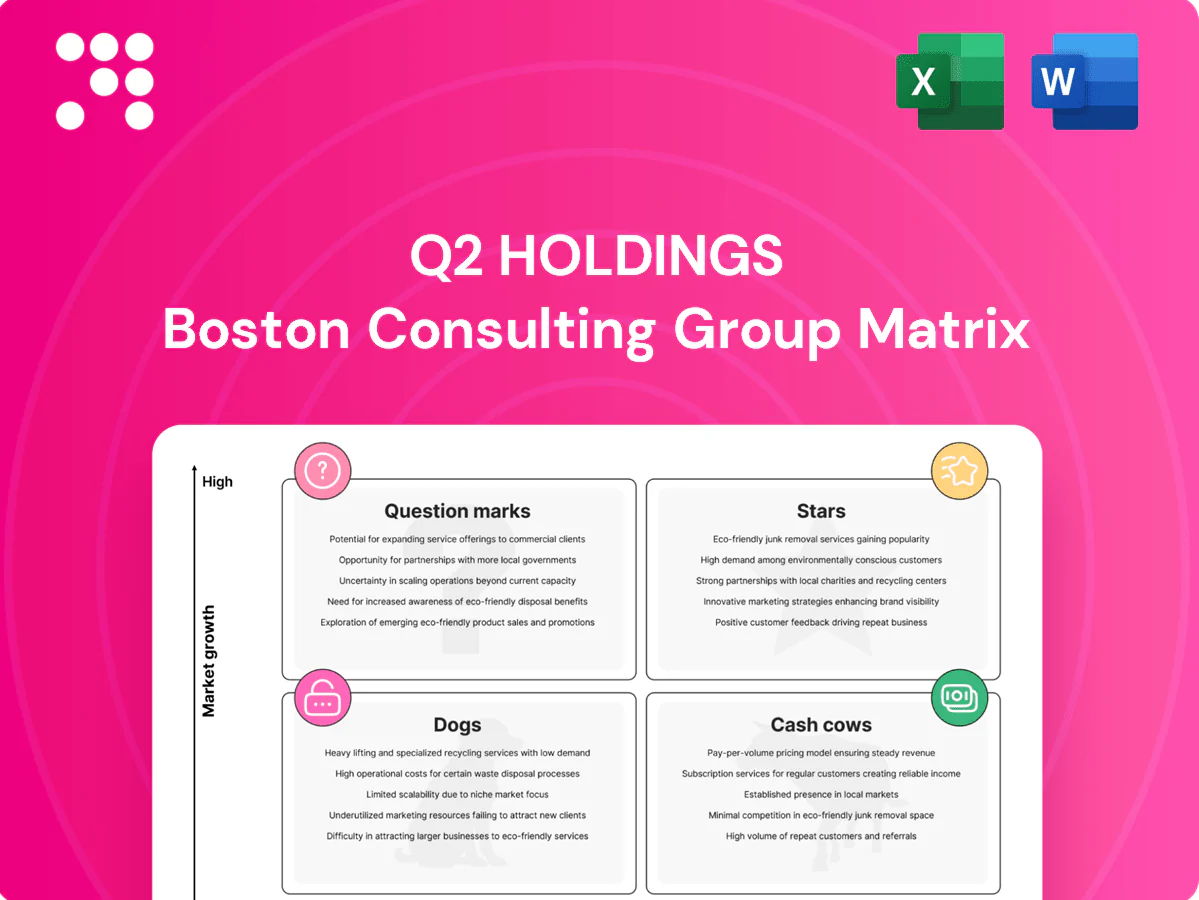
Q2 Holdings Boston Consulting Group Matrix

Unlock Strategic Clarity
Quick snapshot: Q2 Holdings sits at an inflection point — some offerings look like Stars, others risk slipping into Dogs unless you act. Buy the full BCG Matrix to see each product’s quadrant, get data-backed recommendations, and a ready-to-use Word report + high-level Excel summary. Skip the guesswork and make sharper investment and product decisions today.
Stars

Core Digital Banking Platform
Flagship cloud platform powering retail and business banking across web and mobile. High adoption, sticky contracts, and land‑and‑expand dynamics keep share strong in a growing digital market with ~10% CAGR; Q2 serves ~1,500 financial institutions and reported 2024 revenue of $524m. Requires steady investment in UX, performance, and integrations to defend leadership. Hold share and it compounds into long‑run cash generation.
Mobile Banking Experience
Mobile drives daily engagement and is where users live — growth remains brisk, with mobile representing roughly 70% of digital sessions industry‑wide in 2024 and Q2 serving over 1,100 financial institutions. Q2’s app layer, push notifications, and rapid feature velocity keep it front‑of‑wallet for clients. Sustaining this requires ongoing investment in UX design, performance, and device coverage to stay ahead. Nail it, and it matures into a durable cash engine.

Commercial & Treasury (Q2 Catalyst)
Mid-market and community banks — roughly 4,700 U.S. institutions — are racing to upgrade treasury and cash-management, driving demand for Q2’s commercial workflows, entitlements, and payments rails that address real pain points. Sales cycles are heavier, requiring more marketing and solution consulting investment. With accelerating share momentum in 2024, this star can become a premium cash cow as the segment matures.

Account Opening & Origination
Digital onboarding is expanding as branches shrink and deposits become contested; Q2’s KYC, decisioning, and smooth UX raise conversion and cut abandonment, driving account-opening momentum for the platform. As of 2024 Q2, Q2 reported its client base exceeding 1,200 financial institutions, underpinning recurring fee growth. Ongoing investment in fraud tools, data partners, and iterative testing is required to sustain lift and margins.
- Stars
- Digital onboarding growth
- KYC + decisioning = higher conversion
- Requires ongoing fraud/data spend
- 2024: >1,200 clients
Fraud, Risk & Security Suite
Fraud keeps evolving and banks are increasing budgets for prevention; industry reports showed card-not-present fraud surged over 30% year-over-year into 2024, driving demand for robust defenses. Q2’s authentication, anomaly detection, and controls make its suite a go-to for banks seeking consolidated protection. Constant model tuning and vendor orchestration require capital, but customer retention and upsell keep margins strong. Stay ahead of attackers and this remains a high-growth leader.
- 2024 trend: CNP fraud >30% YoY
- Q2 positioning: authentication + anomaly detection + controls
- Requires: continuous model tuning, vendor orchestration, capital
- Outcome: strong retention, upsell, high-growth potential
Cloud and mobile banking stack: $524m, 70% mobile, fraud +30%
Q2’s flagship cloud and mobile stack are Stars: high adoption, >1,500 FI clients, 2024 revenue $524m and digital market CAGR ~10%. Mobile ~70% of sessions; onboarding >1,200 clients; CNP fraud +30% YoY drives demand—requires continuous product and fraud investment to sustain growth.
| Metric | 2024 |
|---|---|
| Revenue | $524m |
| Clients (platform) | >1,500 |
| Onboarding clients | >1,200 |
| Mobile share | ~70% sessions |
| CNP fraud YoY | +30% |
What is included in the product
 Detailed Word Document
Comprehensive BCG Matrix review of Q2 Holdings' products with strategic guidance on invest, hold, or divest per quadrant.

 Customizable Excel Spreadsheet
One-page BCG matrix placing each Q2 business unit in a quadrant for quick portfolio clarity and faster exec decisions.
Cash Cows

Legacy Online Banking Modules
Legacy online banking modules at Q2 serve roughly 1,200 banks and credit unions, driving predictable renewals with retention above 90% in 2024; growth is modest (~5% YoY) but margins are strong after years of optimization (operating margins near 20%). Limited promotional spend focuses instead on reliability and SLAs, with minor UX refreshes prioritized. Product strategy: milk with light R&D while bundling into broader platform deals to protect margins and expand wallet share.
Bill Pay & Money Movement Add‑Ons
Core bill pay and money‑movement add‑ons at Q2 are widely adopted and stable, generating predictable, high-margin cash flows that fund R&D and new product initiatives.
Price pressure exists, but scale and operational efficiency keep unit economics positive; incremental UX improvements and alerts reduce churn without large capex.
Management allocates this steady cash to newer growth bets while maintaining low maintenance spend on the cash cows.

Implementation & Managed Services
Implementation & Managed Services generate steady professional‑services revenue tied to go‑lives and enhancements, contributing roughly 25% of Q2 Holdings’ 2024 services mix and supporting reliable cash flow. Templatized processes drive repeatability and have pushed services gross margins toward the high 30s–40% range in 2024, improving profitability as projects scale. Growth is flat to modest (single‑digit %), but cash conversion remains strong, often exceeding 80% in recent quarters; investing in automation and tooling can shorten timelines and increase throughput.

Support, Maintenance & Hosting
Support, maintenance and cloud hosting are Q2 Holdings cash cows, producing steady subscription revenue with high client retention and strong platform attach rates despite low market growth.
Efficiency gains from tooling and automation have lifted service margins while operations focus remains on maintaining SLAs and avoiding over‑engineering that could erode profitability.
- Recurring revenue stability
- High retention and attach
- Low market growth
- Margin gains via automation
- Prioritize service quality
Reporting & Analytics Packaged Add‑Ons
Reporting & Analytics packaged add‑ons deliver sticky, high‑margin revenue—enterprise renewal rates around 85–90% and software gross margins (~70%) make them efficient cash cows; out‑of‑the‑box dashboards upsell easily across Q2’s base while the analytics market shows mid‑single‑digit to low‑double‑digit CAGR, indicating maturity with incremental feature demand. Low marketing spend is required and renewal visibility is strong; maintain current investments and allocate excess cash to fund next‑wave innovation.
- Stickiness: high renewal rates ~85–90%
- Margins: software gross margins ~70%
- Market: mature, mid‑single to low‑double‑digit CAGR
- Strategy: keep current, avoid overspend, fund future R&D
Steady, high‑margin banking: >90% retention, ~20% op margin
Legacy banking modules, bill‑pay, services and analytics generate stable, high‑margin cash flows: 2024 retention >90%, operating margins ~20%, software gross margins ~70%, services mix ~25% with services gross margins ~38–40% and cash conversion >80%. Growth low (mid‑single %), margin gains from automation. Excess cash funds R&D and platform expansion.
| Metric | 2024 Value |
|---|---|
| Client retention | >90% |
| Op margin | ~20% |
| Software GM | ~70% |
| Services mix | ~25% |
| Services GM | 38–40% |
| Cash conversion | >80% |
Preview = Final Product
Q2 Holdings BCG Matrix
The file you're previewing is the exact Q2 Holdings BCG Matrix you'll receive after purchase — no watermarks, no demo text, just the finished report. It’s fully formatted and ready to use for strategic planning or presentations. Crafted by strategy pros, the document is editable and print-ready. Buy once, download instantly — no surprises, no extra steps.

Unlock Strategic Clarity
Quick snapshot: Q2 Holdings sits at an inflection point — some offerings look like Stars, others risk slipping into Dogs unless you act. Buy the full BCG Matrix to see each product’s quadrant, get data-backed recommendations, and a ready-to-use Word report + high-level Excel summary. Skip the guesswork and make sharper investment and product decisions today.
Stars
Core Digital Banking Platform
Flagship cloud platform powering retail and business banking across web and mobile. High adoption, sticky contracts, and land‑and‑expand dynamics keep share strong in a growing digital market with ~10% CAGR; Q2 serves ~1,500 financial institutions and reported 2024 revenue of $524m. Requires steady investment in UX, performance, and integrations to defend leadership. Hold share and it compounds into long‑run cash generation.
Mobile Banking Experience
Mobile drives daily engagement and is where users live — growth remains brisk, with mobile representing roughly 70% of digital sessions industry‑wide in 2024 and Q2 serving over 1,100 financial institutions. Q2’s app layer, push notifications, and rapid feature velocity keep it front‑of‑wallet for clients. Sustaining this requires ongoing investment in UX design, performance, and device coverage to stay ahead. Nail it, and it matures into a durable cash engine.
Commercial & Treasury (Q2 Catalyst)
Mid-market and community banks — roughly 4,700 U.S. institutions — are racing to upgrade treasury and cash-management, driving demand for Q2’s commercial workflows, entitlements, and payments rails that address real pain points. Sales cycles are heavier, requiring more marketing and solution consulting investment. With accelerating share momentum in 2024, this star can become a premium cash cow as the segment matures.
Account Opening & Origination
Digital onboarding is expanding as branches shrink and deposits become contested; Q2’s KYC, decisioning, and smooth UX raise conversion and cut abandonment, driving account-opening momentum for the platform. As of 2024 Q2, Q2 reported its client base exceeding 1,200 financial institutions, underpinning recurring fee growth. Ongoing investment in fraud tools, data partners, and iterative testing is required to sustain lift and margins.
- Stars
- Digital onboarding growth
- KYC + decisioning = higher conversion
- Requires ongoing fraud/data spend
- 2024: >1,200 clients
Fraud, Risk & Security Suite
Fraud keeps evolving and banks are increasing budgets for prevention; industry reports showed card-not-present fraud surged over 30% year-over-year into 2024, driving demand for robust defenses. Q2’s authentication, anomaly detection, and controls make its suite a go-to for banks seeking consolidated protection. Constant model tuning and vendor orchestration require capital, but customer retention and upsell keep margins strong. Stay ahead of attackers and this remains a high-growth leader.
- 2024 trend: CNP fraud >30% YoY
- Q2 positioning: authentication + anomaly detection + controls
- Requires: continuous model tuning, vendor orchestration, capital
- Outcome: strong retention, upsell, high-growth potential
Cloud and mobile banking stack: $524m, 70% mobile, fraud +30%
Q2’s flagship cloud and mobile stack are Stars: high adoption, >1,500 FI clients, 2024 revenue $524m and digital market CAGR ~10%. Mobile ~70% of sessions; onboarding >1,200 clients; CNP fraud +30% YoY drives demand—requires continuous product and fraud investment to sustain growth.
| Metric | 2024 |
|---|---|
| Revenue | $524m |
| Clients (platform) | >1,500 |
| Onboarding clients | >1,200 |
| Mobile share | ~70% sessions |
| CNP fraud YoY | +30% |
What is included in the product
Detailed Word Document
Comprehensive BCG Matrix review of Q2 Holdings' products with strategic guidance on invest, hold, or divest per quadrant.
Customizable Excel Spreadsheet
One-page BCG matrix placing each Q2 business unit in a quadrant for quick portfolio clarity and faster exec decisions.
Cash Cows
Legacy Online Banking Modules
Legacy online banking modules at Q2 serve roughly 1,200 banks and credit unions, driving predictable renewals with retention above 90% in 2024; growth is modest (~5% YoY) but margins are strong after years of optimization (operating margins near 20%). Limited promotional spend focuses instead on reliability and SLAs, with minor UX refreshes prioritized. Product strategy: milk with light R&D while bundling into broader platform deals to protect margins and expand wallet share.
Bill Pay & Money Movement Add‑Ons
Core bill pay and money‑movement add‑ons at Q2 are widely adopted and stable, generating predictable, high-margin cash flows that fund R&D and new product initiatives.
Price pressure exists, but scale and operational efficiency keep unit economics positive; incremental UX improvements and alerts reduce churn without large capex.
Management allocates this steady cash to newer growth bets while maintaining low maintenance spend on the cash cows.
Implementation & Managed Services
Implementation & Managed Services generate steady professional‑services revenue tied to go‑lives and enhancements, contributing roughly 25% of Q2 Holdings’ 2024 services mix and supporting reliable cash flow. Templatized processes drive repeatability and have pushed services gross margins toward the high 30s–40% range in 2024, improving profitability as projects scale. Growth is flat to modest (single‑digit %), but cash conversion remains strong, often exceeding 80% in recent quarters; investing in automation and tooling can shorten timelines and increase throughput.
Support, Maintenance & Hosting
Support, maintenance and cloud hosting are Q2 Holdings cash cows, producing steady subscription revenue with high client retention and strong platform attach rates despite low market growth.
Efficiency gains from tooling and automation have lifted service margins while operations focus remains on maintaining SLAs and avoiding over‑engineering that could erode profitability.
- Recurring revenue stability
- High retention and attach
- Low market growth
- Margin gains via automation
- Prioritize service quality
Reporting & Analytics Packaged Add‑Ons
Reporting & Analytics packaged add‑ons deliver sticky, high‑margin revenue—enterprise renewal rates around 85–90% and software gross margins (~70%) make them efficient cash cows; out‑of‑the‑box dashboards upsell easily across Q2’s base while the analytics market shows mid‑single‑digit to low‑double‑digit CAGR, indicating maturity with incremental feature demand. Low marketing spend is required and renewal visibility is strong; maintain current investments and allocate excess cash to fund next‑wave innovation.
- Stickiness: high renewal rates ~85–90%
- Margins: software gross margins ~70%
- Market: mature, mid‑single to low‑double‑digit CAGR
- Strategy: keep current, avoid overspend, fund future R&D
Steady, high‑margin banking: >90% retention, ~20% op margin
Legacy banking modules, bill‑pay, services and analytics generate stable, high‑margin cash flows: 2024 retention >90%, operating margins ~20%, software gross margins ~70%, services mix ~25% with services gross margins ~38–40% and cash conversion >80%. Growth low (mid‑single %), margin gains from automation. Excess cash funds R&D and platform expansion.
| Metric | 2024 Value |
|---|---|
| Client retention | >90% |
| Op margin | ~20% |
| Software GM | ~70% |
| Services mix | ~25% |
| Services GM | 38–40% |
| Cash conversion | >80% |
Preview = Final Product
Q2 Holdings BCG Matrix
The file you're previewing is the exact Q2 Holdings BCG Matrix you'll receive after purchase — no watermarks, no demo text, just the finished report. It’s fully formatted and ready to use for strategic planning or presentations. Crafted by strategy pros, the document is editable and print-ready. Buy once, download instantly — no surprises, no extra steps.
Original: $10.00
-65%$10.00
$3.50Description
Unlock Strategic Clarity
Quick snapshot: Q2 Holdings sits at an inflection point — some offerings look like Stars, others risk slipping into Dogs unless you act. Buy the full BCG Matrix to see each product’s quadrant, get data-backed recommendations, and a ready-to-use Word report + high-level Excel summary. Skip the guesswork and make sharper investment and product decisions today.
Stars
Core Digital Banking Platform
Flagship cloud platform powering retail and business banking across web and mobile. High adoption, sticky contracts, and land‑and‑expand dynamics keep share strong in a growing digital market with ~10% CAGR; Q2 serves ~1,500 financial institutions and reported 2024 revenue of $524m. Requires steady investment in UX, performance, and integrations to defend leadership. Hold share and it compounds into long‑run cash generation.
Mobile Banking Experience
Mobile drives daily engagement and is where users live — growth remains brisk, with mobile representing roughly 70% of digital sessions industry‑wide in 2024 and Q2 serving over 1,100 financial institutions. Q2’s app layer, push notifications, and rapid feature velocity keep it front‑of‑wallet for clients. Sustaining this requires ongoing investment in UX design, performance, and device coverage to stay ahead. Nail it, and it matures into a durable cash engine.
Commercial & Treasury (Q2 Catalyst)
Mid-market and community banks — roughly 4,700 U.S. institutions — are racing to upgrade treasury and cash-management, driving demand for Q2’s commercial workflows, entitlements, and payments rails that address real pain points. Sales cycles are heavier, requiring more marketing and solution consulting investment. With accelerating share momentum in 2024, this star can become a premium cash cow as the segment matures.
Account Opening & Origination
Digital onboarding is expanding as branches shrink and deposits become contested; Q2’s KYC, decisioning, and smooth UX raise conversion and cut abandonment, driving account-opening momentum for the platform. As of 2024 Q2, Q2 reported its client base exceeding 1,200 financial institutions, underpinning recurring fee growth. Ongoing investment in fraud tools, data partners, and iterative testing is required to sustain lift and margins.
- Stars
- Digital onboarding growth
- KYC + decisioning = higher conversion
- Requires ongoing fraud/data spend
- 2024: >1,200 clients
Fraud, Risk & Security Suite
Fraud keeps evolving and banks are increasing budgets for prevention; industry reports showed card-not-present fraud surged over 30% year-over-year into 2024, driving demand for robust defenses. Q2’s authentication, anomaly detection, and controls make its suite a go-to for banks seeking consolidated protection. Constant model tuning and vendor orchestration require capital, but customer retention and upsell keep margins strong. Stay ahead of attackers and this remains a high-growth leader.
- 2024 trend: CNP fraud >30% YoY
- Q2 positioning: authentication + anomaly detection + controls
- Requires: continuous model tuning, vendor orchestration, capital
- Outcome: strong retention, upsell, high-growth potential
Cloud and mobile banking stack: $524m, 70% mobile, fraud +30%
Q2’s flagship cloud and mobile stack are Stars: high adoption, >1,500 FI clients, 2024 revenue $524m and digital market CAGR ~10%. Mobile ~70% of sessions; onboarding >1,200 clients; CNP fraud +30% YoY drives demand—requires continuous product and fraud investment to sustain growth.
| Metric | 2024 |
|---|---|
| Revenue | $524m |
| Clients (platform) | >1,500 |
| Onboarding clients | >1,200 |
| Mobile share | ~70% sessions |
| CNP fraud YoY | +30% |
What is included in the product
Detailed Word Document
Comprehensive BCG Matrix review of Q2 Holdings' products with strategic guidance on invest, hold, or divest per quadrant.
Customizable Excel Spreadsheet
One-page BCG matrix placing each Q2 business unit in a quadrant for quick portfolio clarity and faster exec decisions.
Cash Cows
Legacy Online Banking Modules
Legacy online banking modules at Q2 serve roughly 1,200 banks and credit unions, driving predictable renewals with retention above 90% in 2024; growth is modest (~5% YoY) but margins are strong after years of optimization (operating margins near 20%). Limited promotional spend focuses instead on reliability and SLAs, with minor UX refreshes prioritized. Product strategy: milk with light R&D while bundling into broader platform deals to protect margins and expand wallet share.
Bill Pay & Money Movement Add‑Ons
Core bill pay and money‑movement add‑ons at Q2 are widely adopted and stable, generating predictable, high-margin cash flows that fund R&D and new product initiatives.
Price pressure exists, but scale and operational efficiency keep unit economics positive; incremental UX improvements and alerts reduce churn without large capex.
Management allocates this steady cash to newer growth bets while maintaining low maintenance spend on the cash cows.
Implementation & Managed Services
Implementation & Managed Services generate steady professional‑services revenue tied to go‑lives and enhancements, contributing roughly 25% of Q2 Holdings’ 2024 services mix and supporting reliable cash flow. Templatized processes drive repeatability and have pushed services gross margins toward the high 30s–40% range in 2024, improving profitability as projects scale. Growth is flat to modest (single‑digit %), but cash conversion remains strong, often exceeding 80% in recent quarters; investing in automation and tooling can shorten timelines and increase throughput.
Support, Maintenance & Hosting
Support, maintenance and cloud hosting are Q2 Holdings cash cows, producing steady subscription revenue with high client retention and strong platform attach rates despite low market growth.
Efficiency gains from tooling and automation have lifted service margins while operations focus remains on maintaining SLAs and avoiding over‑engineering that could erode profitability.
- Recurring revenue stability
- High retention and attach
- Low market growth
- Margin gains via automation
- Prioritize service quality
Reporting & Analytics Packaged Add‑Ons
Reporting & Analytics packaged add‑ons deliver sticky, high‑margin revenue—enterprise renewal rates around 85–90% and software gross margins (~70%) make them efficient cash cows; out‑of‑the‑box dashboards upsell easily across Q2’s base while the analytics market shows mid‑single‑digit to low‑double‑digit CAGR, indicating maturity with incremental feature demand. Low marketing spend is required and renewal visibility is strong; maintain current investments and allocate excess cash to fund next‑wave innovation.
- Stickiness: high renewal rates ~85–90%
- Margins: software gross margins ~70%
- Market: mature, mid‑single to low‑double‑digit CAGR
- Strategy: keep current, avoid overspend, fund future R&D
Steady, high‑margin banking: >90% retention, ~20% op margin
Legacy banking modules, bill‑pay, services and analytics generate stable, high‑margin cash flows: 2024 retention >90%, operating margins ~20%, software gross margins ~70%, services mix ~25% with services gross margins ~38–40% and cash conversion >80%. Growth low (mid‑single %), margin gains from automation. Excess cash funds R&D and platform expansion.
| Metric | 2024 Value |
|---|---|
| Client retention | >90% |
| Op margin | ~20% |
| Software GM | ~70% |
| Services mix | ~25% |
| Services GM | 38–40% |
| Cash conversion | >80% |
Preview = Final Product
Q2 Holdings BCG Matrix
The file you're previewing is the exact Q2 Holdings BCG Matrix you'll receive after purchase — no watermarks, no demo text, just the finished report. It’s fully formatted and ready to use for strategic planning or presentations. Crafted by strategy pros, the document is editable and print-ready. Buy once, download instantly — no surprises, no extra steps.











