Q2 Holdings Porter's Five Forces Analysis

Don't Miss the Bigger Picture
Q2 Holdings faces intense competitive rivalry from large incumbent fintech and bank-facing SaaS providers, while buyer power grows as banks seek flexible, cost-effective digital platforms; supplier power and substitutes remain moderate but rising with low-code entrants. This brief snapshot only scratches the surface—unlock the full Porter's Five Forces Analysis for force-by-force ratings, visuals, and actionable strategy insights.
Suppliers Bargaining Power

Hyperscale cloud dependence
Q2 relies on major cloud providers for hosting, scalability and resilience, concentrating power with a few vendors; hyperscalers (AWS ~32%, Azure ~24%, GCP ~11% market share in 2024) can influence pricing. Pricing changes or reserved-capacity dynamics can compress margins, and egress fees (~$0.09/GB) plus re‑architecture costs raise stickiness despite multi-cloud and long‑term contracts. Upstream service incidents can cascade into Q2 SLA breaches, amplifying operational and reputational risk.
Regulatory data and KYC vendors
Credit bureaus (Equifax, Experian, TransUnion) and specialist identity-verification and sanctions-screening providers are highly concentrated—each bureau holds records on over 200 million US consumers—giving suppliers outsized leverage. Price increases or data access constraints can sharply impair onboarding and fraud workflows, and integrations plus certification commonly take 3–6 months, creating switching friction. Diversifying vendors and building orchestration layers mitigates risk but compliance mandates keep demand effectively inelastic.

Core banking and API partners
Integration with core systems (FIS, Fiserv, Jack Henry) is technically complex and critical; these three vendors underpin roughly 75% of US banking deposits in 2024, giving them outsized leverage. Core providers can prioritize their own front-ends and influence partner roadmaps and SLAs. Certified connectors reduce integration risk but often require revenue sharing and expose vendors to connector queue delays. Limited alternative cores amplifies partner bargaining power.

Cybersecurity and payments rails
Advanced threat intel, device fingerprinting and payments gateways are critical-path inputs for Q2, with top-tier vendors commanding 10–25% pricing premiums due to proven loss-mitigation results. Substituting components risks performance or compliance regressions and can raise fraud exposure; global card fraud was about 38 billion in 2024. Contracts commonly include volume tiers that can ratchet costs as usage grows.
- vendor_premium: 10–25%
- global_fraud_2024: ~38B
- substitution_risk: performance/compliance
- contract_structure: volume tiers can ratchet costs
Specialized engineering talent
Seasoned cloud, security, and fintech engineers remain scarce, pushing median cloud-engineer pay to about $140,000 in the US in 2024 and elevating wage pressure; talent markets therefore directly raise cost-to-serve and constrain delivery velocity. Retention packages and nearshore models lower churn but do not remove bargaining asymmetry, while knowledge concentration in key platform components raises replacement risk and remediation costs.
- Scarcity: median pay ~ $140k (2024)
- Turnover: ~22% tech churn (2024)
- Mitigants: retention + nearshore reduce but not remove risk
- Concentration: single-point knowledge increases replacement cost
Cloud oligopoly (AWS 32%, Azure 24%) pressures pricing
Q2 faces concentrated cloud supplier power (AWS ~32%, Azure ~24%, GCP ~11% in 2024) that can pressure pricing and egress fees.
Credit bureaus (each >200M US records) and core banking vendors (≈75% US deposits via FIS/Fiserv/Jack Henry) exert strong leverage on data, integration and contractual terms.
Specialist security/payments vendors and scarce cloud engineers (median pay ~$140k; tech churn ~22%) ratchet costs and raise switching friction.
| tag | value |
|---|---|
| cloud_share_2024 | AWS32/Azure24/GCP11% |
| credit_records | >200M each |
| core_deposits | ~75% |
| engineer_pay | $140k |
What is included in the product
 Detailed Word Document
Tailored Porter’s Five Forces for Q2 Holdings that uncovers competitive intensity, buyer/supplier power, entry barriers, substitutes and regulatory threats, identifying strategic levers to protect market share and pricing.

 Customizable Excel Spreadsheet
One-sheet Porter's Five Forces for Q2 Holdings that instantly highlights competitive pain points with a clean radar chart and customizable pressure scores—perfect for slides or rapid strategic decisions.
Customers Bargaining Power

Consolidated procurement
Banks and credit unions procure via formal RFPs with stringent security and compliance asks (SOC 2, FFIEC guidance active in 2024), which professional procurement teams use to improve price discovery and concessions. Multi-year deals remain buyer-favorable through SLA-linked opt-outs. Strong referenceability and documented ROI metrics reduce buyer leverage.
High switching costs
Deep integrations, data migration, and retraining make platform swaps costly and risky for Q2, which as of 2024 serves thousands of financial institutions and trades as QTWO on the NYSE; this dampens buyer power post-implementation. Buyers still leverage switching pain during renegotiations to extract pricing stability and roadmap commitments. Competitive pilots at renewal pose a tangible threat to incumbency.

Budget sensitivity
Financial institutions facing margin and efficiency pressures have sharpened price sensitivity, with buyers increasingly demanding per-user or usage-based models and larger bundling discounts. Demonstrable operational uplift from digital platforms like Q2 can reduce pricing tension by improving cost-to-serve and retention. Economic cycles—global GDP growth near 3.0% in 2024—amplify budget scrutiny and procurement rigor.

Demand for customization
Institutions demand tailored UX, workflows, and third-party plug-ins, which can expand project scope and create delivery dependencies that raise buyer leverage. Strong API and SDK strategies let Q2 convert customization requests into upsell opportunities and recurring revenue rather than one-time concessions. Conversely, weak extensibility amplifies customer bargaining power and churn risk.
- Customization increases scope/dependency
- APIs/SDKs = upsell, not concession
- Poor extensibility = higher buyer leverage
Outcome-driven SLAs
Buyers demand outcome-driven SLAs—commonly 99.99% uptime (≈52.6 minutes downtime/year), strict security guarantees, and rapid time-to-resolution credits—shifting operational and financial risk onto Q2 and forcing continuous improvement in platform reliability. Transparent SLA reporting reduces disputes and churn risk, while missed SLAs substantially increase buyers' renegotiation leverage.
- 99.99% uptime expectation
- SLA credits shift risk
- Transparent reporting lowers disputes
- Missed SLAs = higher buyer leverage
SLAs give buyers leverage; 99.99% uptime risk, 3.0% GDP
Buyers use formal RFPs and procurement teams to extract concessions; multi-year SLA-linked opt-outs keep leverage. Deep integrations and retraining raise switching costs—Q2 serves thousands (QTWO) in 2024—reducing post-implementation power. Price sensitivity and demand for usage-based models rose amid ~3.0% 2024 GDP, increasing negotiation pressure. Strict 99.99% SLA demands shift risk and raise renegotiation leverage when missed.
| Metric | 2024 Value |
|---|---|
| Uptime expectation | 99.99% (~52.6 min/yr) |
| Macro GDP | ≈3.0% |
| Customers served | Thousands (QTWO) |
What You See Is What You Get
Q2 Holdings Porter's Five Forces Analysis
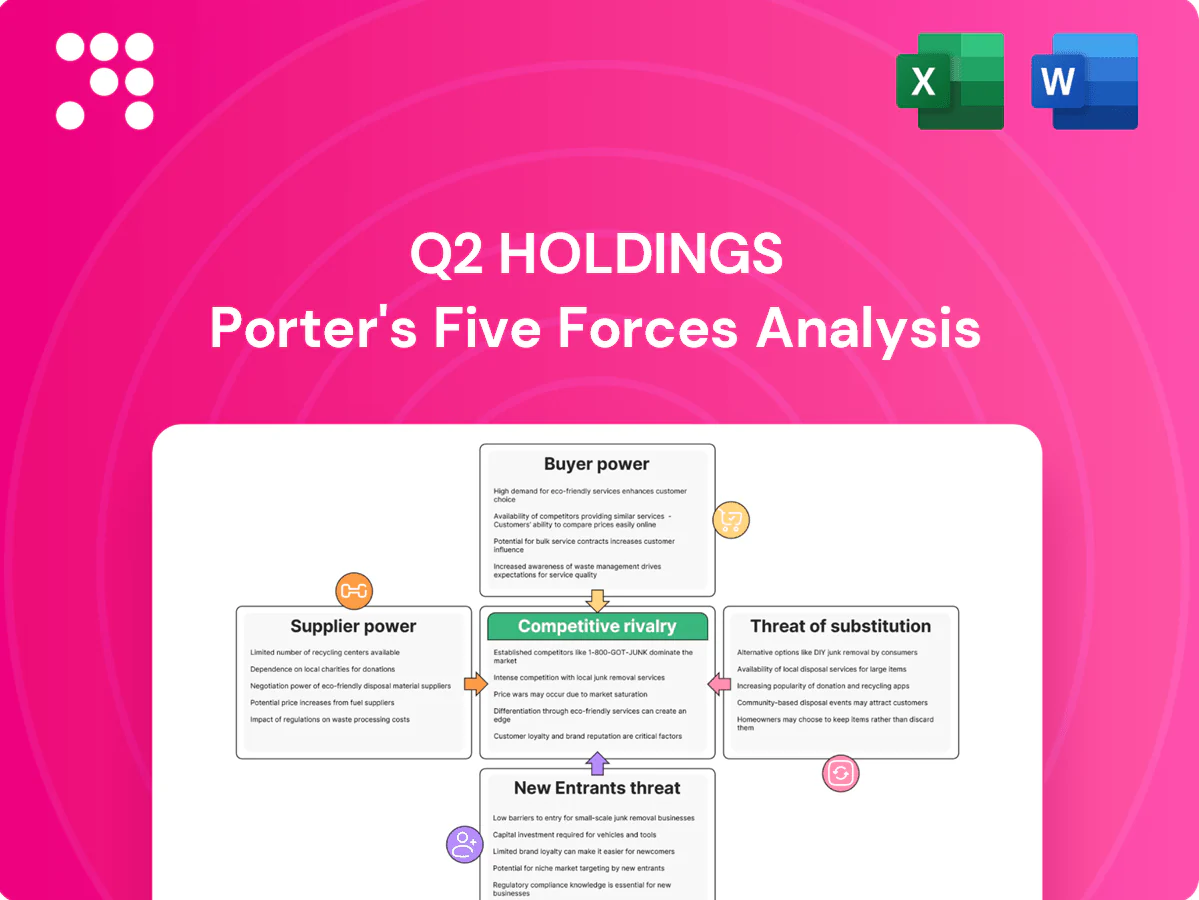
This preview shows the exact Q2 Holdings Porter's Five Forces analysis you'll receive—no placeholders or mockups. The document is fully formatted and ready for download immediately after purchase. It contains the complete competitive assessment, implications and tactical recommendations. What you see is what you get.

Don't Miss the Bigger Picture
Q2 Holdings faces intense competitive rivalry from large incumbent fintech and bank-facing SaaS providers, while buyer power grows as banks seek flexible, cost-effective digital platforms; supplier power and substitutes remain moderate but rising with low-code entrants. This brief snapshot only scratches the surface—unlock the full Porter's Five Forces Analysis for force-by-force ratings, visuals, and actionable strategy insights.
Suppliers Bargaining Power
Hyperscale cloud dependence
Q2 relies on major cloud providers for hosting, scalability and resilience, concentrating power with a few vendors; hyperscalers (AWS ~32%, Azure ~24%, GCP ~11% market share in 2024) can influence pricing. Pricing changes or reserved-capacity dynamics can compress margins, and egress fees (~$0.09/GB) plus re‑architecture costs raise stickiness despite multi-cloud and long‑term contracts. Upstream service incidents can cascade into Q2 SLA breaches, amplifying operational and reputational risk.
Regulatory data and KYC vendors
Credit bureaus (Equifax, Experian, TransUnion) and specialist identity-verification and sanctions-screening providers are highly concentrated—each bureau holds records on over 200 million US consumers—giving suppliers outsized leverage. Price increases or data access constraints can sharply impair onboarding and fraud workflows, and integrations plus certification commonly take 3–6 months, creating switching friction. Diversifying vendors and building orchestration layers mitigates risk but compliance mandates keep demand effectively inelastic.
Core banking and API partners
Integration with core systems (FIS, Fiserv, Jack Henry) is technically complex and critical; these three vendors underpin roughly 75% of US banking deposits in 2024, giving them outsized leverage. Core providers can prioritize their own front-ends and influence partner roadmaps and SLAs. Certified connectors reduce integration risk but often require revenue sharing and expose vendors to connector queue delays. Limited alternative cores amplifies partner bargaining power.
Cybersecurity and payments rails
Advanced threat intel, device fingerprinting and payments gateways are critical-path inputs for Q2, with top-tier vendors commanding 10–25% pricing premiums due to proven loss-mitigation results. Substituting components risks performance or compliance regressions and can raise fraud exposure; global card fraud was about 38 billion in 2024. Contracts commonly include volume tiers that can ratchet costs as usage grows.
- vendor_premium: 10–25%
- global_fraud_2024: ~38B
- substitution_risk: performance/compliance
- contract_structure: volume tiers can ratchet costs
Specialized engineering talent
Seasoned cloud, security, and fintech engineers remain scarce, pushing median cloud-engineer pay to about $140,000 in the US in 2024 and elevating wage pressure; talent markets therefore directly raise cost-to-serve and constrain delivery velocity. Retention packages and nearshore models lower churn but do not remove bargaining asymmetry, while knowledge concentration in key platform components raises replacement risk and remediation costs.
- Scarcity: median pay ~ $140k (2024)
- Turnover: ~22% tech churn (2024)
- Mitigants: retention + nearshore reduce but not remove risk
- Concentration: single-point knowledge increases replacement cost
Cloud oligopoly (AWS 32%, Azure 24%) pressures pricing
Q2 faces concentrated cloud supplier power (AWS ~32%, Azure ~24%, GCP ~11% in 2024) that can pressure pricing and egress fees.
Credit bureaus (each >200M US records) and core banking vendors (≈75% US deposits via FIS/Fiserv/Jack Henry) exert strong leverage on data, integration and contractual terms.
Specialist security/payments vendors and scarce cloud engineers (median pay ~$140k; tech churn ~22%) ratchet costs and raise switching friction.
| tag | value |
|---|---|
| cloud_share_2024 | AWS32/Azure24/GCP11% |
| credit_records | >200M each |
| core_deposits | ~75% |
| engineer_pay | $140k |
What is included in the product
Detailed Word Document
Tailored Porter’s Five Forces for Q2 Holdings that uncovers competitive intensity, buyer/supplier power, entry barriers, substitutes and regulatory threats, identifying strategic levers to protect market share and pricing.
Customizable Excel Spreadsheet
One-sheet Porter's Five Forces for Q2 Holdings that instantly highlights competitive pain points with a clean radar chart and customizable pressure scores—perfect for slides or rapid strategic decisions.
Customers Bargaining Power
Consolidated procurement
Banks and credit unions procure via formal RFPs with stringent security and compliance asks (SOC 2, FFIEC guidance active in 2024), which professional procurement teams use to improve price discovery and concessions. Multi-year deals remain buyer-favorable through SLA-linked opt-outs. Strong referenceability and documented ROI metrics reduce buyer leverage.
High switching costs
Deep integrations, data migration, and retraining make platform swaps costly and risky for Q2, which as of 2024 serves thousands of financial institutions and trades as QTWO on the NYSE; this dampens buyer power post-implementation. Buyers still leverage switching pain during renegotiations to extract pricing stability and roadmap commitments. Competitive pilots at renewal pose a tangible threat to incumbency.
Budget sensitivity
Financial institutions facing margin and efficiency pressures have sharpened price sensitivity, with buyers increasingly demanding per-user or usage-based models and larger bundling discounts. Demonstrable operational uplift from digital platforms like Q2 can reduce pricing tension by improving cost-to-serve and retention. Economic cycles—global GDP growth near 3.0% in 2024—amplify budget scrutiny and procurement rigor.
Demand for customization
Institutions demand tailored UX, workflows, and third-party plug-ins, which can expand project scope and create delivery dependencies that raise buyer leverage. Strong API and SDK strategies let Q2 convert customization requests into upsell opportunities and recurring revenue rather than one-time concessions. Conversely, weak extensibility amplifies customer bargaining power and churn risk.
- Customization increases scope/dependency
- APIs/SDKs = upsell, not concession
- Poor extensibility = higher buyer leverage
Outcome-driven SLAs
Buyers demand outcome-driven SLAs—commonly 99.99% uptime (≈52.6 minutes downtime/year), strict security guarantees, and rapid time-to-resolution credits—shifting operational and financial risk onto Q2 and forcing continuous improvement in platform reliability. Transparent SLA reporting reduces disputes and churn risk, while missed SLAs substantially increase buyers' renegotiation leverage.
- 99.99% uptime expectation
- SLA credits shift risk
- Transparent reporting lowers disputes
- Missed SLAs = higher buyer leverage
SLAs give buyers leverage; 99.99% uptime risk, 3.0% GDP
Buyers use formal RFPs and procurement teams to extract concessions; multi-year SLA-linked opt-outs keep leverage. Deep integrations and retraining raise switching costs—Q2 serves thousands (QTWO) in 2024—reducing post-implementation power. Price sensitivity and demand for usage-based models rose amid ~3.0% 2024 GDP, increasing negotiation pressure. Strict 99.99% SLA demands shift risk and raise renegotiation leverage when missed.
| Metric | 2024 Value |
|---|---|
| Uptime expectation | 99.99% (~52.6 min/yr) |
| Macro GDP | ≈3.0% |
| Customers served | Thousands (QTWO) |
What You See Is What You Get
Q2 Holdings Porter's Five Forces Analysis
This preview shows the exact Q2 Holdings Porter's Five Forces analysis you'll receive—no placeholders or mockups. The document is fully formatted and ready for download immediately after purchase. It contains the complete competitive assessment, implications and tactical recommendations. What you see is what you get.
Description
Don't Miss the Bigger Picture
Q2 Holdings faces intense competitive rivalry from large incumbent fintech and bank-facing SaaS providers, while buyer power grows as banks seek flexible, cost-effective digital platforms; supplier power and substitutes remain moderate but rising with low-code entrants. This brief snapshot only scratches the surface—unlock the full Porter's Five Forces Analysis for force-by-force ratings, visuals, and actionable strategy insights.
Suppliers Bargaining Power
Hyperscale cloud dependence
Q2 relies on major cloud providers for hosting, scalability and resilience, concentrating power with a few vendors; hyperscalers (AWS ~32%, Azure ~24%, GCP ~11% market share in 2024) can influence pricing. Pricing changes or reserved-capacity dynamics can compress margins, and egress fees (~$0.09/GB) plus re‑architecture costs raise stickiness despite multi-cloud and long‑term contracts. Upstream service incidents can cascade into Q2 SLA breaches, amplifying operational and reputational risk.
Regulatory data and KYC vendors
Credit bureaus (Equifax, Experian, TransUnion) and specialist identity-verification and sanctions-screening providers are highly concentrated—each bureau holds records on over 200 million US consumers—giving suppliers outsized leverage. Price increases or data access constraints can sharply impair onboarding and fraud workflows, and integrations plus certification commonly take 3–6 months, creating switching friction. Diversifying vendors and building orchestration layers mitigates risk but compliance mandates keep demand effectively inelastic.
Core banking and API partners
Integration with core systems (FIS, Fiserv, Jack Henry) is technically complex and critical; these three vendors underpin roughly 75% of US banking deposits in 2024, giving them outsized leverage. Core providers can prioritize their own front-ends and influence partner roadmaps and SLAs. Certified connectors reduce integration risk but often require revenue sharing and expose vendors to connector queue delays. Limited alternative cores amplifies partner bargaining power.
Cybersecurity and payments rails
Advanced threat intel, device fingerprinting and payments gateways are critical-path inputs for Q2, with top-tier vendors commanding 10–25% pricing premiums due to proven loss-mitigation results. Substituting components risks performance or compliance regressions and can raise fraud exposure; global card fraud was about 38 billion in 2024. Contracts commonly include volume tiers that can ratchet costs as usage grows.
- vendor_premium: 10–25%
- global_fraud_2024: ~38B
- substitution_risk: performance/compliance
- contract_structure: volume tiers can ratchet costs
Specialized engineering talent
Seasoned cloud, security, and fintech engineers remain scarce, pushing median cloud-engineer pay to about $140,000 in the US in 2024 and elevating wage pressure; talent markets therefore directly raise cost-to-serve and constrain delivery velocity. Retention packages and nearshore models lower churn but do not remove bargaining asymmetry, while knowledge concentration in key platform components raises replacement risk and remediation costs.
- Scarcity: median pay ~ $140k (2024)
- Turnover: ~22% tech churn (2024)
- Mitigants: retention + nearshore reduce but not remove risk
- Concentration: single-point knowledge increases replacement cost
Cloud oligopoly (AWS 32%, Azure 24%) pressures pricing
Q2 faces concentrated cloud supplier power (AWS ~32%, Azure ~24%, GCP ~11% in 2024) that can pressure pricing and egress fees.
Credit bureaus (each >200M US records) and core banking vendors (≈75% US deposits via FIS/Fiserv/Jack Henry) exert strong leverage on data, integration and contractual terms.
Specialist security/payments vendors and scarce cloud engineers (median pay ~$140k; tech churn ~22%) ratchet costs and raise switching friction.
| tag | value |
|---|---|
| cloud_share_2024 | AWS32/Azure24/GCP11% |
| credit_records | >200M each |
| core_deposits | ~75% |
| engineer_pay | $140k |
What is included in the product
Detailed Word Document
Tailored Porter’s Five Forces for Q2 Holdings that uncovers competitive intensity, buyer/supplier power, entry barriers, substitutes and regulatory threats, identifying strategic levers to protect market share and pricing.
Customizable Excel Spreadsheet
One-sheet Porter's Five Forces for Q2 Holdings that instantly highlights competitive pain points with a clean radar chart and customizable pressure scores—perfect for slides or rapid strategic decisions.
Customers Bargaining Power
Consolidated procurement
Banks and credit unions procure via formal RFPs with stringent security and compliance asks (SOC 2, FFIEC guidance active in 2024), which professional procurement teams use to improve price discovery and concessions. Multi-year deals remain buyer-favorable through SLA-linked opt-outs. Strong referenceability and documented ROI metrics reduce buyer leverage.
High switching costs
Deep integrations, data migration, and retraining make platform swaps costly and risky for Q2, which as of 2024 serves thousands of financial institutions and trades as QTWO on the NYSE; this dampens buyer power post-implementation. Buyers still leverage switching pain during renegotiations to extract pricing stability and roadmap commitments. Competitive pilots at renewal pose a tangible threat to incumbency.
Budget sensitivity
Financial institutions facing margin and efficiency pressures have sharpened price sensitivity, with buyers increasingly demanding per-user or usage-based models and larger bundling discounts. Demonstrable operational uplift from digital platforms like Q2 can reduce pricing tension by improving cost-to-serve and retention. Economic cycles—global GDP growth near 3.0% in 2024—amplify budget scrutiny and procurement rigor.
Demand for customization
Institutions demand tailored UX, workflows, and third-party plug-ins, which can expand project scope and create delivery dependencies that raise buyer leverage. Strong API and SDK strategies let Q2 convert customization requests into upsell opportunities and recurring revenue rather than one-time concessions. Conversely, weak extensibility amplifies customer bargaining power and churn risk.
- Customization increases scope/dependency
- APIs/SDKs = upsell, not concession
- Poor extensibility = higher buyer leverage
Outcome-driven SLAs
Buyers demand outcome-driven SLAs—commonly 99.99% uptime (≈52.6 minutes downtime/year), strict security guarantees, and rapid time-to-resolution credits—shifting operational and financial risk onto Q2 and forcing continuous improvement in platform reliability. Transparent SLA reporting reduces disputes and churn risk, while missed SLAs substantially increase buyers' renegotiation leverage.
- 99.99% uptime expectation
- SLA credits shift risk
- Transparent reporting lowers disputes
- Missed SLAs = higher buyer leverage
SLAs give buyers leverage; 99.99% uptime risk, 3.0% GDP
Buyers use formal RFPs and procurement teams to extract concessions; multi-year SLA-linked opt-outs keep leverage. Deep integrations and retraining raise switching costs—Q2 serves thousands (QTWO) in 2024—reducing post-implementation power. Price sensitivity and demand for usage-based models rose amid ~3.0% 2024 GDP, increasing negotiation pressure. Strict 99.99% SLA demands shift risk and raise renegotiation leverage when missed.
| Metric | 2024 Value |
|---|---|
| Uptime expectation | 99.99% (~52.6 min/yr) |
| Macro GDP | ≈3.0% |
| Customers served | Thousands (QTWO) |
What You See Is What You Get
Q2 Holdings Porter's Five Forces Analysis
This preview shows the exact Q2 Holdings Porter's Five Forces analysis you'll receive—no placeholders or mockups. The document is fully formatted and ready for download immediately after purchase. It contains the complete competitive assessment, implications and tactical recommendations. What you see is what you get.











