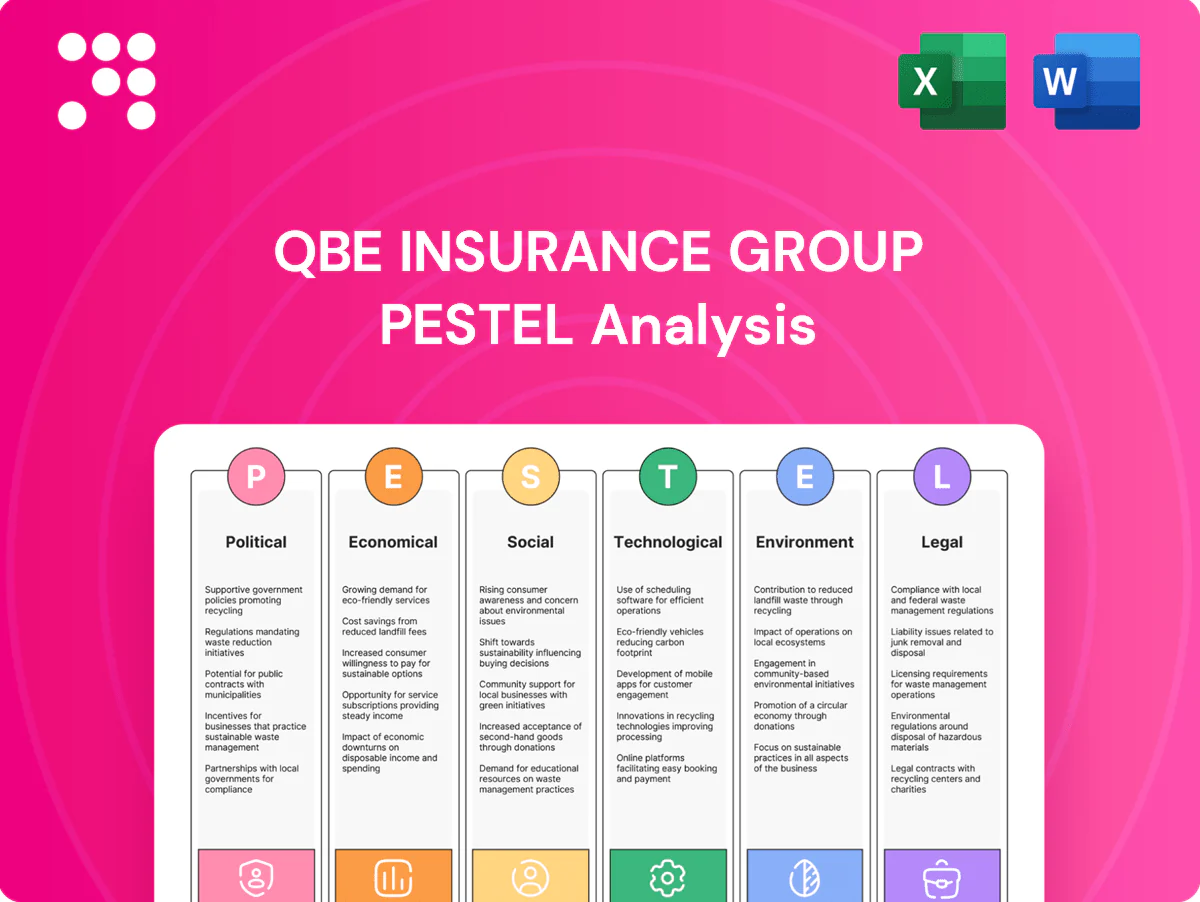
QBE Insurance Group PESTLE Analysis

Plan Smarter. Present Sharper. Compete Stronger.
Unlock how political shifts, economic cycles, and climate risk are reshaping QBE Insurance Group’s strategy and profitability; our concise PESTLE highlights critical external threats and opportunities. Ideal for investors and strategists, the full analysis delivers actionable insights and editable charts. Purchase now to access the complete, ready-to-use report.
Political factors

Geopolitical instability and sanctions
Geopolitical conflicts, trade tensions and shifting alliances materially alter QBE's risk exposures, reinsurance pricing and investment portfolios across the 27 countries it operates in. Sanctions regimes in the US, EU, UK and Australia constrain underwriting and claims settlement in affected jurisdictions. QBE must enforce stringent screening and tighten risk selection in volatile regions. Demand for political risk insurance may rise, but aggregation risks will increase.
Government-backed insurance pools
Government-backed pools such as the UKs Pool Re (established 1993) and Flood Re shape pricing, retention and capacity deployment by providing backstop capacity and shaping market reinsurance costs; participation can reduce loss volatility but brings capital and reporting obligations that affect QBEs capital allocation. QBE must optimise ceded versus retained risk across programs as policy changes (eg distribution or premium subsidies) can materially alter product economics and distribution incentives.

Regulatory divergence across markets
Operating across 27 countries exposes QBE to heterogeneous supervisory practices—APRA, ASIC, PRA, NAIC and others—where divergent capital, reporting and conduct standards increase operational complexity and compliance cost. Management may tilt portfolio mix toward regimes with clearer rules and stable oversight to reduce volatility and capital strain. Global harmonization efforts lag geopolitical fragmentation, keeping compliance overhead elevated.

Fiscal and subsidy policies
Shifts in taxation, disaster recovery funding and premium subsidies directly affect demand and affordability; government resilience investment can lower long‑term loss ratios, while withdrawal raises residual risk QBE must price. QBE reported roughly US$14bn gross written premium in FY24, so cross‑border tax changes can materially affect after‑tax investment returns and capital allocation.
- Tax shifts change pricing and capital deployment
- Public resilience reduces insurer loss ratios
- Subsidy withdrawal increases uninsured exposure
Political climate on climate policy
Political momentum on decarbonization — with over 130 countries holding net-zero targets and carbon pricing covering roughly 25% of global emissions by 2024 — raises transition risks for insureds and forces QBE to align its ~A$60–70bn investment portfolio with lower-carbon pathways. Policy delays or rollbacks can extend high-emissions exposures and litigation uncertainty, while clear signals post-COP processes improve data availability and catastrophe modeling. QBE must adapt underwriting appetite and product design to evolving policy trajectories to manage asset and liability risk.
- Policy momentum: >130 countries with net-zero targets (2024)
- Carbon pricing: ~25% of emissions covered (2024)
- Investment exposure: QBE-sized portfolios require decarbonization alignment
- Action: tighten underwriting appetite; enhance climate data and litigation monitoring
Geopolitics, sanctions and climate policy raise volatility for 27-country insurer
Geopolitical conflict, sanctions and trade tensions across QBEs 27-country footprint raise underwriting, reinsurance and investment volatility; FY24 gross written premium ~US$14bn magnifies cross-border policy impact. Diverse regulators (APRA, PRA, NAIC) and tax/subsidy shifts increase compliance and capital strain; public resilience funding and Pool Re-style backstops alter loss allocation. Climate policy (130+ net-zero countries; ~25% emissions carbon‑priced in 2024) forces alignment of QBE’s ~A$60–70bn investment portfolio and underwriting appetite.
| Metric | Value |
|---|---|
| Countries | 27 |
| GWP FY24 | US$14bn |
| Investment portfolio | A$60–70bn |
| Net-zero signatories | 130+ |
| Carbon pricing coverage (2024) | ~25% |
| Key regulators | APRA, PRA, NAIC, ASIC |
What is included in the product
 Detailed Word Document
Explores how Political, Economic, Social, Technological, Environmental and Legal forces uniquely affect QBE Insurance Group, with data-backed trends and sector-specific examples to identify risks, opportunities and strategic responses for executives, investors and planners.

 Customizable Excel Spreadsheet
A concise, visually segmented PESTLE analysis of QBE Insurance Group that distills regulatory, economic, social, technological, environmental and political risks into a clean summary for quick referencing, editable notes, easy sharing, and seamless insertion into presentations to support risk discussions and strategic planning.
Economic factors

Interest rate and yield environment
Investment income for QBE remains sensitive to rate cycles as 10‑year government yields hovered near 4% in mid‑2025, boosting running yield but pressuring existing bond valuations. IFRS 17 discount rates and capital metrics move with these yields, altering reserve levels and solvency ratios. Pricing must embed higher cost of capital and inflation expectations, while active asset–liability duration matching controls earnings volatility.
Inflation and claims severity
General and social inflation raised repair, medical and liability costs as CPI remained elevated in 2024 (US ~3.4%, Australia ~4.1%), pushing claims severity higher for QBE. Supply-chain frictions amplified property and motor severity via parts and rebuild cost inflation. QBE needs agile pricing, shorter policy terms and tightened wordings. Claims automation and stronger vendor management curb leakage and speed recoveries.

Reinsurance market cycle
Hard market conditions pushed global reinsurance pricing higher—property-cat renewals rose roughly 15% in 2023–24—tightening terms and increasing QBE’s ceded costs, pressuring net retentions. Adequate catastrophe capacity remains vital for QBE’s nat‑cat heavy portfolios as ILS and collateralised reinsurance reached about $120bn of capacity in 2024. QBE must optimize panels, expand multi‑year covers and use alternative capital to stabilize capacity. Rigorous pricing discipline and tighter risk selection are essential to protect margins.

FX volatility and global earnings
QBE’s multi-currency premiums, claims and capital create translation and transaction risks across USD, GBP, EUR and AUD, cited in QBE’s 2024 annual statements as core exposures.
Active hedging programs reduce volatility in reported earnings but increase cost and operational complexity, with hedging losses/gains disclosed in 2024 results linked to FX movements.
Geographic mix and local capital controls can constrain repatriation and liquidity, requiring capital management actions noted in QBE’s 2024 capital review.
- FX exposures: USD, GBP, EUR, AUD
- Hedging trade-off: volatility reduction vs cost/complexity
- Repatriation risk: local rules and FX liquidity
Macro cycles and demand
Macro cycles drive QBE exposures as SME and corporate demand expands in growth phases and contracts in recessions; IMF forecasts global GDP growth of about 3.1% in 2024 and 3.0% in 2025, pressuring rates and retention during downturns. Construction, automotive (≈76m light vehicles globally in 2023) and trade volumes shape premium pools, while cyber and specialty lines show resilience, prompting shifts in distribution and product mix.
- Growth phases: more SME/corp exposures
- Recessions: rate compression, lower retention
- Sectors: construction, auto, trade drive premiums
- Resilience: cyber/specialty; pivot distribution/product mix
Geopolitics, sanctions and climate policy raise volatility for 27-country insurer
Rising 10‑year yields near 4% in mid‑2025 lift investment running yield but mark down existing bond values, moving IFRS 17 discount rates and solvency metrics. Elevated CPI in 2024 (US 3.4%, AU 4.1%) and supply‑chain inflation raised claims severity, while reinsurance hardening (property‑cat pricing +~15% in 2023–24) and $120bn ILS capacity tightened ceded options. Multi‑currency FX (USD, GBP, EUR, AUD) and local capital controls drive hedging and repatriation strategies amid IMF GDP ~3.1% (2024) and ~3.0% (2025).
| Metric | Value |
|---|---|
| 10yr gov yields | ~4% (mid‑2025) |
| CPI | US 3.4% / AU 4.1% (2024) |
| Reins pricing | +~15% (2023–24) |
| ILS capacity | $120bn (2024) |
What You See Is What You Get
QBE Insurance Group PESTLE Analysis
The preview shown here is the exact QBE Insurance Group PESTLE Analysis you’ll receive after purchase—fully formatted and ready to use. It contains comprehensive political, economic, social, technological, legal and environmental assessments tailored to QBE. No placeholders or teasers—this is the final, downloadable file delivered exactly as shown.

Plan Smarter. Present Sharper. Compete Stronger.
Unlock how political shifts, economic cycles, and climate risk are reshaping QBE Insurance Group’s strategy and profitability; our concise PESTLE highlights critical external threats and opportunities. Ideal for investors and strategists, the full analysis delivers actionable insights and editable charts. Purchase now to access the complete, ready-to-use report.
Political factors
Geopolitical instability and sanctions
Geopolitical conflicts, trade tensions and shifting alliances materially alter QBE's risk exposures, reinsurance pricing and investment portfolios across the 27 countries it operates in. Sanctions regimes in the US, EU, UK and Australia constrain underwriting and claims settlement in affected jurisdictions. QBE must enforce stringent screening and tighten risk selection in volatile regions. Demand for political risk insurance may rise, but aggregation risks will increase.
Government-backed insurance pools
Government-backed pools such as the UKs Pool Re (established 1993) and Flood Re shape pricing, retention and capacity deployment by providing backstop capacity and shaping market reinsurance costs; participation can reduce loss volatility but brings capital and reporting obligations that affect QBEs capital allocation. QBE must optimise ceded versus retained risk across programs as policy changes (eg distribution or premium subsidies) can materially alter product economics and distribution incentives.
Regulatory divergence across markets
Operating across 27 countries exposes QBE to heterogeneous supervisory practices—APRA, ASIC, PRA, NAIC and others—where divergent capital, reporting and conduct standards increase operational complexity and compliance cost. Management may tilt portfolio mix toward regimes with clearer rules and stable oversight to reduce volatility and capital strain. Global harmonization efforts lag geopolitical fragmentation, keeping compliance overhead elevated.
Fiscal and subsidy policies
Shifts in taxation, disaster recovery funding and premium subsidies directly affect demand and affordability; government resilience investment can lower long‑term loss ratios, while withdrawal raises residual risk QBE must price. QBE reported roughly US$14bn gross written premium in FY24, so cross‑border tax changes can materially affect after‑tax investment returns and capital allocation.
- Tax shifts change pricing and capital deployment
- Public resilience reduces insurer loss ratios
- Subsidy withdrawal increases uninsured exposure
Political climate on climate policy
Political momentum on decarbonization — with over 130 countries holding net-zero targets and carbon pricing covering roughly 25% of global emissions by 2024 — raises transition risks for insureds and forces QBE to align its ~A$60–70bn investment portfolio with lower-carbon pathways. Policy delays or rollbacks can extend high-emissions exposures and litigation uncertainty, while clear signals post-COP processes improve data availability and catastrophe modeling. QBE must adapt underwriting appetite and product design to evolving policy trajectories to manage asset and liability risk.
- Policy momentum: >130 countries with net-zero targets (2024)
- Carbon pricing: ~25% of emissions covered (2024)
- Investment exposure: QBE-sized portfolios require decarbonization alignment
- Action: tighten underwriting appetite; enhance climate data and litigation monitoring
Geopolitics, sanctions and climate policy raise volatility for 27-country insurer
Geopolitical conflict, sanctions and trade tensions across QBEs 27-country footprint raise underwriting, reinsurance and investment volatility; FY24 gross written premium ~US$14bn magnifies cross-border policy impact. Diverse regulators (APRA, PRA, NAIC) and tax/subsidy shifts increase compliance and capital strain; public resilience funding and Pool Re-style backstops alter loss allocation. Climate policy (130+ net-zero countries; ~25% emissions carbon‑priced in 2024) forces alignment of QBE’s ~A$60–70bn investment portfolio and underwriting appetite.
| Metric | Value |
|---|---|
| Countries | 27 |
| GWP FY24 | US$14bn |
| Investment portfolio | A$60–70bn |
| Net-zero signatories | 130+ |
| Carbon pricing coverage (2024) | ~25% |
| Key regulators | APRA, PRA, NAIC, ASIC |
What is included in the product
Detailed Word Document
Explores how Political, Economic, Social, Technological, Environmental and Legal forces uniquely affect QBE Insurance Group, with data-backed trends and sector-specific examples to identify risks, opportunities and strategic responses for executives, investors and planners.
Customizable Excel Spreadsheet
A concise, visually segmented PESTLE analysis of QBE Insurance Group that distills regulatory, economic, social, technological, environmental and political risks into a clean summary for quick referencing, editable notes, easy sharing, and seamless insertion into presentations to support risk discussions and strategic planning.
Economic factors
Interest rate and yield environment
Investment income for QBE remains sensitive to rate cycles as 10‑year government yields hovered near 4% in mid‑2025, boosting running yield but pressuring existing bond valuations. IFRS 17 discount rates and capital metrics move with these yields, altering reserve levels and solvency ratios. Pricing must embed higher cost of capital and inflation expectations, while active asset–liability duration matching controls earnings volatility.
Inflation and claims severity
General and social inflation raised repair, medical and liability costs as CPI remained elevated in 2024 (US ~3.4%, Australia ~4.1%), pushing claims severity higher for QBE. Supply-chain frictions amplified property and motor severity via parts and rebuild cost inflation. QBE needs agile pricing, shorter policy terms and tightened wordings. Claims automation and stronger vendor management curb leakage and speed recoveries.
Reinsurance market cycle
Hard market conditions pushed global reinsurance pricing higher—property-cat renewals rose roughly 15% in 2023–24—tightening terms and increasing QBE’s ceded costs, pressuring net retentions. Adequate catastrophe capacity remains vital for QBE’s nat‑cat heavy portfolios as ILS and collateralised reinsurance reached about $120bn of capacity in 2024. QBE must optimize panels, expand multi‑year covers and use alternative capital to stabilize capacity. Rigorous pricing discipline and tighter risk selection are essential to protect margins.
FX volatility and global earnings
QBE’s multi-currency premiums, claims and capital create translation and transaction risks across USD, GBP, EUR and AUD, cited in QBE’s 2024 annual statements as core exposures.
Active hedging programs reduce volatility in reported earnings but increase cost and operational complexity, with hedging losses/gains disclosed in 2024 results linked to FX movements.
Geographic mix and local capital controls can constrain repatriation and liquidity, requiring capital management actions noted in QBE’s 2024 capital review.
- FX exposures: USD, GBP, EUR, AUD
- Hedging trade-off: volatility reduction vs cost/complexity
- Repatriation risk: local rules and FX liquidity
Macro cycles and demand
Macro cycles drive QBE exposures as SME and corporate demand expands in growth phases and contracts in recessions; IMF forecasts global GDP growth of about 3.1% in 2024 and 3.0% in 2025, pressuring rates and retention during downturns. Construction, automotive (≈76m light vehicles globally in 2023) and trade volumes shape premium pools, while cyber and specialty lines show resilience, prompting shifts in distribution and product mix.
- Growth phases: more SME/corp exposures
- Recessions: rate compression, lower retention
- Sectors: construction, auto, trade drive premiums
- Resilience: cyber/specialty; pivot distribution/product mix
Geopolitics, sanctions and climate policy raise volatility for 27-country insurer
Rising 10‑year yields near 4% in mid‑2025 lift investment running yield but mark down existing bond values, moving IFRS 17 discount rates and solvency metrics. Elevated CPI in 2024 (US 3.4%, AU 4.1%) and supply‑chain inflation raised claims severity, while reinsurance hardening (property‑cat pricing +~15% in 2023–24) and $120bn ILS capacity tightened ceded options. Multi‑currency FX (USD, GBP, EUR, AUD) and local capital controls drive hedging and repatriation strategies amid IMF GDP ~3.1% (2024) and ~3.0% (2025).
| Metric | Value |
|---|---|
| 10yr gov yields | ~4% (mid‑2025) |
| CPI | US 3.4% / AU 4.1% (2024) |
| Reins pricing | +~15% (2023–24) |
| ILS capacity | $120bn (2024) |
What You See Is What You Get
QBE Insurance Group PESTLE Analysis
The preview shown here is the exact QBE Insurance Group PESTLE Analysis you’ll receive after purchase—fully formatted and ready to use. It contains comprehensive political, economic, social, technological, legal and environmental assessments tailored to QBE. No placeholders or teasers—this is the final, downloadable file delivered exactly as shown.
Original: $10.00
-65%$10.00
$3.50Description
Plan Smarter. Present Sharper. Compete Stronger.
Unlock how political shifts, economic cycles, and climate risk are reshaping QBE Insurance Group’s strategy and profitability; our concise PESTLE highlights critical external threats and opportunities. Ideal for investors and strategists, the full analysis delivers actionable insights and editable charts. Purchase now to access the complete, ready-to-use report.
Political factors
Geopolitical instability and sanctions
Geopolitical conflicts, trade tensions and shifting alliances materially alter QBE's risk exposures, reinsurance pricing and investment portfolios across the 27 countries it operates in. Sanctions regimes in the US, EU, UK and Australia constrain underwriting and claims settlement in affected jurisdictions. QBE must enforce stringent screening and tighten risk selection in volatile regions. Demand for political risk insurance may rise, but aggregation risks will increase.
Government-backed insurance pools
Government-backed pools such as the UKs Pool Re (established 1993) and Flood Re shape pricing, retention and capacity deployment by providing backstop capacity and shaping market reinsurance costs; participation can reduce loss volatility but brings capital and reporting obligations that affect QBEs capital allocation. QBE must optimise ceded versus retained risk across programs as policy changes (eg distribution or premium subsidies) can materially alter product economics and distribution incentives.
Regulatory divergence across markets
Operating across 27 countries exposes QBE to heterogeneous supervisory practices—APRA, ASIC, PRA, NAIC and others—where divergent capital, reporting and conduct standards increase operational complexity and compliance cost. Management may tilt portfolio mix toward regimes with clearer rules and stable oversight to reduce volatility and capital strain. Global harmonization efforts lag geopolitical fragmentation, keeping compliance overhead elevated.
Fiscal and subsidy policies
Shifts in taxation, disaster recovery funding and premium subsidies directly affect demand and affordability; government resilience investment can lower long‑term loss ratios, while withdrawal raises residual risk QBE must price. QBE reported roughly US$14bn gross written premium in FY24, so cross‑border tax changes can materially affect after‑tax investment returns and capital allocation.
- Tax shifts change pricing and capital deployment
- Public resilience reduces insurer loss ratios
- Subsidy withdrawal increases uninsured exposure
Political climate on climate policy
Political momentum on decarbonization — with over 130 countries holding net-zero targets and carbon pricing covering roughly 25% of global emissions by 2024 — raises transition risks for insureds and forces QBE to align its ~A$60–70bn investment portfolio with lower-carbon pathways. Policy delays or rollbacks can extend high-emissions exposures and litigation uncertainty, while clear signals post-COP processes improve data availability and catastrophe modeling. QBE must adapt underwriting appetite and product design to evolving policy trajectories to manage asset and liability risk.
- Policy momentum: >130 countries with net-zero targets (2024)
- Carbon pricing: ~25% of emissions covered (2024)
- Investment exposure: QBE-sized portfolios require decarbonization alignment
- Action: tighten underwriting appetite; enhance climate data and litigation monitoring
Geopolitics, sanctions and climate policy raise volatility for 27-country insurer
Geopolitical conflict, sanctions and trade tensions across QBEs 27-country footprint raise underwriting, reinsurance and investment volatility; FY24 gross written premium ~US$14bn magnifies cross-border policy impact. Diverse regulators (APRA, PRA, NAIC) and tax/subsidy shifts increase compliance and capital strain; public resilience funding and Pool Re-style backstops alter loss allocation. Climate policy (130+ net-zero countries; ~25% emissions carbon‑priced in 2024) forces alignment of QBE’s ~A$60–70bn investment portfolio and underwriting appetite.
| Metric | Value |
|---|---|
| Countries | 27 |
| GWP FY24 | US$14bn |
| Investment portfolio | A$60–70bn |
| Net-zero signatories | 130+ |
| Carbon pricing coverage (2024) | ~25% |
| Key regulators | APRA, PRA, NAIC, ASIC |
What is included in the product
Detailed Word Document
Explores how Political, Economic, Social, Technological, Environmental and Legal forces uniquely affect QBE Insurance Group, with data-backed trends and sector-specific examples to identify risks, opportunities and strategic responses for executives, investors and planners.
Customizable Excel Spreadsheet
A concise, visually segmented PESTLE analysis of QBE Insurance Group that distills regulatory, economic, social, technological, environmental and political risks into a clean summary for quick referencing, editable notes, easy sharing, and seamless insertion into presentations to support risk discussions and strategic planning.
Economic factors
Interest rate and yield environment
Investment income for QBE remains sensitive to rate cycles as 10‑year government yields hovered near 4% in mid‑2025, boosting running yield but pressuring existing bond valuations. IFRS 17 discount rates and capital metrics move with these yields, altering reserve levels and solvency ratios. Pricing must embed higher cost of capital and inflation expectations, while active asset–liability duration matching controls earnings volatility.
Inflation and claims severity
General and social inflation raised repair, medical and liability costs as CPI remained elevated in 2024 (US ~3.4%, Australia ~4.1%), pushing claims severity higher for QBE. Supply-chain frictions amplified property and motor severity via parts and rebuild cost inflation. QBE needs agile pricing, shorter policy terms and tightened wordings. Claims automation and stronger vendor management curb leakage and speed recoveries.
Reinsurance market cycle
Hard market conditions pushed global reinsurance pricing higher—property-cat renewals rose roughly 15% in 2023–24—tightening terms and increasing QBE’s ceded costs, pressuring net retentions. Adequate catastrophe capacity remains vital for QBE’s nat‑cat heavy portfolios as ILS and collateralised reinsurance reached about $120bn of capacity in 2024. QBE must optimize panels, expand multi‑year covers and use alternative capital to stabilize capacity. Rigorous pricing discipline and tighter risk selection are essential to protect margins.
FX volatility and global earnings
QBE’s multi-currency premiums, claims and capital create translation and transaction risks across USD, GBP, EUR and AUD, cited in QBE’s 2024 annual statements as core exposures.
Active hedging programs reduce volatility in reported earnings but increase cost and operational complexity, with hedging losses/gains disclosed in 2024 results linked to FX movements.
Geographic mix and local capital controls can constrain repatriation and liquidity, requiring capital management actions noted in QBE’s 2024 capital review.
- FX exposures: USD, GBP, EUR, AUD
- Hedging trade-off: volatility reduction vs cost/complexity
- Repatriation risk: local rules and FX liquidity
Macro cycles and demand
Macro cycles drive QBE exposures as SME and corporate demand expands in growth phases and contracts in recessions; IMF forecasts global GDP growth of about 3.1% in 2024 and 3.0% in 2025, pressuring rates and retention during downturns. Construction, automotive (≈76m light vehicles globally in 2023) and trade volumes shape premium pools, while cyber and specialty lines show resilience, prompting shifts in distribution and product mix.
- Growth phases: more SME/corp exposures
- Recessions: rate compression, lower retention
- Sectors: construction, auto, trade drive premiums
- Resilience: cyber/specialty; pivot distribution/product mix
Geopolitics, sanctions and climate policy raise volatility for 27-country insurer
Rising 10‑year yields near 4% in mid‑2025 lift investment running yield but mark down existing bond values, moving IFRS 17 discount rates and solvency metrics. Elevated CPI in 2024 (US 3.4%, AU 4.1%) and supply‑chain inflation raised claims severity, while reinsurance hardening (property‑cat pricing +~15% in 2023–24) and $120bn ILS capacity tightened ceded options. Multi‑currency FX (USD, GBP, EUR, AUD) and local capital controls drive hedging and repatriation strategies amid IMF GDP ~3.1% (2024) and ~3.0% (2025).
| Metric | Value |
|---|---|
| 10yr gov yields | ~4% (mid‑2025) |
| CPI | US 3.4% / AU 4.1% (2024) |
| Reins pricing | +~15% (2023–24) |
| ILS capacity | $120bn (2024) |
What You See Is What You Get
QBE Insurance Group PESTLE Analysis
The preview shown here is the exact QBE Insurance Group PESTLE Analysis you’ll receive after purchase—fully formatted and ready to use. It contains comprehensive political, economic, social, technological, legal and environmental assessments tailored to QBE. No placeholders or teasers—this is the final, downloadable file delivered exactly as shown.











