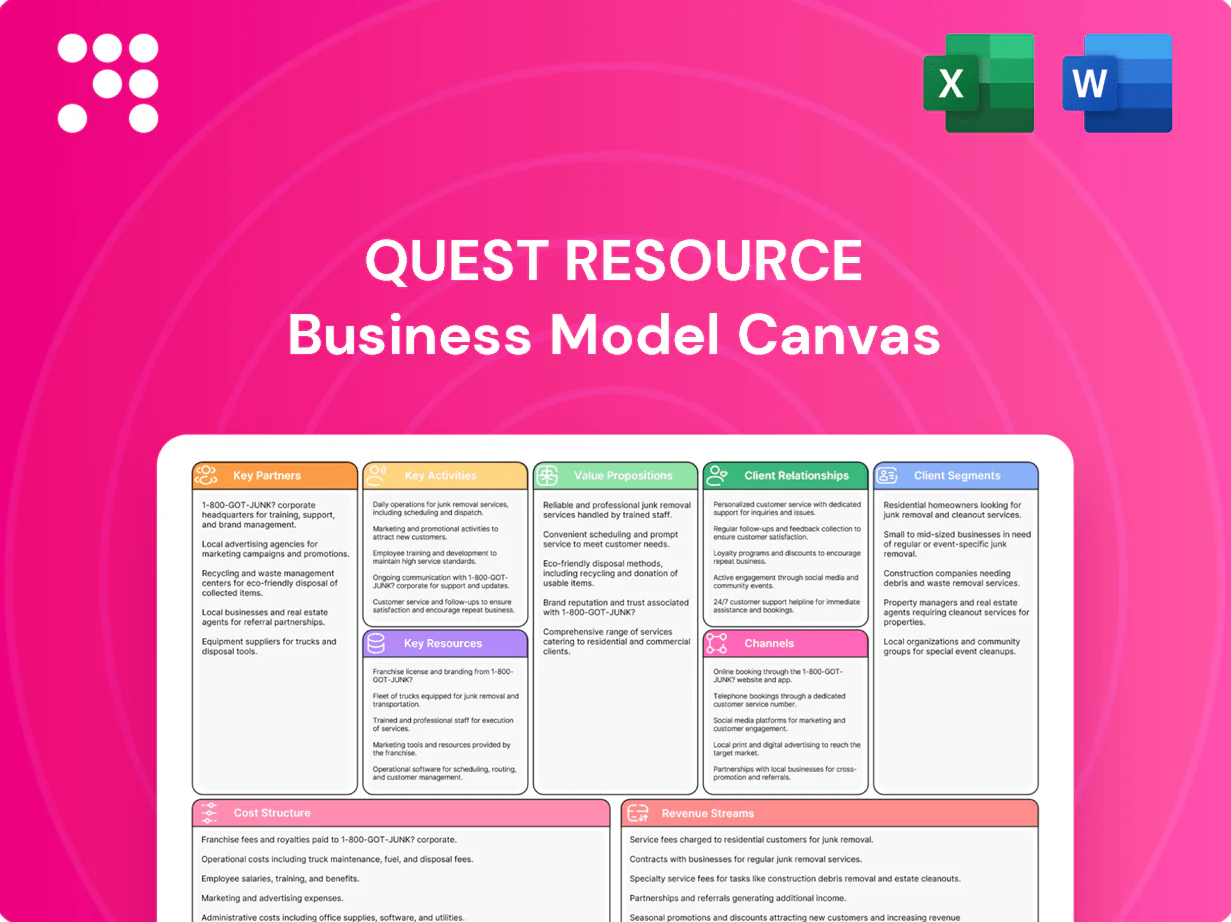
Quest Resource Business Model Canvas

Ready-to-Use Business Model Canvas Template for Investors and Founders
Unlock the full strategic blueprint behind Quest Resource with our in-depth Business Model Canvas—three to five actionable sections reveal value propositions, revenue streams, and key partnerships that drive growth. Ideal for investors, consultants, and founders seeking a ready-to-use template in Word and Excel, this download accelerates strategic planning and competitive analysis—get the complete canvas to benchmark and scale confidently.
Partnerships

Haulers and recycling facility networks
Partnerships with regional and national haulers ensure reliable pickup, transport, and processing of diverse waste streams, leveraging networks that cover local and interstate routes. Recycling facilities provide capacity for paper, plastics, metals, organics and e-waste; U.S. municipal solid waste recycling rate was 32.1% in 2018 (EPA). Contracted throughput and SLAs stabilize service quality and pricing, enabling multi-site scalability for enterprise clients.
Technology and data platform providers
Software partners support routing, tracking, compliance documentation and analytics. IoT sensors and telematics vendors enable container monitoring and diversion measurement. Integrations with client ERP and ESG systems streamline reporting; 90% of S&P 500 published sustainability reports in 2023, driving demand for automated ESG data. These alliances power data-driven optimization and sustainability scorecards.

Commodity brokers and end-market buyers
Relationships with commodity brokers and end-market buyers create reliable outlets for recyclables and byproducts, tapping a recycled plastics market that reached roughly 50 billion USD in 2024. Broker agreements help manage price volatility and logistics through pooled contracts and hedging mechanisms. Guaranteed offtake supports client revenue-sharing models by locking baseline volumes and cashflows. This buyer-broker network underpins measurable circular economy outcomes.

Equipment suppliers and maintenance firms
Equipment vendors supplying compactors, balers and optical sorters drive on-site efficiency—balers and compactors can reduce waste volume by 70–90%—while leasing and maintenance partners lower upfront capex and cut downtime, supporting industry-standard uptime targets above 95%. Standardized specs improve safety and performance across client sites and enable rapid deployment of tailored waste systems.
- Reduced volume: 70–90%
- Uptime target: >95%
- Lower capex via leasing
- Faster deployment, consistent safety
Regulatory, certification, and ESG partners
Alliances with environmental consultants and auditors ensure Quest meets federal, state, and local rules, reducing client regulatory risk and operational interruptions; GRI reported over 12,000 organizations using its standards by 2024, boosting disclosure alignment.
Partnerships with certification bodies support zero-waste and landfill diversion goals, enabling clients to pursue TRUE or Zero Waste certifications and improve diversion rates reported in audits.
Integration with ESG frameworks and disclosure platforms enhances reporting credibility and investor confidence, aligning clients with growing 2024 demand for standardized sustainability data.
- Regulatory compliance: reduced enforcement exposure
- Certifications: TRUE/Zero Waste pathways
- ESG disclosure: GRI usage 12,000+ (2024)
Partners stabilize recycled plastics pricing and volumes in ~50B market
Strategic hauler, recycler, broker, equipment and ESG partners secure pickup, processing and offtake, stabilizing volumes and pricing; recycled plastics market ≈50B USD (2024). Tech and IoT partners enable routing, diversion measurement and ERP/ESG integration; GRI used by 12,000+ orgs (2024). Equipment and maintenance alliances cut volume 70–90% and target uptime >95%, enabling rapid, scalable deployments.
| Metric | Value |
|---|---|
| Recycled plastics market (2024) | ~50B USD |
| GRI users (2024) | 12,000+ |
| Volume reduction | 70–90% |
| Uptime target | >95% |
What is included in the product
 Detailed Word Document
A comprehensive Business Model Canvas for Quest Resource that maps nine BMC blocks—customer segments, value propositions, channels, revenue streams, key resources, activities, partners, cost structure, and customer relationships—providing strategic insights, SWOT-linked analysis, and investor-ready narrative to support presentations and validation of operational plans.

 Customizable Excel Spreadsheet
High-level view of Quest Resource’s business model with editable cells — condenses strategy into a clean one-page snapshot for fast boardroom review and team collaboration, saving hours of formatting while easing comparisons across scenarios.
Activities

Multi-stream waste and recycling program design
Assess client sites to map waste generation and material flows, using audits and bin counts to quantify streams; configure segregation, containerization and pickup schedules to optimize routes and reduce hauling costs. Tailor programs by industry and local infrastructure; set KPIs for cost per ton, diversion rate (50%+ targets common in 2024) and regulatory compliance.
Logistics orchestration and vendor management
Dispatch haulers, manage service frequencies and resolve exceptions across regions to sustain SLA performance near 98% on-time in 2024. Negotiate regional rates targeting 8–12% cost savings while monitoring SLAs and vendor KPIs. Consolidate invoicing and rebates to cut billing overhead roughly 30%, simplifying client operations. Optimize routes with real-time tools to reduce emissions up to 15% and lower transport costs about 10%.

Materials recovery and circular solutions
Identify reuse, refurbishment and recycling streams prioritizing high-value flows and repairable goods; EU targets 55% municipal recycling by 2025, sharpening opportunities for reverse logistics. Implement take-back and reverse logistics programs to recover materials—US MSW recycling was 32% (EPA 2020). Develop outlets for organics, cooking oil, textiles and specialty streams; only about 1% of clothing is recycled into new garments (Ellen MacArthur). Convert waste to value where feasible through feedstock, compost and biofuel pathways.

Compliance, reporting, and ESG analytics
Maintain comprehensive documentation for permits, manifests, and audits, producing site and enterprise-level diversion and emissions reports that align with ISSB/TCFD frameworks and regulatory requirements in 2024. Outputs map to client ESG frameworks and feed analytics that quantify diversion and CO2e trends to guide continuous improvement across operations. Insights prioritize corrective actions, cost reductions, and compliance risk mitigation.
- Documentation: permits, manifests, audit trails
- Reporting: site + enterprise diversion and emissions
- Standards: ISSB, TCFD alignment
- Outcomes: analytics-driven continuous improvement
Client support, education, and change management
Train staff on segregation and contamination reduction; 2024 programs report average contamination declines of 28% and diversion gains of 15–25% after targeted training. Roll out clear signage and engagement campaigns that lifted participation by 22% in 2024 pilots. Deliver multi-site onboarding and ongoing support to scale across dozens of locations while iterating programs using feedback and performance data.
- Train staff: 28% contamination reduction (2024)
- Signage & campaigns: +22% participation (2024)
- Multi-site onboarding: scalable ongoing support
- Iterate: data-driven adjustments from KPIs & feedback
50%+ diversion, 98% on-time, -28% contamination
Conduct site audits and route-optimized pickup schedules to hit 50%+ diversion targets (2024); sustain ~98% on-time SLA and negotiate 8–12% hauling savings. Run training to cut contamination ~28% and deploy reverse logistics for high-value streams. Centralize billing to reduce overhead ~30% while reporting to ISSB/TCFD-aligned metrics.
| Metric | 2024 Benchmark | Impact |
|---|---|---|
| Diversion rate | 50%+ | Waste reduction |
| On-time SLA | 98% | Service reliability |
| Contamination | -28% | Higher recycling |
| Billing overhead | -30% | Ops saving |
What You See Is What You Get
Business Model Canvas
The Quest Resource Business Model Canvas shown here is the exact document you will receive after purchase, not a mockup or sample. This preview contains live content and layout as delivered, ready for editing and presentation. Upon purchase you’ll instantly download the complete, fully editable file in the same format.

Ready-to-Use Business Model Canvas Template for Investors and Founders
Unlock the full strategic blueprint behind Quest Resource with our in-depth Business Model Canvas—three to five actionable sections reveal value propositions, revenue streams, and key partnerships that drive growth. Ideal for investors, consultants, and founders seeking a ready-to-use template in Word and Excel, this download accelerates strategic planning and competitive analysis—get the complete canvas to benchmark and scale confidently.
Partnerships
Haulers and recycling facility networks
Partnerships with regional and national haulers ensure reliable pickup, transport, and processing of diverse waste streams, leveraging networks that cover local and interstate routes. Recycling facilities provide capacity for paper, plastics, metals, organics and e-waste; U.S. municipal solid waste recycling rate was 32.1% in 2018 (EPA). Contracted throughput and SLAs stabilize service quality and pricing, enabling multi-site scalability for enterprise clients.
Technology and data platform providers
Software partners support routing, tracking, compliance documentation and analytics. IoT sensors and telematics vendors enable container monitoring and diversion measurement. Integrations with client ERP and ESG systems streamline reporting; 90% of S&P 500 published sustainability reports in 2023, driving demand for automated ESG data. These alliances power data-driven optimization and sustainability scorecards.
Commodity brokers and end-market buyers
Relationships with commodity brokers and end-market buyers create reliable outlets for recyclables and byproducts, tapping a recycled plastics market that reached roughly 50 billion USD in 2024. Broker agreements help manage price volatility and logistics through pooled contracts and hedging mechanisms. Guaranteed offtake supports client revenue-sharing models by locking baseline volumes and cashflows. This buyer-broker network underpins measurable circular economy outcomes.
Equipment suppliers and maintenance firms
Equipment vendors supplying compactors, balers and optical sorters drive on-site efficiency—balers and compactors can reduce waste volume by 70–90%—while leasing and maintenance partners lower upfront capex and cut downtime, supporting industry-standard uptime targets above 95%. Standardized specs improve safety and performance across client sites and enable rapid deployment of tailored waste systems.
- Reduced volume: 70–90%
- Uptime target: >95%
- Lower capex via leasing
- Faster deployment, consistent safety
Regulatory, certification, and ESG partners
Alliances with environmental consultants and auditors ensure Quest meets federal, state, and local rules, reducing client regulatory risk and operational interruptions; GRI reported over 12,000 organizations using its standards by 2024, boosting disclosure alignment.
Partnerships with certification bodies support zero-waste and landfill diversion goals, enabling clients to pursue TRUE or Zero Waste certifications and improve diversion rates reported in audits.
Integration with ESG frameworks and disclosure platforms enhances reporting credibility and investor confidence, aligning clients with growing 2024 demand for standardized sustainability data.
- Regulatory compliance: reduced enforcement exposure
- Certifications: TRUE/Zero Waste pathways
- ESG disclosure: GRI usage 12,000+ (2024)
Partners stabilize recycled plastics pricing and volumes in ~50B market
Strategic hauler, recycler, broker, equipment and ESG partners secure pickup, processing and offtake, stabilizing volumes and pricing; recycled plastics market ≈50B USD (2024). Tech and IoT partners enable routing, diversion measurement and ERP/ESG integration; GRI used by 12,000+ orgs (2024). Equipment and maintenance alliances cut volume 70–90% and target uptime >95%, enabling rapid, scalable deployments.
| Metric | Value |
|---|---|
| Recycled plastics market (2024) | ~50B USD |
| GRI users (2024) | 12,000+ |
| Volume reduction | 70–90% |
| Uptime target | >95% |
What is included in the product
Detailed Word Document
A comprehensive Business Model Canvas for Quest Resource that maps nine BMC blocks—customer segments, value propositions, channels, revenue streams, key resources, activities, partners, cost structure, and customer relationships—providing strategic insights, SWOT-linked analysis, and investor-ready narrative to support presentations and validation of operational plans.
Customizable Excel Spreadsheet
High-level view of Quest Resource’s business model with editable cells — condenses strategy into a clean one-page snapshot for fast boardroom review and team collaboration, saving hours of formatting while easing comparisons across scenarios.
Activities
Multi-stream waste and recycling program design
Assess client sites to map waste generation and material flows, using audits and bin counts to quantify streams; configure segregation, containerization and pickup schedules to optimize routes and reduce hauling costs. Tailor programs by industry and local infrastructure; set KPIs for cost per ton, diversion rate (50%+ targets common in 2024) and regulatory compliance.
Logistics orchestration and vendor management
Dispatch haulers, manage service frequencies and resolve exceptions across regions to sustain SLA performance near 98% on-time in 2024. Negotiate regional rates targeting 8–12% cost savings while monitoring SLAs and vendor KPIs. Consolidate invoicing and rebates to cut billing overhead roughly 30%, simplifying client operations. Optimize routes with real-time tools to reduce emissions up to 15% and lower transport costs about 10%.
Materials recovery and circular solutions
Identify reuse, refurbishment and recycling streams prioritizing high-value flows and repairable goods; EU targets 55% municipal recycling by 2025, sharpening opportunities for reverse logistics. Implement take-back and reverse logistics programs to recover materials—US MSW recycling was 32% (EPA 2020). Develop outlets for organics, cooking oil, textiles and specialty streams; only about 1% of clothing is recycled into new garments (Ellen MacArthur). Convert waste to value where feasible through feedstock, compost and biofuel pathways.
Compliance, reporting, and ESG analytics
Maintain comprehensive documentation for permits, manifests, and audits, producing site and enterprise-level diversion and emissions reports that align with ISSB/TCFD frameworks and regulatory requirements in 2024. Outputs map to client ESG frameworks and feed analytics that quantify diversion and CO2e trends to guide continuous improvement across operations. Insights prioritize corrective actions, cost reductions, and compliance risk mitigation.
- Documentation: permits, manifests, audit trails
- Reporting: site + enterprise diversion and emissions
- Standards: ISSB, TCFD alignment
- Outcomes: analytics-driven continuous improvement
Client support, education, and change management
Train staff on segregation and contamination reduction; 2024 programs report average contamination declines of 28% and diversion gains of 15–25% after targeted training. Roll out clear signage and engagement campaigns that lifted participation by 22% in 2024 pilots. Deliver multi-site onboarding and ongoing support to scale across dozens of locations while iterating programs using feedback and performance data.
- Train staff: 28% contamination reduction (2024)
- Signage & campaigns: +22% participation (2024)
- Multi-site onboarding: scalable ongoing support
- Iterate: data-driven adjustments from KPIs & feedback
50%+ diversion, 98% on-time, -28% contamination
Conduct site audits and route-optimized pickup schedules to hit 50%+ diversion targets (2024); sustain ~98% on-time SLA and negotiate 8–12% hauling savings. Run training to cut contamination ~28% and deploy reverse logistics for high-value streams. Centralize billing to reduce overhead ~30% while reporting to ISSB/TCFD-aligned metrics.
| Metric | 2024 Benchmark | Impact |
|---|---|---|
| Diversion rate | 50%+ | Waste reduction |
| On-time SLA | 98% | Service reliability |
| Contamination | -28% | Higher recycling |
| Billing overhead | -30% | Ops saving |
What You See Is What You Get
Business Model Canvas
The Quest Resource Business Model Canvas shown here is the exact document you will receive after purchase, not a mockup or sample. This preview contains live content and layout as delivered, ready for editing and presentation. Upon purchase you’ll instantly download the complete, fully editable file in the same format.
Original: $10.00
-65%$10.00
$3.50Description
Ready-to-Use Business Model Canvas Template for Investors and Founders
Unlock the full strategic blueprint behind Quest Resource with our in-depth Business Model Canvas—three to five actionable sections reveal value propositions, revenue streams, and key partnerships that drive growth. Ideal for investors, consultants, and founders seeking a ready-to-use template in Word and Excel, this download accelerates strategic planning and competitive analysis—get the complete canvas to benchmark and scale confidently.
Partnerships
Haulers and recycling facility networks
Partnerships with regional and national haulers ensure reliable pickup, transport, and processing of diverse waste streams, leveraging networks that cover local and interstate routes. Recycling facilities provide capacity for paper, plastics, metals, organics and e-waste; U.S. municipal solid waste recycling rate was 32.1% in 2018 (EPA). Contracted throughput and SLAs stabilize service quality and pricing, enabling multi-site scalability for enterprise clients.
Technology and data platform providers
Software partners support routing, tracking, compliance documentation and analytics. IoT sensors and telematics vendors enable container monitoring and diversion measurement. Integrations with client ERP and ESG systems streamline reporting; 90% of S&P 500 published sustainability reports in 2023, driving demand for automated ESG data. These alliances power data-driven optimization and sustainability scorecards.
Commodity brokers and end-market buyers
Relationships with commodity brokers and end-market buyers create reliable outlets for recyclables and byproducts, tapping a recycled plastics market that reached roughly 50 billion USD in 2024. Broker agreements help manage price volatility and logistics through pooled contracts and hedging mechanisms. Guaranteed offtake supports client revenue-sharing models by locking baseline volumes and cashflows. This buyer-broker network underpins measurable circular economy outcomes.
Equipment suppliers and maintenance firms
Equipment vendors supplying compactors, balers and optical sorters drive on-site efficiency—balers and compactors can reduce waste volume by 70–90%—while leasing and maintenance partners lower upfront capex and cut downtime, supporting industry-standard uptime targets above 95%. Standardized specs improve safety and performance across client sites and enable rapid deployment of tailored waste systems.
- Reduced volume: 70–90%
- Uptime target: >95%
- Lower capex via leasing
- Faster deployment, consistent safety
Regulatory, certification, and ESG partners
Alliances with environmental consultants and auditors ensure Quest meets federal, state, and local rules, reducing client regulatory risk and operational interruptions; GRI reported over 12,000 organizations using its standards by 2024, boosting disclosure alignment.
Partnerships with certification bodies support zero-waste and landfill diversion goals, enabling clients to pursue TRUE or Zero Waste certifications and improve diversion rates reported in audits.
Integration with ESG frameworks and disclosure platforms enhances reporting credibility and investor confidence, aligning clients with growing 2024 demand for standardized sustainability data.
- Regulatory compliance: reduced enforcement exposure
- Certifications: TRUE/Zero Waste pathways
- ESG disclosure: GRI usage 12,000+ (2024)
Partners stabilize recycled plastics pricing and volumes in ~50B market
Strategic hauler, recycler, broker, equipment and ESG partners secure pickup, processing and offtake, stabilizing volumes and pricing; recycled plastics market ≈50B USD (2024). Tech and IoT partners enable routing, diversion measurement and ERP/ESG integration; GRI used by 12,000+ orgs (2024). Equipment and maintenance alliances cut volume 70–90% and target uptime >95%, enabling rapid, scalable deployments.
| Metric | Value |
|---|---|
| Recycled plastics market (2024) | ~50B USD |
| GRI users (2024) | 12,000+ |
| Volume reduction | 70–90% |
| Uptime target | >95% |
What is included in the product
Detailed Word Document
A comprehensive Business Model Canvas for Quest Resource that maps nine BMC blocks—customer segments, value propositions, channels, revenue streams, key resources, activities, partners, cost structure, and customer relationships—providing strategic insights, SWOT-linked analysis, and investor-ready narrative to support presentations and validation of operational plans.
Customizable Excel Spreadsheet
High-level view of Quest Resource’s business model with editable cells — condenses strategy into a clean one-page snapshot for fast boardroom review and team collaboration, saving hours of formatting while easing comparisons across scenarios.
Activities
Multi-stream waste and recycling program design
Assess client sites to map waste generation and material flows, using audits and bin counts to quantify streams; configure segregation, containerization and pickup schedules to optimize routes and reduce hauling costs. Tailor programs by industry and local infrastructure; set KPIs for cost per ton, diversion rate (50%+ targets common in 2024) and regulatory compliance.
Logistics orchestration and vendor management
Dispatch haulers, manage service frequencies and resolve exceptions across regions to sustain SLA performance near 98% on-time in 2024. Negotiate regional rates targeting 8–12% cost savings while monitoring SLAs and vendor KPIs. Consolidate invoicing and rebates to cut billing overhead roughly 30%, simplifying client operations. Optimize routes with real-time tools to reduce emissions up to 15% and lower transport costs about 10%.
Materials recovery and circular solutions
Identify reuse, refurbishment and recycling streams prioritizing high-value flows and repairable goods; EU targets 55% municipal recycling by 2025, sharpening opportunities for reverse logistics. Implement take-back and reverse logistics programs to recover materials—US MSW recycling was 32% (EPA 2020). Develop outlets for organics, cooking oil, textiles and specialty streams; only about 1% of clothing is recycled into new garments (Ellen MacArthur). Convert waste to value where feasible through feedstock, compost and biofuel pathways.
Compliance, reporting, and ESG analytics
Maintain comprehensive documentation for permits, manifests, and audits, producing site and enterprise-level diversion and emissions reports that align with ISSB/TCFD frameworks and regulatory requirements in 2024. Outputs map to client ESG frameworks and feed analytics that quantify diversion and CO2e trends to guide continuous improvement across operations. Insights prioritize corrective actions, cost reductions, and compliance risk mitigation.
- Documentation: permits, manifests, audit trails
- Reporting: site + enterprise diversion and emissions
- Standards: ISSB, TCFD alignment
- Outcomes: analytics-driven continuous improvement
Client support, education, and change management
Train staff on segregation and contamination reduction; 2024 programs report average contamination declines of 28% and diversion gains of 15–25% after targeted training. Roll out clear signage and engagement campaigns that lifted participation by 22% in 2024 pilots. Deliver multi-site onboarding and ongoing support to scale across dozens of locations while iterating programs using feedback and performance data.
- Train staff: 28% contamination reduction (2024)
- Signage & campaigns: +22% participation (2024)
- Multi-site onboarding: scalable ongoing support
- Iterate: data-driven adjustments from KPIs & feedback
50%+ diversion, 98% on-time, -28% contamination
Conduct site audits and route-optimized pickup schedules to hit 50%+ diversion targets (2024); sustain ~98% on-time SLA and negotiate 8–12% hauling savings. Run training to cut contamination ~28% and deploy reverse logistics for high-value streams. Centralize billing to reduce overhead ~30% while reporting to ISSB/TCFD-aligned metrics.
| Metric | 2024 Benchmark | Impact |
|---|---|---|
| Diversion rate | 50%+ | Waste reduction |
| On-time SLA | 98% | Service reliability |
| Contamination | -28% | Higher recycling |
| Billing overhead | -30% | Ops saving |
What You See Is What You Get
Business Model Canvas
The Quest Resource Business Model Canvas shown here is the exact document you will receive after purchase, not a mockup or sample. This preview contains live content and layout as delivered, ready for editing and presentation. Upon purchase you’ll instantly download the complete, fully editable file in the same format.











