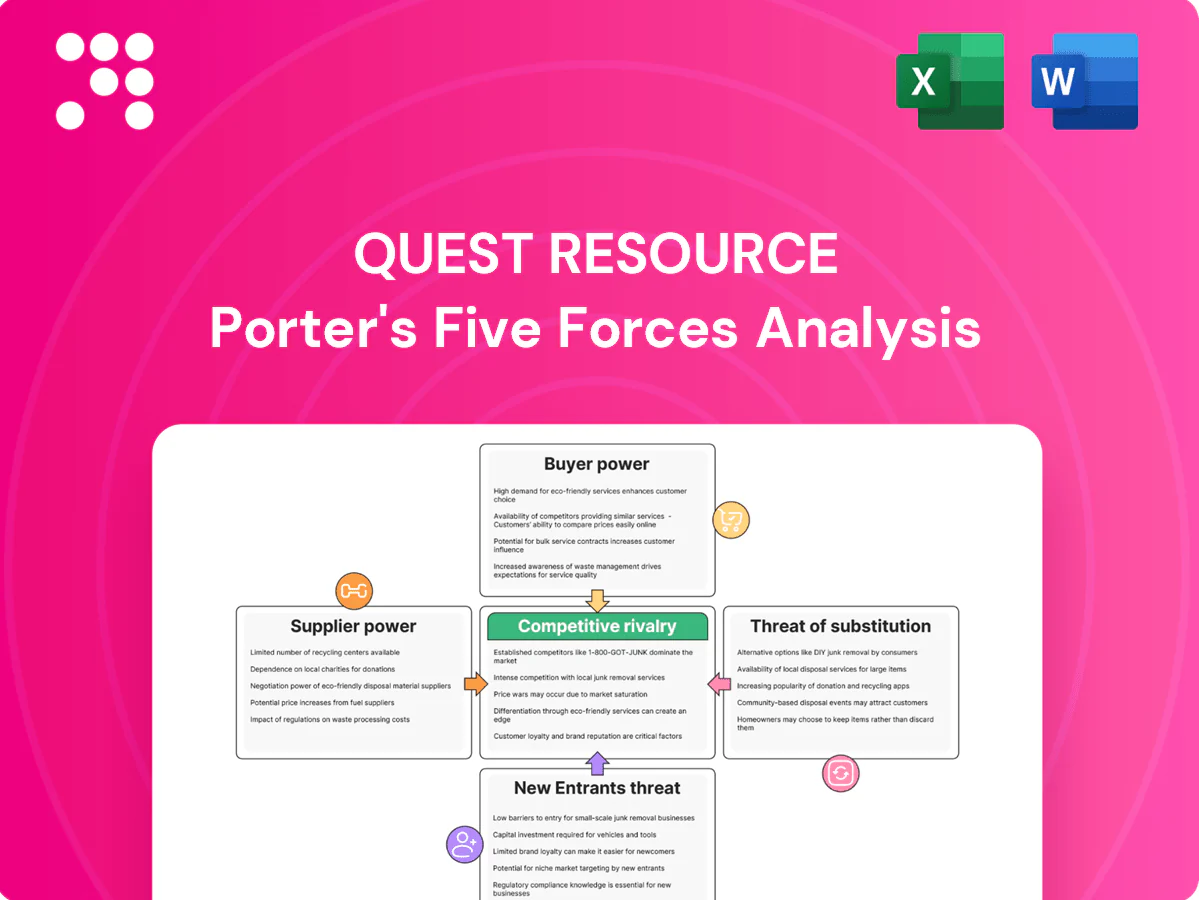
Quest Resource Porter's Five Forces Analysis

From Overview to Strategy Blueprint
Quest Resource’s Porter's Five Forces snapshot highlights supplier power, buyer pressure, competitor rivalry, threat of entrants and substitutes to reveal key strategic tensions. It surfaces competitive strengths and vulnerabilities. For actionable ratings, visuals and force-by-force implications, purchase the full analysis. Gain a consultant-grade framework to guide investment and strategy decisions.
Suppliers Bargaining Power

Regional processor concentration
Regional concentration of recycling processors, MRFs and landfill operators limits outlets for specific waste streams, enabling higher tipping and processing fees; U.S. average landfill tipping fees hovered around $54–$60 per ton in 2024, pressuring margins for collectors like Quest.
Multi-sourcing across regions can blunt supplier power, but specialty streams (e.g., mixed plastics, e-waste) still face sparse capacity and premium fees.
Tight markets during commodity downturns in 2023–24 amplified supplier leverage, with transaction-based processing spreads widening and spot acceptance windows shortening.
Specialized treatment capacity
Specialized treatment capacity for hazardous, organic and e-waste is concentrated in scarce, permitted facilities, and with global e-waste at about 59 million tonnes in 2023 (Global E-waste Monitor 2024) suppliers gain leverage. Permitting and compliance slow capacity growth, so Quest’s volume aggregation can secure allocations, though suppliers may favor higher‑margin feedstock. Long‑term offtake agreements stabilize access and pricing.

Logistics and hauling dependencies
Local haulers' control of route density and on-time performance directly affects Quest's costs and service levels; industry estimates put the 2024 driver shortfall at roughly 60,000–80,000, strengthening hauler pricing power. Fuel, labor and equipment constraints amplify that power, especially in peak months when spot rates jump. Quest mitigates risk by balancing carriers, enforcing SLA penalties and using route-optimization KPIs and software.

Commodity price volatility
Recovered material pricing (OCC, plastics, metals) remained highly cyclical in 2024, with industry indices exhibiting roughly 25–35% intra-year swings, driving processors to tighten terms and cut rebates. When prices fell processors pushed lower rebates or imposed higher contamination fees, pressuring margins. Quest’s hedging, strict quality control and diversified end‑markets dampen volatility, while index‑linked contracts shift price risk but limit upside.
- Recovered materials: 25–35% intra-year swings (2024)
- Processor response: lower rebates, higher contamination fees
- Quest mitigants: hedging, QC, diversified end‑markets
- Index-linked contracts: risk-sharing with capped upside
Technology and equipment vendors
Technology vendors for balers, compactors, sensors and software exert power through proprietary systems and maintenance contracts; 2024 industry reports show service contracts commonly cost 5–10% of equipment value per year and vendor-led downtime risks can exceed thousands of dollars per hour for high-throughput facilities. Quest can standardize specs, pursue vendor-neutral solutions and trade price for reliability via multi-year service agreements.
- Vendor lock-in: proprietary systems
- Maintenance: 5–10% of equipment value/year (2024)
- Risk: downtime costs high for throughput sites
- Mitigation: standard specs, vendor-neutral procurements
- Trade-off: multi-year agreements = price for reliability
Processor concentration tightens margins; tipping fees $54–60/ton
Regional concentration of processors and MRFs gives suppliers leverage; U.S. landfill tipping fees averaged $54–$60/ton in 2024, squeezing collector margins. Specialty streams (e‑waste 59M t in 2023) and driver shortfalls (~60k–80k in 2024) raise prices and reduce capacity. Recovered-material indices swung 25–35% in 2024; service contracts cost 5–10% of equipment value/year.
| Metric | 2023–24 Data |
|---|---|
| Landfill tipping fee (US avg) | $54–$60/ton (2024) |
| E‑waste volume | 59M tonnes (2023) |
| Driver shortfall | 60k–80k (2024) |
| Recovered-material volatility | 25–35% intra‑year (2024) |
| Equipment service cost | 5–10% of value/year (2024) |
What is included in the product
 Detailed Word Document
Comprehensive Porter’s Five Forces analysis tailored to Quest Resource, uncovering competitive drivers, supplier and buyer power, substitutes and entry risks, identifying disruptive threats and strategic levers; fully editable for reports and investor decks.

 Customizable Excel Spreadsheet
A concise one-sheet Porter's Five Forces tool that turns complex competitive analysis into actionable insights—customize pressure levels, swap in your data, and generate clean visual outputs to relieve strategic decision-making pain points.
Customers Bargaining Power

Large multi-site enterprises
Large multi-site enterprises—national retailers, QSRs, auto and industrial chains—consolidate spend and run competitive RFPs, using scale and benchmarking to drive price pressure and strict SLAs; US retail and foodservice sales exceeded $7 trillion (2023 Census), highlighting buyer clout into 2024. Quest must differentiate via robust data, ESG reporting and diversion outcomes; multi-site rollouts and systems integration create moderate switching costs.
Price sensitivity and budget cycles
Waste is often treated as a cost center, driving strong price sensitivity and prompting 18–24 month rebids during budget reviews; 2024 procurement surveys show over 60% of organizations increase KPI scrutiny at renewal. Quest can offset this by quantifying total cost of ownership and landfill-avoidance savings—clients report diversion savings up to 20% of waste spend. Shared-savings models align incentives but can compress Quest margins by 10–30% if targets are met early.

Availability of alternatives
Customers can contract directly with haulers, use national integrators, or bring services in-house, and with the global 3PL market at about $1.1 trillion in 2024 (Armstrong & Associates) this array materially boosts customer bargaining power. Quest must offer superior orchestration, compliance, and analytics to justify fees. Referenceable outcomes and guarantees—case studies commonly showing 5–12% logistics cost reduction—help defend value.

Data and reporting expectations
Buyers increasingly demand granular ESG data, immutable audit trails and documented regulatory compliance, pushing Quest Resource to add data lineage and verification layers; by 2024 over 90% of large public firms provide sustainability disclosures, raising baseline expectations. Meeting these needs raises service complexity and perceived value, but buyers can leverage high expectations to negotiate price concessions. Deep integrations and workflow stickiness reduce buyer churn and temper bargaining power over time.
- ESG disclosure prevalence: >90% of large public firms (2024)
- Value impact: richer data raises ASP and renewal NRR
- Leverage: high expectations enable price concessions
- Retention: integrations increase platform stickiness, lowering buyer power
Contract terms and switching costs
Multi-year contracts (typically 2–5 years, average ~36 months in 2024) with performance clauses stabilize pricing but create periodic renegotiation points that can reset margins each cycle. Integration with store ops, training (8–16 hours per site) and equipment deployment raises switching costs modestly, often a one-time $1k–$5k per site. Transition to rivals remains feasible with planning; auto-renewals and phased transitions cut churn risk.
- contract length: 2–5 years (avg ~36 months in 2024)
- training: 8–16 hours/site
- equipment cost: ~$1k–$5k per site
- auto-renewals reduce near-term churn
Buyers pressure prices: US sales $7T+, 18-24m rebids, KPI scrutiny >60%
Large multi-site buyers exert strong price pressure—US retail/foodservice sales >$7T (2023)—and run 18–24 month rebids with >60% increasing KPI scrutiny (2024). ESG/data demands are rising (>90% large public firms disclose, 2024), raising service complexity but enabling value-based pricing; average contract ~36 months so switching costs are moderate.
| Metric | 2024 Value |
|---|---|
| Retail/foodservice sales | $7T+ |
| Procurement KPI scrutiny | >60% |
| ESG disclosures (large firms) | >90% |
| Avg contract length | ~36 months |
Preview Before You Purchase
Quest Resource Porter's Five Forces Analysis
This preview displays the complete Quest Resource Porter’s Five Forces analysis you’ll receive after purchase—no placeholders or samples. It’s the final, professionally formatted document ready for immediate download and use the moment your payment is processed. What you see is what you get.

From Overview to Strategy Blueprint
Quest Resource’s Porter's Five Forces snapshot highlights supplier power, buyer pressure, competitor rivalry, threat of entrants and substitutes to reveal key strategic tensions. It surfaces competitive strengths and vulnerabilities. For actionable ratings, visuals and force-by-force implications, purchase the full analysis. Gain a consultant-grade framework to guide investment and strategy decisions.
Suppliers Bargaining Power
Regional processor concentration
Regional concentration of recycling processors, MRFs and landfill operators limits outlets for specific waste streams, enabling higher tipping and processing fees; U.S. average landfill tipping fees hovered around $54–$60 per ton in 2024, pressuring margins for collectors like Quest.
Multi-sourcing across regions can blunt supplier power, but specialty streams (e.g., mixed plastics, e-waste) still face sparse capacity and premium fees.
Tight markets during commodity downturns in 2023–24 amplified supplier leverage, with transaction-based processing spreads widening and spot acceptance windows shortening.
Specialized treatment capacity
Specialized treatment capacity for hazardous, organic and e-waste is concentrated in scarce, permitted facilities, and with global e-waste at about 59 million tonnes in 2023 (Global E-waste Monitor 2024) suppliers gain leverage. Permitting and compliance slow capacity growth, so Quest’s volume aggregation can secure allocations, though suppliers may favor higher‑margin feedstock. Long‑term offtake agreements stabilize access and pricing.
Logistics and hauling dependencies
Local haulers' control of route density and on-time performance directly affects Quest's costs and service levels; industry estimates put the 2024 driver shortfall at roughly 60,000–80,000, strengthening hauler pricing power. Fuel, labor and equipment constraints amplify that power, especially in peak months when spot rates jump. Quest mitigates risk by balancing carriers, enforcing SLA penalties and using route-optimization KPIs and software.
Commodity price volatility
Recovered material pricing (OCC, plastics, metals) remained highly cyclical in 2024, with industry indices exhibiting roughly 25–35% intra-year swings, driving processors to tighten terms and cut rebates. When prices fell processors pushed lower rebates or imposed higher contamination fees, pressuring margins. Quest’s hedging, strict quality control and diversified end‑markets dampen volatility, while index‑linked contracts shift price risk but limit upside.
- Recovered materials: 25–35% intra-year swings (2024)
- Processor response: lower rebates, higher contamination fees
- Quest mitigants: hedging, QC, diversified end‑markets
- Index-linked contracts: risk-sharing with capped upside
Technology and equipment vendors
Technology vendors for balers, compactors, sensors and software exert power through proprietary systems and maintenance contracts; 2024 industry reports show service contracts commonly cost 5–10% of equipment value per year and vendor-led downtime risks can exceed thousands of dollars per hour for high-throughput facilities. Quest can standardize specs, pursue vendor-neutral solutions and trade price for reliability via multi-year service agreements.
- Vendor lock-in: proprietary systems
- Maintenance: 5–10% of equipment value/year (2024)
- Risk: downtime costs high for throughput sites
- Mitigation: standard specs, vendor-neutral procurements
- Trade-off: multi-year agreements = price for reliability
Processor concentration tightens margins; tipping fees $54–60/ton
Regional concentration of processors and MRFs gives suppliers leverage; U.S. landfill tipping fees averaged $54–$60/ton in 2024, squeezing collector margins. Specialty streams (e‑waste 59M t in 2023) and driver shortfalls (~60k–80k in 2024) raise prices and reduce capacity. Recovered-material indices swung 25–35% in 2024; service contracts cost 5–10% of equipment value/year.
| Metric | 2023–24 Data |
|---|---|
| Landfill tipping fee (US avg) | $54–$60/ton (2024) |
| E‑waste volume | 59M tonnes (2023) |
| Driver shortfall | 60k–80k (2024) |
| Recovered-material volatility | 25–35% intra‑year (2024) |
| Equipment service cost | 5–10% of value/year (2024) |
What is included in the product
Detailed Word Document
Comprehensive Porter’s Five Forces analysis tailored to Quest Resource, uncovering competitive drivers, supplier and buyer power, substitutes and entry risks, identifying disruptive threats and strategic levers; fully editable for reports and investor decks.
Customizable Excel Spreadsheet
A concise one-sheet Porter's Five Forces tool that turns complex competitive analysis into actionable insights—customize pressure levels, swap in your data, and generate clean visual outputs to relieve strategic decision-making pain points.
Customers Bargaining Power
Large multi-site enterprises
Large multi-site enterprises—national retailers, QSRs, auto and industrial chains—consolidate spend and run competitive RFPs, using scale and benchmarking to drive price pressure and strict SLAs; US retail and foodservice sales exceeded $7 trillion (2023 Census), highlighting buyer clout into 2024. Quest must differentiate via robust data, ESG reporting and diversion outcomes; multi-site rollouts and systems integration create moderate switching costs.
Price sensitivity and budget cycles
Waste is often treated as a cost center, driving strong price sensitivity and prompting 18–24 month rebids during budget reviews; 2024 procurement surveys show over 60% of organizations increase KPI scrutiny at renewal. Quest can offset this by quantifying total cost of ownership and landfill-avoidance savings—clients report diversion savings up to 20% of waste spend. Shared-savings models align incentives but can compress Quest margins by 10–30% if targets are met early.
Availability of alternatives
Customers can contract directly with haulers, use national integrators, or bring services in-house, and with the global 3PL market at about $1.1 trillion in 2024 (Armstrong & Associates) this array materially boosts customer bargaining power. Quest must offer superior orchestration, compliance, and analytics to justify fees. Referenceable outcomes and guarantees—case studies commonly showing 5–12% logistics cost reduction—help defend value.
Data and reporting expectations
Buyers increasingly demand granular ESG data, immutable audit trails and documented regulatory compliance, pushing Quest Resource to add data lineage and verification layers; by 2024 over 90% of large public firms provide sustainability disclosures, raising baseline expectations. Meeting these needs raises service complexity and perceived value, but buyers can leverage high expectations to negotiate price concessions. Deep integrations and workflow stickiness reduce buyer churn and temper bargaining power over time.
- ESG disclosure prevalence: >90% of large public firms (2024)
- Value impact: richer data raises ASP and renewal NRR
- Leverage: high expectations enable price concessions
- Retention: integrations increase platform stickiness, lowering buyer power
Contract terms and switching costs
Multi-year contracts (typically 2–5 years, average ~36 months in 2024) with performance clauses stabilize pricing but create periodic renegotiation points that can reset margins each cycle. Integration with store ops, training (8–16 hours per site) and equipment deployment raises switching costs modestly, often a one-time $1k–$5k per site. Transition to rivals remains feasible with planning; auto-renewals and phased transitions cut churn risk.
- contract length: 2–5 years (avg ~36 months in 2024)
- training: 8–16 hours/site
- equipment cost: ~$1k–$5k per site
- auto-renewals reduce near-term churn
Buyers pressure prices: US sales $7T+, 18-24m rebids, KPI scrutiny >60%
Large multi-site buyers exert strong price pressure—US retail/foodservice sales >$7T (2023)—and run 18–24 month rebids with >60% increasing KPI scrutiny (2024). ESG/data demands are rising (>90% large public firms disclose, 2024), raising service complexity but enabling value-based pricing; average contract ~36 months so switching costs are moderate.
| Metric | 2024 Value |
|---|---|
| Retail/foodservice sales | $7T+ |
| Procurement KPI scrutiny | >60% |
| ESG disclosures (large firms) | >90% |
| Avg contract length | ~36 months |
Preview Before You Purchase
Quest Resource Porter's Five Forces Analysis
This preview displays the complete Quest Resource Porter’s Five Forces analysis you’ll receive after purchase—no placeholders or samples. It’s the final, professionally formatted document ready for immediate download and use the moment your payment is processed. What you see is what you get.
Original: $10.00
-65%$10.00
$3.50Description
From Overview to Strategy Blueprint
Quest Resource’s Porter's Five Forces snapshot highlights supplier power, buyer pressure, competitor rivalry, threat of entrants and substitutes to reveal key strategic tensions. It surfaces competitive strengths and vulnerabilities. For actionable ratings, visuals and force-by-force implications, purchase the full analysis. Gain a consultant-grade framework to guide investment and strategy decisions.
Suppliers Bargaining Power
Regional processor concentration
Regional concentration of recycling processors, MRFs and landfill operators limits outlets for specific waste streams, enabling higher tipping and processing fees; U.S. average landfill tipping fees hovered around $54–$60 per ton in 2024, pressuring margins for collectors like Quest.
Multi-sourcing across regions can blunt supplier power, but specialty streams (e.g., mixed plastics, e-waste) still face sparse capacity and premium fees.
Tight markets during commodity downturns in 2023–24 amplified supplier leverage, with transaction-based processing spreads widening and spot acceptance windows shortening.
Specialized treatment capacity
Specialized treatment capacity for hazardous, organic and e-waste is concentrated in scarce, permitted facilities, and with global e-waste at about 59 million tonnes in 2023 (Global E-waste Monitor 2024) suppliers gain leverage. Permitting and compliance slow capacity growth, so Quest’s volume aggregation can secure allocations, though suppliers may favor higher‑margin feedstock. Long‑term offtake agreements stabilize access and pricing.
Logistics and hauling dependencies
Local haulers' control of route density and on-time performance directly affects Quest's costs and service levels; industry estimates put the 2024 driver shortfall at roughly 60,000–80,000, strengthening hauler pricing power. Fuel, labor and equipment constraints amplify that power, especially in peak months when spot rates jump. Quest mitigates risk by balancing carriers, enforcing SLA penalties and using route-optimization KPIs and software.
Commodity price volatility
Recovered material pricing (OCC, plastics, metals) remained highly cyclical in 2024, with industry indices exhibiting roughly 25–35% intra-year swings, driving processors to tighten terms and cut rebates. When prices fell processors pushed lower rebates or imposed higher contamination fees, pressuring margins. Quest’s hedging, strict quality control and diversified end‑markets dampen volatility, while index‑linked contracts shift price risk but limit upside.
- Recovered materials: 25–35% intra-year swings (2024)
- Processor response: lower rebates, higher contamination fees
- Quest mitigants: hedging, QC, diversified end‑markets
- Index-linked contracts: risk-sharing with capped upside
Technology and equipment vendors
Technology vendors for balers, compactors, sensors and software exert power through proprietary systems and maintenance contracts; 2024 industry reports show service contracts commonly cost 5–10% of equipment value per year and vendor-led downtime risks can exceed thousands of dollars per hour for high-throughput facilities. Quest can standardize specs, pursue vendor-neutral solutions and trade price for reliability via multi-year service agreements.
- Vendor lock-in: proprietary systems
- Maintenance: 5–10% of equipment value/year (2024)
- Risk: downtime costs high for throughput sites
- Mitigation: standard specs, vendor-neutral procurements
- Trade-off: multi-year agreements = price for reliability
Processor concentration tightens margins; tipping fees $54–60/ton
Regional concentration of processors and MRFs gives suppliers leverage; U.S. landfill tipping fees averaged $54–$60/ton in 2024, squeezing collector margins. Specialty streams (e‑waste 59M t in 2023) and driver shortfalls (~60k–80k in 2024) raise prices and reduce capacity. Recovered-material indices swung 25–35% in 2024; service contracts cost 5–10% of equipment value/year.
| Metric | 2023–24 Data |
|---|---|
| Landfill tipping fee (US avg) | $54–$60/ton (2024) |
| E‑waste volume | 59M tonnes (2023) |
| Driver shortfall | 60k–80k (2024) |
| Recovered-material volatility | 25–35% intra‑year (2024) |
| Equipment service cost | 5–10% of value/year (2024) |
What is included in the product
Detailed Word Document
Comprehensive Porter’s Five Forces analysis tailored to Quest Resource, uncovering competitive drivers, supplier and buyer power, substitutes and entry risks, identifying disruptive threats and strategic levers; fully editable for reports and investor decks.
Customizable Excel Spreadsheet
A concise one-sheet Porter's Five Forces tool that turns complex competitive analysis into actionable insights—customize pressure levels, swap in your data, and generate clean visual outputs to relieve strategic decision-making pain points.
Customers Bargaining Power
Large multi-site enterprises
Large multi-site enterprises—national retailers, QSRs, auto and industrial chains—consolidate spend and run competitive RFPs, using scale and benchmarking to drive price pressure and strict SLAs; US retail and foodservice sales exceeded $7 trillion (2023 Census), highlighting buyer clout into 2024. Quest must differentiate via robust data, ESG reporting and diversion outcomes; multi-site rollouts and systems integration create moderate switching costs.
Price sensitivity and budget cycles
Waste is often treated as a cost center, driving strong price sensitivity and prompting 18–24 month rebids during budget reviews; 2024 procurement surveys show over 60% of organizations increase KPI scrutiny at renewal. Quest can offset this by quantifying total cost of ownership and landfill-avoidance savings—clients report diversion savings up to 20% of waste spend. Shared-savings models align incentives but can compress Quest margins by 10–30% if targets are met early.
Availability of alternatives
Customers can contract directly with haulers, use national integrators, or bring services in-house, and with the global 3PL market at about $1.1 trillion in 2024 (Armstrong & Associates) this array materially boosts customer bargaining power. Quest must offer superior orchestration, compliance, and analytics to justify fees. Referenceable outcomes and guarantees—case studies commonly showing 5–12% logistics cost reduction—help defend value.
Data and reporting expectations
Buyers increasingly demand granular ESG data, immutable audit trails and documented regulatory compliance, pushing Quest Resource to add data lineage and verification layers; by 2024 over 90% of large public firms provide sustainability disclosures, raising baseline expectations. Meeting these needs raises service complexity and perceived value, but buyers can leverage high expectations to negotiate price concessions. Deep integrations and workflow stickiness reduce buyer churn and temper bargaining power over time.
- ESG disclosure prevalence: >90% of large public firms (2024)
- Value impact: richer data raises ASP and renewal NRR
- Leverage: high expectations enable price concessions
- Retention: integrations increase platform stickiness, lowering buyer power
Contract terms and switching costs
Multi-year contracts (typically 2–5 years, average ~36 months in 2024) with performance clauses stabilize pricing but create periodic renegotiation points that can reset margins each cycle. Integration with store ops, training (8–16 hours per site) and equipment deployment raises switching costs modestly, often a one-time $1k–$5k per site. Transition to rivals remains feasible with planning; auto-renewals and phased transitions cut churn risk.
- contract length: 2–5 years (avg ~36 months in 2024)
- training: 8–16 hours/site
- equipment cost: ~$1k–$5k per site
- auto-renewals reduce near-term churn
Buyers pressure prices: US sales $7T+, 18-24m rebids, KPI scrutiny >60%
Large multi-site buyers exert strong price pressure—US retail/foodservice sales >$7T (2023)—and run 18–24 month rebids with >60% increasing KPI scrutiny (2024). ESG/data demands are rising (>90% large public firms disclose, 2024), raising service complexity but enabling value-based pricing; average contract ~36 months so switching costs are moderate.
| Metric | 2024 Value |
|---|---|
| Retail/foodservice sales | $7T+ |
| Procurement KPI scrutiny | >60% |
| ESG disclosures (large firms) | >90% |
| Avg contract length | ~36 months |
Preview Before You Purchase
Quest Resource Porter's Five Forces Analysis
This preview displays the complete Quest Resource Porter’s Five Forces analysis you’ll receive after purchase—no placeholders or samples. It’s the final, professionally formatted document ready for immediate download and use the moment your payment is processed. What you see is what you get.











