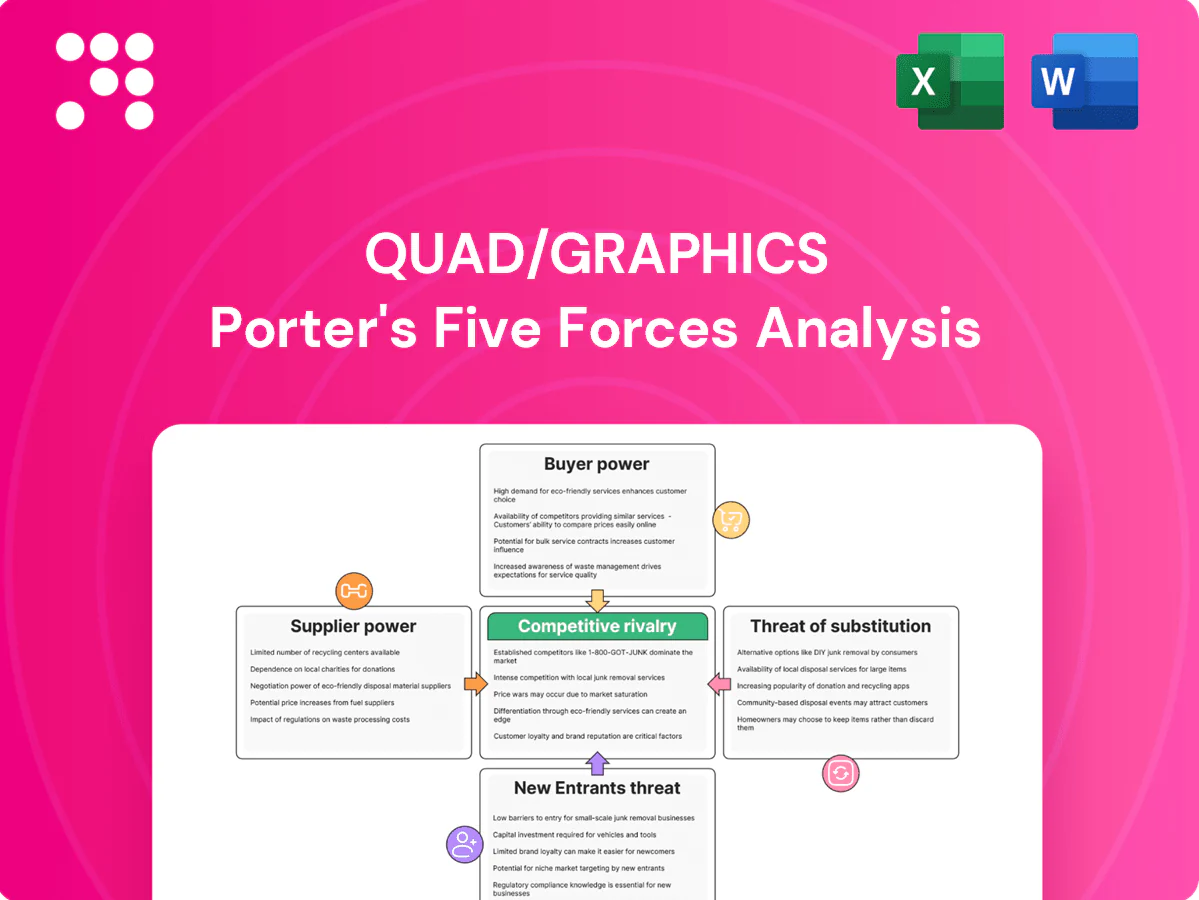
Quad/Graphics Porter's Five Forces Analysis

A Must-Have Tool for Decision-Makers
Quad/Graphics faces moderate buyer power, margin pressure from digital substitutes, and concentrated supplier relationships that shape pricing and service dynamics. New entrants pose limited short-term threat due to scale and capital needs, while rivalry among incumbents and tech-driven substitution elevate competitive intensity. This brief snapshot only scratches the surface. Unlock the full Porter's Five Forces Analysis to explore Quad/Graphics’s competitive dynamics and strategic implications in detail.
Suppliers Bargaining Power

Concentrated paper and ink inputs
Paper mills and specialty-ink producers remain relatively concentrated, giving suppliers pricing leverage during tight fiber or petrochemical cycles; 2024 industry reports noted pulp inventories at multi-year lows, intensifying upward pressure on paper costs. Input price volatility can compress Quad/Graphics margins unless hedged or passed through to clients. Long-term contracts and diversified sourcing have partially mitigated supplier power. Sustainability certifications further restrict interchangeable supply by narrowing eligible mills and inks.
Postal and logistics dependencies
Mailing services bind Quad to postal rates and carrier delivery standards, with the USPS reporting about $77.9 billion in operating revenue in FY2023, highlighting its market influence. Fuel surcharges and capacity constraints — which spiked logistics costs during 2022–24 — can shift costs upward. Co-mailing and logistics optimization reduce exposure but do not eliminate supplier power. Geographic dispersion of facilities helps balance regional disruptions.

Martech and data platform partners
Reliance on third-party adtech, CDPs and cloud providers creates switching frictions and integration costs. Global cloud infrastructure spend rose ~28% to $223B in 2024, concentrating power among major providers (AWS ~33%, Azure ~22%, Google Cloud ~12%). Vendors with unique capabilities or scale can exert pricing power while open architectures and multi-vendor stacks dilute individual supplier leverage. API changes and policy shifts pose material operational risk.

Specialized equipment OEMs
Presses, finishing and workflow systems are capital intensive (new press capex often exceeds $1M) and sourced from a small set of OEMs, giving suppliers elevated bargaining power; spare parts and maintenance lock-in raise lifetime supplier leverage, while SLAs and available second-source retrofit options mitigate downtime risk; long depreciation cycles discourage frequent equipment swapping.
- High capex: >$1M per press
- Supplier concentration: few OEMs
- Lock-in: spare parts & maintenance
- Mitigants: SLAs, second-source retrofits
- Constraint: long depreciation cycles
Creative and tech talent markets
Creative and tech talent markets raise supplier power: tight hiring pushed 2024 median US pay to about $110,000 for software engineers, ~$120,000 for data scientists and ~$75,000 for UX/UI designers, increasing wage pressure. Freelance networks provide flexible capacity but remain rate-sensitive. Quad/Graphics mitigates risk with proprietary playbooks, internal training and global delivery centers that diversify talent sources.
- High wages: software ~$110k; data science ~$120k; design ~$75k (2024)
- Freelance flexibility vs rate sensitivity
- Training and playbooks lower single-supplier dependence
- Global centers expand talent pool
Suppliers tighten margins: pulp squeeze, logistics shocks, cloud lock-in, wage inflation
Suppliers exert moderate-to-high power: concentrated paper/ink markets tightened in 2024 (pulp inventories multi-year lows), risking margin compression; logistics (USPS $77.9B FY2023) and 2022–24 fuel/capacity spikes raised costs. OEMs (press capex >$1M) and cloud providers (cloud spend $223B 2024; AWS 33%, Azure 22%, GCP 12%) create switching frictions; talent wage inflation (SW ~$110k, DS ~$120k, UX ~$75k) adds pressure.
| Supplier | 2024 metric | Impact |
|---|---|---|
| Paper/Ink | pulp inventories low | ↑ input costs |
| Logistics | USPS $77.9B FY23 | rate exposure |
| Cloud | $223B spend; AWS33% | switching friction |
| Equipment | press capex >$1M | lock-in |
| Talent | SW $110k; DS $120k | wage pressure |
What is included in the product
 Detailed Word Document
Uncovers key competitive drivers, supplier and buyer power, threat of new entrants and substitutes, and rivalry specific to Quad/Graphics, highlighting pricing and margin pressures and strategic levers. Identifies disruptive threats and entry barriers with actionable insights for investors and management.

 Customizable Excel Spreadsheet
A single-sheet Porter's Five Forces for Quad/Graphics that maps competitive pressures and actionable relief strategies—perfect for quick decision-making, slide-ready sharing, and easy customization without macros.
Customers Bargaining Power

Large enterprise clients
Large enterprise clients wield scale, procurement sophistication and alternatives, securing volume-based discounts typically in the 5–20% range and driving intense price pressure; in 2024 major brands represent the majority (>50%) of Quad's book of business. Multi-year MSAs temper churn but embed scheduled pricing reviews and performance gates tied to SLAs. Consolidating spend across print, media and digital can exchange scope for 10–25% better rates, while outcome-based KPIs sharpen accountability and penalties.
RFP-driven pricing pressure
RFP-driven bids in commercial print benchmark price and service tightly, often compressing margins by 100–300 basis points as buyers leverage industry scale (US printing industry revenue ~60 billion in 2024). Incumbency reduces but does not stop rebids; demonstrable ROI and speed-to-market justify 5–20% premiums. Case studies and pilots, which can lift win rates by mid-teens, are pivotal to defend pricing.

Moderate switching costs
Integrated workflows, data integrations, and co-created content create strong client stickiness by embedding Quad/Graphics into marketing and supply-chain processes. Standardization of many services, however, enables clients to partially switch or multi-source specific functions, reducing full-vendor dependence. Transition costs and learning curves slow complete vendor replacement, preserving revenue. Many contracts include 30–90 day notice periods, giving time to respond to churn.

Demand cyclicality and budget shifts
Demand cyclicality forces Quad/Graphics to absorb marketing-budget swings as clients cut or expand print spends with macro cycles, pressuring volumes and product mix; buyers’ rapid reallocations to digital can reduce print capacity utilization sharply. Adaptive pricing, modular offerings and short-run capabilities help cushion variability while proactive planning and multi-quarter contracts lock in baseline volumes.
- Budget flexibility: clients shift spend between channels
- Utilization risk: rapid print-to-digital moves reduce run lengths
- Mitigants: adaptive pricing and modular services
- Strategy: forward bookings and baseline contracts
Customization expectations
Clients now demand deep personalization, omnichannel orchestration and rapid iteration—78% of B2B buyers in 2024 expect tailored solutions—driving higher service intensity and frequent scope creep that pressures margins.
Value-based packaging and clear SLAs (typical SLA uplifts ~12% on profitable accounts) preserve margin while robust data-security certifications (SOC 2/ISO 27001) are table stakes for enterprise buyers.
- Personalization demand: 78% (2024)
- Scope-creep pressure: higher service intensity
- Margin tool: value-based packaging, SLAs (~12% uplift)
- Security: SOC 2 / ISO 27001 required
Enterprise buyers (>50% book) force discounts 5-20% and compress margins 100-300 bps
Enterprise clients (>50% of 2024 book) secure volume discounts (5–20%) and drive 100–300 bps margin compression via RFPs; MSAs and SLAs (typical uplifts ~12%) moderate churn. Personalization demands (78% B2B 2024) raise service intensity and scope creep, while industry scale (US print ~$60B 2024) sustains buyer leverage.
| Metric | 2024 Value |
|---|---|
| Enterprise share | >50% |
| Discounts | 5–20% |
| Margin pressure | 100–300 bps |
| SLA uplift | ~12% |
| Personalization demand | 78% |
| US print market | $60B |
Same Document Delivered
Quad/Graphics Porter's Five Forces Analysis
This Quad/Graphics Porter's Five Forces Analysis preview is the exact document you’ll receive upon purchase—no samples, no placeholders. It is fully formatted, professionally written, and ready for immediate download and use once payment is complete. The file you see here is the final deliverable, containing the complete analysis and conclusions you can act on right away.

A Must-Have Tool for Decision-Makers
Quad/Graphics faces moderate buyer power, margin pressure from digital substitutes, and concentrated supplier relationships that shape pricing and service dynamics. New entrants pose limited short-term threat due to scale and capital needs, while rivalry among incumbents and tech-driven substitution elevate competitive intensity. This brief snapshot only scratches the surface. Unlock the full Porter's Five Forces Analysis to explore Quad/Graphics’s competitive dynamics and strategic implications in detail.
Suppliers Bargaining Power
Concentrated paper and ink inputs
Paper mills and specialty-ink producers remain relatively concentrated, giving suppliers pricing leverage during tight fiber or petrochemical cycles; 2024 industry reports noted pulp inventories at multi-year lows, intensifying upward pressure on paper costs. Input price volatility can compress Quad/Graphics margins unless hedged or passed through to clients. Long-term contracts and diversified sourcing have partially mitigated supplier power. Sustainability certifications further restrict interchangeable supply by narrowing eligible mills and inks.
Postal and logistics dependencies
Mailing services bind Quad to postal rates and carrier delivery standards, with the USPS reporting about $77.9 billion in operating revenue in FY2023, highlighting its market influence. Fuel surcharges and capacity constraints — which spiked logistics costs during 2022–24 — can shift costs upward. Co-mailing and logistics optimization reduce exposure but do not eliminate supplier power. Geographic dispersion of facilities helps balance regional disruptions.
Martech and data platform partners
Reliance on third-party adtech, CDPs and cloud providers creates switching frictions and integration costs. Global cloud infrastructure spend rose ~28% to $223B in 2024, concentrating power among major providers (AWS ~33%, Azure ~22%, Google Cloud ~12%). Vendors with unique capabilities or scale can exert pricing power while open architectures and multi-vendor stacks dilute individual supplier leverage. API changes and policy shifts pose material operational risk.
Specialized equipment OEMs
Presses, finishing and workflow systems are capital intensive (new press capex often exceeds $1M) and sourced from a small set of OEMs, giving suppliers elevated bargaining power; spare parts and maintenance lock-in raise lifetime supplier leverage, while SLAs and available second-source retrofit options mitigate downtime risk; long depreciation cycles discourage frequent equipment swapping.
- High capex: >$1M per press
- Supplier concentration: few OEMs
- Lock-in: spare parts & maintenance
- Mitigants: SLAs, second-source retrofits
- Constraint: long depreciation cycles
Creative and tech talent markets
Creative and tech talent markets raise supplier power: tight hiring pushed 2024 median US pay to about $110,000 for software engineers, ~$120,000 for data scientists and ~$75,000 for UX/UI designers, increasing wage pressure. Freelance networks provide flexible capacity but remain rate-sensitive. Quad/Graphics mitigates risk with proprietary playbooks, internal training and global delivery centers that diversify talent sources.
- High wages: software ~$110k; data science ~$120k; design ~$75k (2024)
- Freelance flexibility vs rate sensitivity
- Training and playbooks lower single-supplier dependence
- Global centers expand talent pool
Suppliers tighten margins: pulp squeeze, logistics shocks, cloud lock-in, wage inflation
Suppliers exert moderate-to-high power: concentrated paper/ink markets tightened in 2024 (pulp inventories multi-year lows), risking margin compression; logistics (USPS $77.9B FY2023) and 2022–24 fuel/capacity spikes raised costs. OEMs (press capex >$1M) and cloud providers (cloud spend $223B 2024; AWS 33%, Azure 22%, GCP 12%) create switching frictions; talent wage inflation (SW ~$110k, DS ~$120k, UX ~$75k) adds pressure.
| Supplier | 2024 metric | Impact |
|---|---|---|
| Paper/Ink | pulp inventories low | ↑ input costs |
| Logistics | USPS $77.9B FY23 | rate exposure |
| Cloud | $223B spend; AWS33% | switching friction |
| Equipment | press capex >$1M | lock-in |
| Talent | SW $110k; DS $120k | wage pressure |
What is included in the product
Detailed Word Document
Uncovers key competitive drivers, supplier and buyer power, threat of new entrants and substitutes, and rivalry specific to Quad/Graphics, highlighting pricing and margin pressures and strategic levers. Identifies disruptive threats and entry barriers with actionable insights for investors and management.
Customizable Excel Spreadsheet
A single-sheet Porter's Five Forces for Quad/Graphics that maps competitive pressures and actionable relief strategies—perfect for quick decision-making, slide-ready sharing, and easy customization without macros.
Customers Bargaining Power
Large enterprise clients
Large enterprise clients wield scale, procurement sophistication and alternatives, securing volume-based discounts typically in the 5–20% range and driving intense price pressure; in 2024 major brands represent the majority (>50%) of Quad's book of business. Multi-year MSAs temper churn but embed scheduled pricing reviews and performance gates tied to SLAs. Consolidating spend across print, media and digital can exchange scope for 10–25% better rates, while outcome-based KPIs sharpen accountability and penalties.
RFP-driven pricing pressure
RFP-driven bids in commercial print benchmark price and service tightly, often compressing margins by 100–300 basis points as buyers leverage industry scale (US printing industry revenue ~60 billion in 2024). Incumbency reduces but does not stop rebids; demonstrable ROI and speed-to-market justify 5–20% premiums. Case studies and pilots, which can lift win rates by mid-teens, are pivotal to defend pricing.
Moderate switching costs
Integrated workflows, data integrations, and co-created content create strong client stickiness by embedding Quad/Graphics into marketing and supply-chain processes. Standardization of many services, however, enables clients to partially switch or multi-source specific functions, reducing full-vendor dependence. Transition costs and learning curves slow complete vendor replacement, preserving revenue. Many contracts include 30–90 day notice periods, giving time to respond to churn.
Demand cyclicality and budget shifts
Demand cyclicality forces Quad/Graphics to absorb marketing-budget swings as clients cut or expand print spends with macro cycles, pressuring volumes and product mix; buyers’ rapid reallocations to digital can reduce print capacity utilization sharply. Adaptive pricing, modular offerings and short-run capabilities help cushion variability while proactive planning and multi-quarter contracts lock in baseline volumes.
- Budget flexibility: clients shift spend between channels
- Utilization risk: rapid print-to-digital moves reduce run lengths
- Mitigants: adaptive pricing and modular services
- Strategy: forward bookings and baseline contracts
Customization expectations
Clients now demand deep personalization, omnichannel orchestration and rapid iteration—78% of B2B buyers in 2024 expect tailored solutions—driving higher service intensity and frequent scope creep that pressures margins.
Value-based packaging and clear SLAs (typical SLA uplifts ~12% on profitable accounts) preserve margin while robust data-security certifications (SOC 2/ISO 27001) are table stakes for enterprise buyers.
- Personalization demand: 78% (2024)
- Scope-creep pressure: higher service intensity
- Margin tool: value-based packaging, SLAs (~12% uplift)
- Security: SOC 2 / ISO 27001 required
Enterprise buyers (>50% book) force discounts 5-20% and compress margins 100-300 bps
Enterprise clients (>50% of 2024 book) secure volume discounts (5–20%) and drive 100–300 bps margin compression via RFPs; MSAs and SLAs (typical uplifts ~12%) moderate churn. Personalization demands (78% B2B 2024) raise service intensity and scope creep, while industry scale (US print ~$60B 2024) sustains buyer leverage.
| Metric | 2024 Value |
|---|---|
| Enterprise share | >50% |
| Discounts | 5–20% |
| Margin pressure | 100–300 bps |
| SLA uplift | ~12% |
| Personalization demand | 78% |
| US print market | $60B |
Same Document Delivered
Quad/Graphics Porter's Five Forces Analysis
This Quad/Graphics Porter's Five Forces Analysis preview is the exact document you’ll receive upon purchase—no samples, no placeholders. It is fully formatted, professionally written, and ready for immediate download and use once payment is complete. The file you see here is the final deliverable, containing the complete analysis and conclusions you can act on right away.
Original: $10.00
-65%$10.00
$3.50Description
A Must-Have Tool for Decision-Makers
Quad/Graphics faces moderate buyer power, margin pressure from digital substitutes, and concentrated supplier relationships that shape pricing and service dynamics. New entrants pose limited short-term threat due to scale and capital needs, while rivalry among incumbents and tech-driven substitution elevate competitive intensity. This brief snapshot only scratches the surface. Unlock the full Porter's Five Forces Analysis to explore Quad/Graphics’s competitive dynamics and strategic implications in detail.
Suppliers Bargaining Power
Concentrated paper and ink inputs
Paper mills and specialty-ink producers remain relatively concentrated, giving suppliers pricing leverage during tight fiber or petrochemical cycles; 2024 industry reports noted pulp inventories at multi-year lows, intensifying upward pressure on paper costs. Input price volatility can compress Quad/Graphics margins unless hedged or passed through to clients. Long-term contracts and diversified sourcing have partially mitigated supplier power. Sustainability certifications further restrict interchangeable supply by narrowing eligible mills and inks.
Postal and logistics dependencies
Mailing services bind Quad to postal rates and carrier delivery standards, with the USPS reporting about $77.9 billion in operating revenue in FY2023, highlighting its market influence. Fuel surcharges and capacity constraints — which spiked logistics costs during 2022–24 — can shift costs upward. Co-mailing and logistics optimization reduce exposure but do not eliminate supplier power. Geographic dispersion of facilities helps balance regional disruptions.
Martech and data platform partners
Reliance on third-party adtech, CDPs and cloud providers creates switching frictions and integration costs. Global cloud infrastructure spend rose ~28% to $223B in 2024, concentrating power among major providers (AWS ~33%, Azure ~22%, Google Cloud ~12%). Vendors with unique capabilities or scale can exert pricing power while open architectures and multi-vendor stacks dilute individual supplier leverage. API changes and policy shifts pose material operational risk.
Specialized equipment OEMs
Presses, finishing and workflow systems are capital intensive (new press capex often exceeds $1M) and sourced from a small set of OEMs, giving suppliers elevated bargaining power; spare parts and maintenance lock-in raise lifetime supplier leverage, while SLAs and available second-source retrofit options mitigate downtime risk; long depreciation cycles discourage frequent equipment swapping.
- High capex: >$1M per press
- Supplier concentration: few OEMs
- Lock-in: spare parts & maintenance
- Mitigants: SLAs, second-source retrofits
- Constraint: long depreciation cycles
Creative and tech talent markets
Creative and tech talent markets raise supplier power: tight hiring pushed 2024 median US pay to about $110,000 for software engineers, ~$120,000 for data scientists and ~$75,000 for UX/UI designers, increasing wage pressure. Freelance networks provide flexible capacity but remain rate-sensitive. Quad/Graphics mitigates risk with proprietary playbooks, internal training and global delivery centers that diversify talent sources.
- High wages: software ~$110k; data science ~$120k; design ~$75k (2024)
- Freelance flexibility vs rate sensitivity
- Training and playbooks lower single-supplier dependence
- Global centers expand talent pool
Suppliers tighten margins: pulp squeeze, logistics shocks, cloud lock-in, wage inflation
Suppliers exert moderate-to-high power: concentrated paper/ink markets tightened in 2024 (pulp inventories multi-year lows), risking margin compression; logistics (USPS $77.9B FY2023) and 2022–24 fuel/capacity spikes raised costs. OEMs (press capex >$1M) and cloud providers (cloud spend $223B 2024; AWS 33%, Azure 22%, GCP 12%) create switching frictions; talent wage inflation (SW ~$110k, DS ~$120k, UX ~$75k) adds pressure.
| Supplier | 2024 metric | Impact |
|---|---|---|
| Paper/Ink | pulp inventories low | ↑ input costs |
| Logistics | USPS $77.9B FY23 | rate exposure |
| Cloud | $223B spend; AWS33% | switching friction |
| Equipment | press capex >$1M | lock-in |
| Talent | SW $110k; DS $120k | wage pressure |
What is included in the product
Detailed Word Document
Uncovers key competitive drivers, supplier and buyer power, threat of new entrants and substitutes, and rivalry specific to Quad/Graphics, highlighting pricing and margin pressures and strategic levers. Identifies disruptive threats and entry barriers with actionable insights for investors and management.
Customizable Excel Spreadsheet
A single-sheet Porter's Five Forces for Quad/Graphics that maps competitive pressures and actionable relief strategies—perfect for quick decision-making, slide-ready sharing, and easy customization without macros.
Customers Bargaining Power
Large enterprise clients
Large enterprise clients wield scale, procurement sophistication and alternatives, securing volume-based discounts typically in the 5–20% range and driving intense price pressure; in 2024 major brands represent the majority (>50%) of Quad's book of business. Multi-year MSAs temper churn but embed scheduled pricing reviews and performance gates tied to SLAs. Consolidating spend across print, media and digital can exchange scope for 10–25% better rates, while outcome-based KPIs sharpen accountability and penalties.
RFP-driven pricing pressure
RFP-driven bids in commercial print benchmark price and service tightly, often compressing margins by 100–300 basis points as buyers leverage industry scale (US printing industry revenue ~60 billion in 2024). Incumbency reduces but does not stop rebids; demonstrable ROI and speed-to-market justify 5–20% premiums. Case studies and pilots, which can lift win rates by mid-teens, are pivotal to defend pricing.
Moderate switching costs
Integrated workflows, data integrations, and co-created content create strong client stickiness by embedding Quad/Graphics into marketing and supply-chain processes. Standardization of many services, however, enables clients to partially switch or multi-source specific functions, reducing full-vendor dependence. Transition costs and learning curves slow complete vendor replacement, preserving revenue. Many contracts include 30–90 day notice periods, giving time to respond to churn.
Demand cyclicality and budget shifts
Demand cyclicality forces Quad/Graphics to absorb marketing-budget swings as clients cut or expand print spends with macro cycles, pressuring volumes and product mix; buyers’ rapid reallocations to digital can reduce print capacity utilization sharply. Adaptive pricing, modular offerings and short-run capabilities help cushion variability while proactive planning and multi-quarter contracts lock in baseline volumes.
- Budget flexibility: clients shift spend between channels
- Utilization risk: rapid print-to-digital moves reduce run lengths
- Mitigants: adaptive pricing and modular services
- Strategy: forward bookings and baseline contracts
Customization expectations
Clients now demand deep personalization, omnichannel orchestration and rapid iteration—78% of B2B buyers in 2024 expect tailored solutions—driving higher service intensity and frequent scope creep that pressures margins.
Value-based packaging and clear SLAs (typical SLA uplifts ~12% on profitable accounts) preserve margin while robust data-security certifications (SOC 2/ISO 27001) are table stakes for enterprise buyers.
- Personalization demand: 78% (2024)
- Scope-creep pressure: higher service intensity
- Margin tool: value-based packaging, SLAs (~12% uplift)
- Security: SOC 2 / ISO 27001 required
Enterprise buyers (>50% book) force discounts 5-20% and compress margins 100-300 bps
Enterprise clients (>50% of 2024 book) secure volume discounts (5–20%) and drive 100–300 bps margin compression via RFPs; MSAs and SLAs (typical uplifts ~12%) moderate churn. Personalization demands (78% B2B 2024) raise service intensity and scope creep, while industry scale (US print ~$60B 2024) sustains buyer leverage.
| Metric | 2024 Value |
|---|---|
| Enterprise share | >50% |
| Discounts | 5–20% |
| Margin pressure | 100–300 bps |
| SLA uplift | ~12% |
| Personalization demand | 78% |
| US print market | $60B |
Same Document Delivered
Quad/Graphics Porter's Five Forces Analysis
This Quad/Graphics Porter's Five Forces Analysis preview is the exact document you’ll receive upon purchase—no samples, no placeholders. It is fully formatted, professionally written, and ready for immediate download and use once payment is complete. The file you see here is the final deliverable, containing the complete analysis and conclusions you can act on right away.











