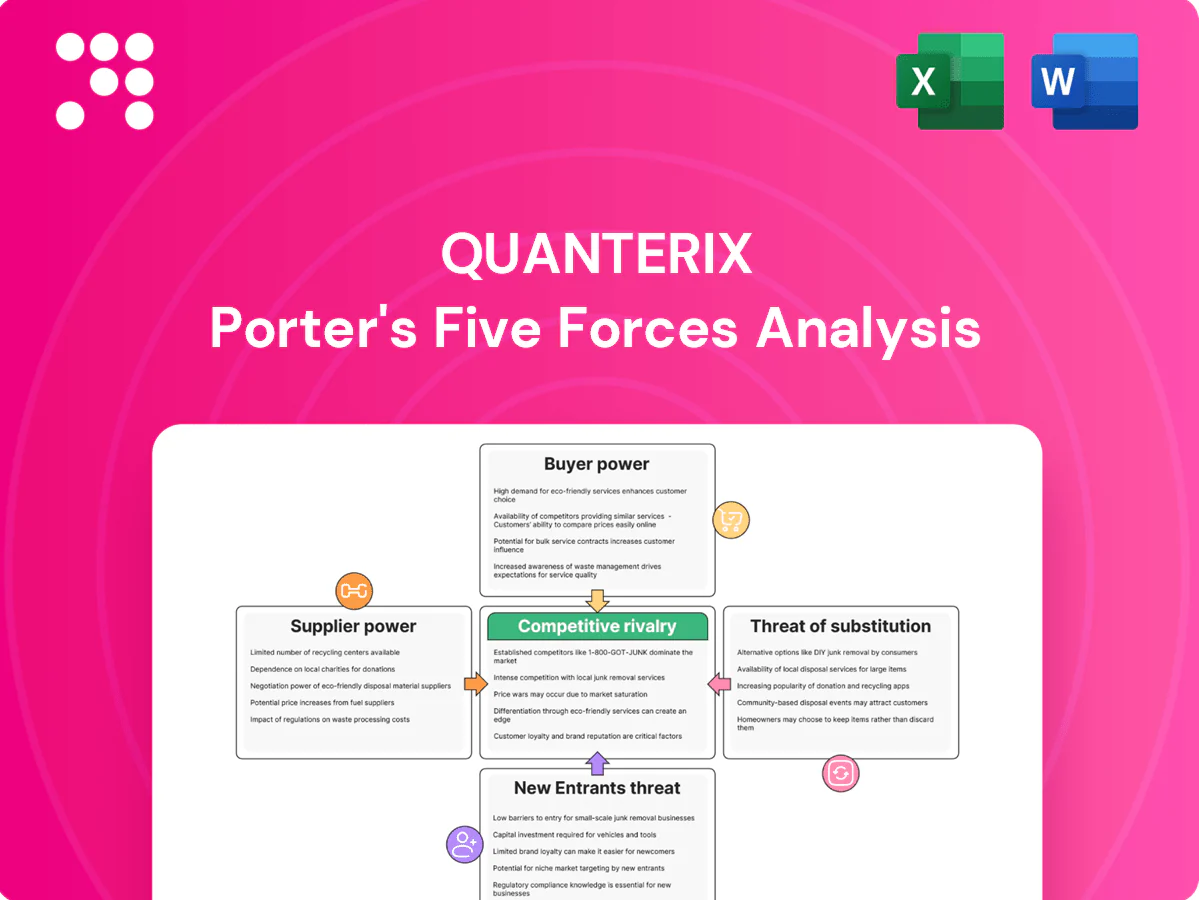
Quanterix Porter's Five Forces Analysis

Don't Miss the Bigger Picture
Quanterix’s Porter's Five Forces snapshot highlights its strong supplier relationships, high buyer expectations, and moderate threats from new entrants and substitutes, shaping competitive intensity in ultrasensitive diagnostics. The analysis identifies key strategic levers—pricing power, technology moat, and partnership risks—that influence margin and growth prospects. This brief only scratches the surface; unlock the full Porter's Five Forces Analysis for force-by-force ratings, visuals, and actionable insights to inform investment or strategy.
Suppliers Bargaining Power

Specialized reagent dependence
Quanterix depends on high-purity antibodies, enzymes and beads tailored to Simoa assays, many of which are single- or few-source suppliers, raising switching costs and concentration risk. Industry lead times have stretched to roughly 6–12 weeks during 2023–24, causing kit fulfillment and instrument uptime delays. Long-term supply agreements and dual-sourcing initiatives mitigate but do not eliminate disruption risk.
Precision components for instruments
Simoa instruments demand precision optics, microfluidics and electronics with tight tolerances, creating high qualification barriers; in 2024 supplier qualification and lead times routinely exceeded 12 months. Niche component makers thus hold pricing power, and redesigns to alternate parts are costly and time-consuming. Volume commitments and co-development deals can secure better pricing but increase supplier dependency and switching risk.

IP and licensing constraints
Certain assay chemistries and materials used by Quanterix are governed by third-party IP, and industry analyses in 2024 reported reagent royalty rates commonly in the 2–8% range, which can raise cost of goods. Field-of-use limits can restrict platform flexibility and market addressable applications, while scaling volumes or novel uses create renegotiation risk for licensing terms. Building a proprietary reagent and assay portfolio reduces long-term exposure and dilution of margin.

Quality and regulatory requirements
Clinical and translational use forces GMP-grade inputs and rigorous QC for Quanterix assays, and only a limited set of suppliers consistently meet audit and documentation standards, concentrating supplier leverage; batch variability can degrade Simoa sensitivity, driving tighter specs and higher input prices and lead times.
Logistics and lead-time volatility
Cold-chain reagents and custom parts for Quanterix travel longer, fragile supply chains; forecast errors often cause stockouts or obsolescence given limited shelf lives, driving firms to use expedited freight that can cost 3–5x more than sea and raise working capital needs by ~15% from added safety stock (2024 industry patterns). Collaborative planning reduces variability but requires high data transparency and integrated forecasting.
- Cold-chain fragility: longer lead times
- Forecast error → stockouts/obsolescence
- Expedited freight cost: 3–5x
- Safety stock ↑ working capital ~15%
- Collaborative planning needs data transparency
Supplier risk: 6-12 wk, >12 mo, 2-8%
Supplier concentration gives suppliers meaningful pricing and timing leverage: key reagents lead times 6–12 weeks (2023–24) and critical component qualification >12 months. Royalties commonly 2–8% increase COGS; cold-chain and forecast errors force expedited freight (3–5x) and ~15% higher working capital for safety stock. Long-term contracts and co-development lower but do not remove risk.
| Metric | 2024 Value |
|---|---|
| Reagent lead time | 6–12 weeks |
| Component qualification | >12 months |
| Royalty rates | 2–8% |
| Expedited freight cost | 3–5x sea |
| Working capital ↑ | ~15% |
What is included in the product
 Detailed Word Document
Tailored Porter's Five Forces analysis for Quanterix that uncovers competitive drivers, buyer/supplier power, threats from substitutes and new entrants, and identifies disruptive forces and strategic risks to market share.

 Customizable Excel Spreadsheet
Concise one-sheet Porter's Five Forces for Quanterix that maps competitive pressures with customizable inputs, instant radar visualization, clean layout for decks or dashboards, and scenario tabs (pre/post regulation, new entrants) — no macros, easy to use for non-finance teams.
Customers Bargaining Power

Concentrated enterprise buyers
Pharma, CROs and leading academic centers drive the bulk of Quanterix instrument and consumable volumes, and in 2024 the global CRO sector was estimated at about US$55 billion, amplifying buyer leverage. Procurement teams routinely negotiate discounts, service SLAs and assay customization, and multi-year framework agreements often compress margins in exchange for share-of-wallet. Quanterix’s platform reputation and publication output partially offset price pressure by preserving preferred-provider status with key accounts.
High switching costs and data lock-in
Validated biomarkers, panels and longitudinal datasets—backed by Quanterix's installed base of over 1,300 Simoa instruments worldwide—create strong inertia among customers. Re-qualification on rival platforms risks loss of comparability and regulatory setbacks, raising time-to-market and study costs. This reduces price elasticity for critical assays. Nonetheless, buyers commonly dual-source to hedge platform risk and pricing pressure.

Budget cyclicality and funding mix
Grant cycles and biopharma R&D budgets—global biopharma R&D spending exceeded $200 billion annually in 2023—drive instrument and consumable demand, while academic softness shifts the customer mix toward pharma, which negotiates tougher terms. Buyers often delay instrument purchases and rely on service labs, and promotions or leasing programs smooth sales but compress margins and recurring consumable attach rates.

Demand for end-to-end support
Customers demand end-to-end support—assay development, QC, training, and field service—because comprehensive service reduces downtime and raises perceived instrument value, weakening buyer power; in 2024 service reliability and SLAs became central negotiation levers. Service lapses prompt rapid competitive trials, forcing vendors like Quanterix to emphasize uptime guarantees and responsive field support to retain contracts.
- Assay development and QC included
- Training and field service expected
- SLAs and uptime guarantees used in negotiations
- Service lapses trigger competitor trials
Alternative platforms as leverage
In 2024 buyers benchmark Simoa against PEA, aptamer-based assays (SomaScan), MSD and mass spectrometry, using head-to-head data on sensitivity, throughput and total cost of ownership to extract concessions. Availability of acceptable alternatives strengthens buyer leverage, but Simoa’s ultra-sensitivity in plasma for select biomarkers preserves pricing power where single-molecule detection matters.
- Benchmarks: Simoa vs PEA, SomaScan, MSD, MS
- Negotiation drivers: sensitivity, throughput, TCO
- Buyer leverage: elevated by viable alternatives
- Simoa edge: reduced leverage on ultra-sensitive plasma assays
CRO market US$55B strengthens buyer leverage; biomarker platform lock-in reduces elasticity
Pharma/CROs and leading academic centers drive volumes; 2024 global CRO market ≈ US$55B, amplifying buyer leverage. Quanterix 1,300+ Simoa installs and validated biomarkers create switching inertia, lowering price elasticity though dual-sourcing is common. Service/SLAs and multi‑year deals compress margins while buyers benchmark vs PEA, SomaScan, MSD and MS to extract concessions.
| Metric | Value | Impact |
|---|---|---|
| CRO market (2024) | US$55B | High buyer leverage |
| Simoa installs | 1,300+ | Switching inertia |
| Biopharma R&D (2023) | >US$200B | Demand driver |
Same Document Delivered
Quanterix Porter's Five Forces Analysis
This preview shows the exact Quanterix Porter's Five Forces Analysis you'll receive immediately after purchase—no surprises or placeholders. The document displayed is the full, professionally formatted analysis, ready for download and use the moment you buy. No mockups or samples: this is the same final file you'll get instantly after payment.

Don't Miss the Bigger Picture
Quanterix’s Porter's Five Forces snapshot highlights its strong supplier relationships, high buyer expectations, and moderate threats from new entrants and substitutes, shaping competitive intensity in ultrasensitive diagnostics. The analysis identifies key strategic levers—pricing power, technology moat, and partnership risks—that influence margin and growth prospects. This brief only scratches the surface; unlock the full Porter's Five Forces Analysis for force-by-force ratings, visuals, and actionable insights to inform investment or strategy.
Suppliers Bargaining Power
Specialized reagent dependence
Quanterix depends on high-purity antibodies, enzymes and beads tailored to Simoa assays, many of which are single- or few-source suppliers, raising switching costs and concentration risk. Industry lead times have stretched to roughly 6–12 weeks during 2023–24, causing kit fulfillment and instrument uptime delays. Long-term supply agreements and dual-sourcing initiatives mitigate but do not eliminate disruption risk.
Precision components for instruments
Simoa instruments demand precision optics, microfluidics and electronics with tight tolerances, creating high qualification barriers; in 2024 supplier qualification and lead times routinely exceeded 12 months. Niche component makers thus hold pricing power, and redesigns to alternate parts are costly and time-consuming. Volume commitments and co-development deals can secure better pricing but increase supplier dependency and switching risk.
IP and licensing constraints
Certain assay chemistries and materials used by Quanterix are governed by third-party IP, and industry analyses in 2024 reported reagent royalty rates commonly in the 2–8% range, which can raise cost of goods. Field-of-use limits can restrict platform flexibility and market addressable applications, while scaling volumes or novel uses create renegotiation risk for licensing terms. Building a proprietary reagent and assay portfolio reduces long-term exposure and dilution of margin.
Quality and regulatory requirements
Clinical and translational use forces GMP-grade inputs and rigorous QC for Quanterix assays, and only a limited set of suppliers consistently meet audit and documentation standards, concentrating supplier leverage; batch variability can degrade Simoa sensitivity, driving tighter specs and higher input prices and lead times.
Logistics and lead-time volatility
Cold-chain reagents and custom parts for Quanterix travel longer, fragile supply chains; forecast errors often cause stockouts or obsolescence given limited shelf lives, driving firms to use expedited freight that can cost 3–5x more than sea and raise working capital needs by ~15% from added safety stock (2024 industry patterns). Collaborative planning reduces variability but requires high data transparency and integrated forecasting.
- Cold-chain fragility: longer lead times
- Forecast error → stockouts/obsolescence
- Expedited freight cost: 3–5x
- Safety stock ↑ working capital ~15%
- Collaborative planning needs data transparency
Supplier risk: 6-12 wk, >12 mo, 2-8%
Supplier concentration gives suppliers meaningful pricing and timing leverage: key reagents lead times 6–12 weeks (2023–24) and critical component qualification >12 months. Royalties commonly 2–8% increase COGS; cold-chain and forecast errors force expedited freight (3–5x) and ~15% higher working capital for safety stock. Long-term contracts and co-development lower but do not remove risk.
| Metric | 2024 Value |
|---|---|
| Reagent lead time | 6–12 weeks |
| Component qualification | >12 months |
| Royalty rates | 2–8% |
| Expedited freight cost | 3–5x sea |
| Working capital ↑ | ~15% |
What is included in the product
Detailed Word Document
Tailored Porter's Five Forces analysis for Quanterix that uncovers competitive drivers, buyer/supplier power, threats from substitutes and new entrants, and identifies disruptive forces and strategic risks to market share.
Customizable Excel Spreadsheet
Concise one-sheet Porter's Five Forces for Quanterix that maps competitive pressures with customizable inputs, instant radar visualization, clean layout for decks or dashboards, and scenario tabs (pre/post regulation, new entrants) — no macros, easy to use for non-finance teams.
Customers Bargaining Power
Concentrated enterprise buyers
Pharma, CROs and leading academic centers drive the bulk of Quanterix instrument and consumable volumes, and in 2024 the global CRO sector was estimated at about US$55 billion, amplifying buyer leverage. Procurement teams routinely negotiate discounts, service SLAs and assay customization, and multi-year framework agreements often compress margins in exchange for share-of-wallet. Quanterix’s platform reputation and publication output partially offset price pressure by preserving preferred-provider status with key accounts.
High switching costs and data lock-in
Validated biomarkers, panels and longitudinal datasets—backed by Quanterix's installed base of over 1,300 Simoa instruments worldwide—create strong inertia among customers. Re-qualification on rival platforms risks loss of comparability and regulatory setbacks, raising time-to-market and study costs. This reduces price elasticity for critical assays. Nonetheless, buyers commonly dual-source to hedge platform risk and pricing pressure.
Budget cyclicality and funding mix
Grant cycles and biopharma R&D budgets—global biopharma R&D spending exceeded $200 billion annually in 2023—drive instrument and consumable demand, while academic softness shifts the customer mix toward pharma, which negotiates tougher terms. Buyers often delay instrument purchases and rely on service labs, and promotions or leasing programs smooth sales but compress margins and recurring consumable attach rates.
Demand for end-to-end support
Customers demand end-to-end support—assay development, QC, training, and field service—because comprehensive service reduces downtime and raises perceived instrument value, weakening buyer power; in 2024 service reliability and SLAs became central negotiation levers. Service lapses prompt rapid competitive trials, forcing vendors like Quanterix to emphasize uptime guarantees and responsive field support to retain contracts.
- Assay development and QC included
- Training and field service expected
- SLAs and uptime guarantees used in negotiations
- Service lapses trigger competitor trials
Alternative platforms as leverage
In 2024 buyers benchmark Simoa against PEA, aptamer-based assays (SomaScan), MSD and mass spectrometry, using head-to-head data on sensitivity, throughput and total cost of ownership to extract concessions. Availability of acceptable alternatives strengthens buyer leverage, but Simoa’s ultra-sensitivity in plasma for select biomarkers preserves pricing power where single-molecule detection matters.
- Benchmarks: Simoa vs PEA, SomaScan, MSD, MS
- Negotiation drivers: sensitivity, throughput, TCO
- Buyer leverage: elevated by viable alternatives
- Simoa edge: reduced leverage on ultra-sensitive plasma assays
CRO market US$55B strengthens buyer leverage; biomarker platform lock-in reduces elasticity
Pharma/CROs and leading academic centers drive volumes; 2024 global CRO market ≈ US$55B, amplifying buyer leverage. Quanterix 1,300+ Simoa installs and validated biomarkers create switching inertia, lowering price elasticity though dual-sourcing is common. Service/SLAs and multi‑year deals compress margins while buyers benchmark vs PEA, SomaScan, MSD and MS to extract concessions.
| Metric | Value | Impact |
|---|---|---|
| CRO market (2024) | US$55B | High buyer leverage |
| Simoa installs | 1,300+ | Switching inertia |
| Biopharma R&D (2023) | >US$200B | Demand driver |
Same Document Delivered
Quanterix Porter's Five Forces Analysis
This preview shows the exact Quanterix Porter's Five Forces Analysis you'll receive immediately after purchase—no surprises or placeholders. The document displayed is the full, professionally formatted analysis, ready for download and use the moment you buy. No mockups or samples: this is the same final file you'll get instantly after payment.
Original: $10.00
-65%$10.00
$3.50Description
Don't Miss the Bigger Picture
Quanterix’s Porter's Five Forces snapshot highlights its strong supplier relationships, high buyer expectations, and moderate threats from new entrants and substitutes, shaping competitive intensity in ultrasensitive diagnostics. The analysis identifies key strategic levers—pricing power, technology moat, and partnership risks—that influence margin and growth prospects. This brief only scratches the surface; unlock the full Porter's Five Forces Analysis for force-by-force ratings, visuals, and actionable insights to inform investment or strategy.
Suppliers Bargaining Power
Specialized reagent dependence
Quanterix depends on high-purity antibodies, enzymes and beads tailored to Simoa assays, many of which are single- or few-source suppliers, raising switching costs and concentration risk. Industry lead times have stretched to roughly 6–12 weeks during 2023–24, causing kit fulfillment and instrument uptime delays. Long-term supply agreements and dual-sourcing initiatives mitigate but do not eliminate disruption risk.
Precision components for instruments
Simoa instruments demand precision optics, microfluidics and electronics with tight tolerances, creating high qualification barriers; in 2024 supplier qualification and lead times routinely exceeded 12 months. Niche component makers thus hold pricing power, and redesigns to alternate parts are costly and time-consuming. Volume commitments and co-development deals can secure better pricing but increase supplier dependency and switching risk.
IP and licensing constraints
Certain assay chemistries and materials used by Quanterix are governed by third-party IP, and industry analyses in 2024 reported reagent royalty rates commonly in the 2–8% range, which can raise cost of goods. Field-of-use limits can restrict platform flexibility and market addressable applications, while scaling volumes or novel uses create renegotiation risk for licensing terms. Building a proprietary reagent and assay portfolio reduces long-term exposure and dilution of margin.
Quality and regulatory requirements
Clinical and translational use forces GMP-grade inputs and rigorous QC for Quanterix assays, and only a limited set of suppliers consistently meet audit and documentation standards, concentrating supplier leverage; batch variability can degrade Simoa sensitivity, driving tighter specs and higher input prices and lead times.
Logistics and lead-time volatility
Cold-chain reagents and custom parts for Quanterix travel longer, fragile supply chains; forecast errors often cause stockouts or obsolescence given limited shelf lives, driving firms to use expedited freight that can cost 3–5x more than sea and raise working capital needs by ~15% from added safety stock (2024 industry patterns). Collaborative planning reduces variability but requires high data transparency and integrated forecasting.
- Cold-chain fragility: longer lead times
- Forecast error → stockouts/obsolescence
- Expedited freight cost: 3–5x
- Safety stock ↑ working capital ~15%
- Collaborative planning needs data transparency
Supplier risk: 6-12 wk, >12 mo, 2-8%
Supplier concentration gives suppliers meaningful pricing and timing leverage: key reagents lead times 6–12 weeks (2023–24) and critical component qualification >12 months. Royalties commonly 2–8% increase COGS; cold-chain and forecast errors force expedited freight (3–5x) and ~15% higher working capital for safety stock. Long-term contracts and co-development lower but do not remove risk.
| Metric | 2024 Value |
|---|---|
| Reagent lead time | 6–12 weeks |
| Component qualification | >12 months |
| Royalty rates | 2–8% |
| Expedited freight cost | 3–5x sea |
| Working capital ↑ | ~15% |
What is included in the product
Detailed Word Document
Tailored Porter's Five Forces analysis for Quanterix that uncovers competitive drivers, buyer/supplier power, threats from substitutes and new entrants, and identifies disruptive forces and strategic risks to market share.
Customizable Excel Spreadsheet
Concise one-sheet Porter's Five Forces for Quanterix that maps competitive pressures with customizable inputs, instant radar visualization, clean layout for decks or dashboards, and scenario tabs (pre/post regulation, new entrants) — no macros, easy to use for non-finance teams.
Customers Bargaining Power
Concentrated enterprise buyers
Pharma, CROs and leading academic centers drive the bulk of Quanterix instrument and consumable volumes, and in 2024 the global CRO sector was estimated at about US$55 billion, amplifying buyer leverage. Procurement teams routinely negotiate discounts, service SLAs and assay customization, and multi-year framework agreements often compress margins in exchange for share-of-wallet. Quanterix’s platform reputation and publication output partially offset price pressure by preserving preferred-provider status with key accounts.
High switching costs and data lock-in
Validated biomarkers, panels and longitudinal datasets—backed by Quanterix's installed base of over 1,300 Simoa instruments worldwide—create strong inertia among customers. Re-qualification on rival platforms risks loss of comparability and regulatory setbacks, raising time-to-market and study costs. This reduces price elasticity for critical assays. Nonetheless, buyers commonly dual-source to hedge platform risk and pricing pressure.
Budget cyclicality and funding mix
Grant cycles and biopharma R&D budgets—global biopharma R&D spending exceeded $200 billion annually in 2023—drive instrument and consumable demand, while academic softness shifts the customer mix toward pharma, which negotiates tougher terms. Buyers often delay instrument purchases and rely on service labs, and promotions or leasing programs smooth sales but compress margins and recurring consumable attach rates.
Demand for end-to-end support
Customers demand end-to-end support—assay development, QC, training, and field service—because comprehensive service reduces downtime and raises perceived instrument value, weakening buyer power; in 2024 service reliability and SLAs became central negotiation levers. Service lapses prompt rapid competitive trials, forcing vendors like Quanterix to emphasize uptime guarantees and responsive field support to retain contracts.
- Assay development and QC included
- Training and field service expected
- SLAs and uptime guarantees used in negotiations
- Service lapses trigger competitor trials
Alternative platforms as leverage
In 2024 buyers benchmark Simoa against PEA, aptamer-based assays (SomaScan), MSD and mass spectrometry, using head-to-head data on sensitivity, throughput and total cost of ownership to extract concessions. Availability of acceptable alternatives strengthens buyer leverage, but Simoa’s ultra-sensitivity in plasma for select biomarkers preserves pricing power where single-molecule detection matters.
- Benchmarks: Simoa vs PEA, SomaScan, MSD, MS
- Negotiation drivers: sensitivity, throughput, TCO
- Buyer leverage: elevated by viable alternatives
- Simoa edge: reduced leverage on ultra-sensitive plasma assays
CRO market US$55B strengthens buyer leverage; biomarker platform lock-in reduces elasticity
Pharma/CROs and leading academic centers drive volumes; 2024 global CRO market ≈ US$55B, amplifying buyer leverage. Quanterix 1,300+ Simoa installs and validated biomarkers create switching inertia, lowering price elasticity though dual-sourcing is common. Service/SLAs and multi‑year deals compress margins while buyers benchmark vs PEA, SomaScan, MSD and MS to extract concessions.
| Metric | Value | Impact |
|---|---|---|
| CRO market (2024) | US$55B | High buyer leverage |
| Simoa installs | 1,300+ | Switching inertia |
| Biopharma R&D (2023) | >US$200B | Demand driver |
Same Document Delivered
Quanterix Porter's Five Forces Analysis
This preview shows the exact Quanterix Porter's Five Forces Analysis you'll receive immediately after purchase—no surprises or placeholders. The document displayed is the full, professionally formatted analysis, ready for download and use the moment you buy. No mockups or samples: this is the same final file you'll get instantly after payment.











