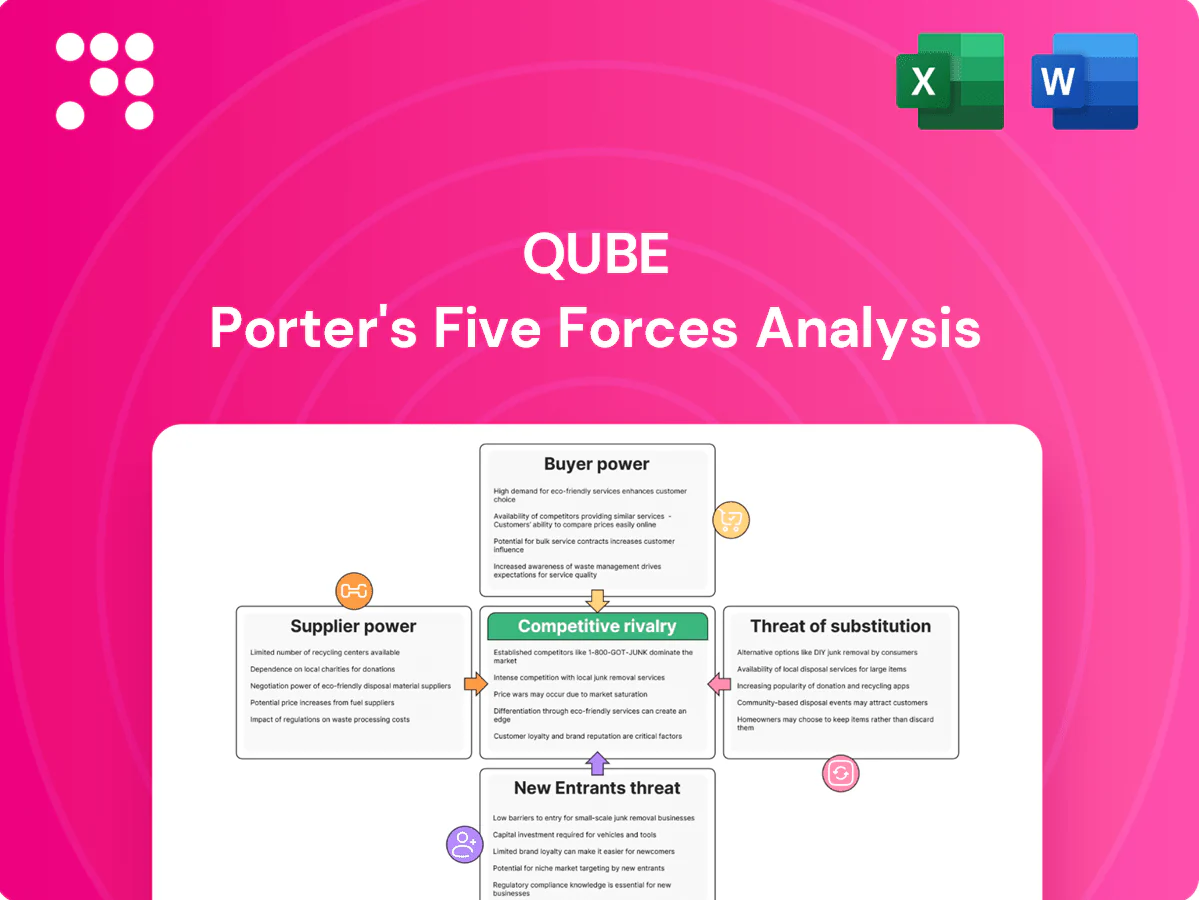
Qube Porter's Five Forces Analysis

Go Beyond the Preview—Access the Full Strategic Report
Qube's Porter's Five Forces snapshot highlights supplier leverage, buyer power, competitive rivalry and threats from new entrants and substitutes to reveal strategic pressure points. This brief overview uncovers critical risk areas and opportunity levers for investors and managers. Unlock the full Porter's Five Forces Analysis for force-by-force ratings, visuals and actionable recommendations tailored to Qube.
Suppliers Bargaining Power

Port authorities and terminal landlords
Port corporations control leases, access charges and berth allocations, giving landlords leverage over price and terms; prime waterfront is scarce, intensifying bargaining power. Long-dated concessions — e.g., Port of Melbourne 50-year lease — can embed escalation clauses that raise costs over time. Qube must sustain strong relationships to secure capacity and favorable slotting.
Rolling stock OEMs and lessors
Locomotives, wagons and cranes are capital‑intensive and sourced from a concentrated set of OEMs/lessors—notably CRRC, Alstom and Siemens—giving suppliers elevated leverage. Lead times of 6–24 months and bespoke specifications raise switching costs and lock in suppliers. Parts and long‑term maintenance contracts (often 10–20% of lifecycle spend) bundle pricing power. Supplier reliability directly affects service levels and Qube’s on‑time performance and asset utilization.

Fuel and energy providers
Diesel and electricity are material cost inputs across Qube’s road, rail and terminal fleets, with crude prices averaging about 86 USD/barrel in 2024, sustaining pressure on fuel-linked costs. Volatility in energy markets and limited large-scale alternatives elevate supplier bargaining power and pass-through risk to margins. Hedging reduces near-term exposure but cannot eliminate price transmission. Decarbonization shifts create reliance on new energy suppliers and infrastructure investment.

Skilled labor and unions
- Unionized specialists: high skill concentration
- 2024 wage growth ~4%: upward pressure
- Strikes risk: throughput disruption
- Training/retention: reduces supplier dependence
Technology and systems vendors
Technology vendors for TMS/WMS, terminal operating systems, telemetry and data platforms are mission critical; in 2024 99.9% uptime SLAs remain industry standard, giving vendors clear negotiation leverage while integration complexity and data lock-in raise switching costs materially.
- High switching costs due to integration and proprietary TOS
- 99.9% uptime SLAs and cybersecurity obligations boost vendor leverage
- Co-development and open APIs reduce single-vendor risk
Port pricing power, OEM bottlenecks and rising energy and wage costs squeeze margins
Port landlords, long leases and scarce waterfront give landlords pricing power; berth access drives costs. OEM concentration (CRRC, Alstom, Siemens) and 6–24m lead times raise switching costs. Energy costs (crude ~86 USD/barrel in 2024) and ~4% wage growth tighten margins. Tech and unions add service‑critical leverage.
| Metric | 2024 |
|---|---|
| Crude oil | ~86 USD/bbl |
| Wage growth | ~4% YoY |
| OEM concentration | High (CRRC/Alstom/Siemens) |
What is included in the product
 Detailed Word Document
Uncovers competitive drivers, supplier and buyer power, threat of substitutes and entry, and rivalry; tailored to Qube's logistics and port-services position, highlighting disruptive threats, regulatory and infrastructure barriers, pricing pressure and strategic responses.

 Customizable Excel Spreadsheet
Rapidly pinpoint competitive pressure and strategic gaps with Qube's Five Forces one-sheet—ideal for fast, board-ready decisions. Swap in live data or scenarios to relieve analysis bottlenecks and align teams instantly.
Customers Bargaining Power

Large importers and exporters
High-volume importers and exporters in containers, agribulk and resources negotiate aggressive rates, with Qube reporting FY24 revenue of A$1.85bn, reflecting intense price pressure from scale buyers. Multi-year, multi-site tenders—often benchmarked across providers—enable customers to demand step-down pricing and service SLAs. Buyers can shift lanes or split volumes to alternative operators, while Qube leverages value-added services (warehousing, stevedoring, logistics) to defend margins.
Shipping lines and freight forwarders
Global carriers and 3PLs aggregate volumes and run competitive bid cycles—top 10 carriers held roughly 85% of container capacity in 2024, concentrating bargaining power. They prize reliability and sub-48-hour dwell, using KPIs to push pricing and secure mid-single-digit concessions. Alliance rerouting gives them leverage to shift volumes between terminals/corridors, while integrated end-to-end solutions increase customer stickiness.

Mining and bulk commodity producers
Mining and bulk commodity producers (eg BHP, Rio Tinto, Fortescue) exert strong bargaining power in 2024 because they require guaranteed rail paths, stockyards and port throughput; a small number of large buyers drive volumes, so take-or-pay contracts are used to allocate risk but force sharp pricing; service failures carry contract penalties and can prompt immediate volume reallocation to competing terminals.

Automotive OEMs and distributors
Automotive OEMs and distributors exert high bargaining power: vehicle importers demand precise PDI, storage and shuttling with damage rates held to industry benchmarks under 0.5% (2024), volumes are lumpy and track consumer demand swings, and buyers increasingly run national tenders to leverage scale; bespoke workflows and IT integration in 2024 materially reduce price sensitivity and lock in service partners.
- Damage benchmark: <0.5% (2024)
- National tenders capture >90% of import scope
- Volume volatility tied to consumer demand
- Custom IT/workflows lower price elasticity
Retail and FMCG networks
Retail and FMCG networks drive time-definite delivery and peak-season smoothing into Qube contract terms, with buyers frequently unbundling port-to-door services and benchmarking across 3–5 providers. OTIF performance and real-time visibility tools now directly influence rate negotiations and penalty clauses. Collaborative demand planning can extend tenures and stabilize pricing.
- Time-definite delivery
- Unbundling services
- OTIF & visibility
- Collaborative planning
Major carriers and miners press rates as FY24 revenue A$1.85bn faces take-or-pay
Large importers, carriers and miners drive strong buyer power—Qube FY24 revenue A$1.85bn faces aggressive rate pressure from scale customers. Top 10 carriers held ~85% container capacity in 2024, while mining majors force take-or-pay terms. Automotive damage benchmark <0.5% (2024) tightens SLAs and penalties.
| Buyer | Power | FY24 datapoint |
|---|---|---|
| Global carriers | High | Top10 ~85% capacity |
| Mining | Very high | Take-or-pay contracts |
| Importers/OEMs | High | Damage <0.5% |
Preview Before You Purchase
Qube Porter's Five Forces Analysis
This preview shows the exact Qube Ports Porter’s Five Forces analysis you'll receive immediately after purchase—no surprises, no placeholders. The document is fully formatted, actionable, and ready for instant download. It includes tailored assessments of suppliers, buyers, new entrants, substitutes, and industry rivalry.

Go Beyond the Preview—Access the Full Strategic Report
Qube's Porter's Five Forces snapshot highlights supplier leverage, buyer power, competitive rivalry and threats from new entrants and substitutes to reveal strategic pressure points. This brief overview uncovers critical risk areas and opportunity levers for investors and managers. Unlock the full Porter's Five Forces Analysis for force-by-force ratings, visuals and actionable recommendations tailored to Qube.
Suppliers Bargaining Power
Port authorities and terminal landlords
Port corporations control leases, access charges and berth allocations, giving landlords leverage over price and terms; prime waterfront is scarce, intensifying bargaining power. Long-dated concessions — e.g., Port of Melbourne 50-year lease — can embed escalation clauses that raise costs over time. Qube must sustain strong relationships to secure capacity and favorable slotting.
Rolling stock OEMs and lessors
Locomotives, wagons and cranes are capital‑intensive and sourced from a concentrated set of OEMs/lessors—notably CRRC, Alstom and Siemens—giving suppliers elevated leverage. Lead times of 6–24 months and bespoke specifications raise switching costs and lock in suppliers. Parts and long‑term maintenance contracts (often 10–20% of lifecycle spend) bundle pricing power. Supplier reliability directly affects service levels and Qube’s on‑time performance and asset utilization.
Fuel and energy providers
Diesel and electricity are material cost inputs across Qube’s road, rail and terminal fleets, with crude prices averaging about 86 USD/barrel in 2024, sustaining pressure on fuel-linked costs. Volatility in energy markets and limited large-scale alternatives elevate supplier bargaining power and pass-through risk to margins. Hedging reduces near-term exposure but cannot eliminate price transmission. Decarbonization shifts create reliance on new energy suppliers and infrastructure investment.
Skilled labor and unions
- Unionized specialists: high skill concentration
- 2024 wage growth ~4%: upward pressure
- Strikes risk: throughput disruption
- Training/retention: reduces supplier dependence
Technology and systems vendors
Technology vendors for TMS/WMS, terminal operating systems, telemetry and data platforms are mission critical; in 2024 99.9% uptime SLAs remain industry standard, giving vendors clear negotiation leverage while integration complexity and data lock-in raise switching costs materially.
- High switching costs due to integration and proprietary TOS
- 99.9% uptime SLAs and cybersecurity obligations boost vendor leverage
- Co-development and open APIs reduce single-vendor risk
Port pricing power, OEM bottlenecks and rising energy and wage costs squeeze margins
Port landlords, long leases and scarce waterfront give landlords pricing power; berth access drives costs. OEM concentration (CRRC, Alstom, Siemens) and 6–24m lead times raise switching costs. Energy costs (crude ~86 USD/barrel in 2024) and ~4% wage growth tighten margins. Tech and unions add service‑critical leverage.
| Metric | 2024 |
|---|---|
| Crude oil | ~86 USD/bbl |
| Wage growth | ~4% YoY |
| OEM concentration | High (CRRC/Alstom/Siemens) |
What is included in the product
Detailed Word Document
Uncovers competitive drivers, supplier and buyer power, threat of substitutes and entry, and rivalry; tailored to Qube's logistics and port-services position, highlighting disruptive threats, regulatory and infrastructure barriers, pricing pressure and strategic responses.
Customizable Excel Spreadsheet
Rapidly pinpoint competitive pressure and strategic gaps with Qube's Five Forces one-sheet—ideal for fast, board-ready decisions. Swap in live data or scenarios to relieve analysis bottlenecks and align teams instantly.
Customers Bargaining Power
Large importers and exporters
High-volume importers and exporters in containers, agribulk and resources negotiate aggressive rates, with Qube reporting FY24 revenue of A$1.85bn, reflecting intense price pressure from scale buyers. Multi-year, multi-site tenders—often benchmarked across providers—enable customers to demand step-down pricing and service SLAs. Buyers can shift lanes or split volumes to alternative operators, while Qube leverages value-added services (warehousing, stevedoring, logistics) to defend margins.
Shipping lines and freight forwarders
Global carriers and 3PLs aggregate volumes and run competitive bid cycles—top 10 carriers held roughly 85% of container capacity in 2024, concentrating bargaining power. They prize reliability and sub-48-hour dwell, using KPIs to push pricing and secure mid-single-digit concessions. Alliance rerouting gives them leverage to shift volumes between terminals/corridors, while integrated end-to-end solutions increase customer stickiness.
Mining and bulk commodity producers
Mining and bulk commodity producers (eg BHP, Rio Tinto, Fortescue) exert strong bargaining power in 2024 because they require guaranteed rail paths, stockyards and port throughput; a small number of large buyers drive volumes, so take-or-pay contracts are used to allocate risk but force sharp pricing; service failures carry contract penalties and can prompt immediate volume reallocation to competing terminals.
Automotive OEMs and distributors
Automotive OEMs and distributors exert high bargaining power: vehicle importers demand precise PDI, storage and shuttling with damage rates held to industry benchmarks under 0.5% (2024), volumes are lumpy and track consumer demand swings, and buyers increasingly run national tenders to leverage scale; bespoke workflows and IT integration in 2024 materially reduce price sensitivity and lock in service partners.
- Damage benchmark: <0.5% (2024)
- National tenders capture >90% of import scope
- Volume volatility tied to consumer demand
- Custom IT/workflows lower price elasticity
Retail and FMCG networks
Retail and FMCG networks drive time-definite delivery and peak-season smoothing into Qube contract terms, with buyers frequently unbundling port-to-door services and benchmarking across 3–5 providers. OTIF performance and real-time visibility tools now directly influence rate negotiations and penalty clauses. Collaborative demand planning can extend tenures and stabilize pricing.
- Time-definite delivery
- Unbundling services
- OTIF & visibility
- Collaborative planning
Major carriers and miners press rates as FY24 revenue A$1.85bn faces take-or-pay
Large importers, carriers and miners drive strong buyer power—Qube FY24 revenue A$1.85bn faces aggressive rate pressure from scale customers. Top 10 carriers held ~85% container capacity in 2024, while mining majors force take-or-pay terms. Automotive damage benchmark <0.5% (2024) tightens SLAs and penalties.
| Buyer | Power | FY24 datapoint |
|---|---|---|
| Global carriers | High | Top10 ~85% capacity |
| Mining | Very high | Take-or-pay contracts |
| Importers/OEMs | High | Damage <0.5% |
Preview Before You Purchase
Qube Porter's Five Forces Analysis
This preview shows the exact Qube Ports Porter’s Five Forces analysis you'll receive immediately after purchase—no surprises, no placeholders. The document is fully formatted, actionable, and ready for instant download. It includes tailored assessments of suppliers, buyers, new entrants, substitutes, and industry rivalry.
Original: $10.00
-65%$10.00
$3.50Description
Go Beyond the Preview—Access the Full Strategic Report
Qube's Porter's Five Forces snapshot highlights supplier leverage, buyer power, competitive rivalry and threats from new entrants and substitutes to reveal strategic pressure points. This brief overview uncovers critical risk areas and opportunity levers for investors and managers. Unlock the full Porter's Five Forces Analysis for force-by-force ratings, visuals and actionable recommendations tailored to Qube.
Suppliers Bargaining Power
Port authorities and terminal landlords
Port corporations control leases, access charges and berth allocations, giving landlords leverage over price and terms; prime waterfront is scarce, intensifying bargaining power. Long-dated concessions — e.g., Port of Melbourne 50-year lease — can embed escalation clauses that raise costs over time. Qube must sustain strong relationships to secure capacity and favorable slotting.
Rolling stock OEMs and lessors
Locomotives, wagons and cranes are capital‑intensive and sourced from a concentrated set of OEMs/lessors—notably CRRC, Alstom and Siemens—giving suppliers elevated leverage. Lead times of 6–24 months and bespoke specifications raise switching costs and lock in suppliers. Parts and long‑term maintenance contracts (often 10–20% of lifecycle spend) bundle pricing power. Supplier reliability directly affects service levels and Qube’s on‑time performance and asset utilization.
Fuel and energy providers
Diesel and electricity are material cost inputs across Qube’s road, rail and terminal fleets, with crude prices averaging about 86 USD/barrel in 2024, sustaining pressure on fuel-linked costs. Volatility in energy markets and limited large-scale alternatives elevate supplier bargaining power and pass-through risk to margins. Hedging reduces near-term exposure but cannot eliminate price transmission. Decarbonization shifts create reliance on new energy suppliers and infrastructure investment.
Skilled labor and unions
- Unionized specialists: high skill concentration
- 2024 wage growth ~4%: upward pressure
- Strikes risk: throughput disruption
- Training/retention: reduces supplier dependence
Technology and systems vendors
Technology vendors for TMS/WMS, terminal operating systems, telemetry and data platforms are mission critical; in 2024 99.9% uptime SLAs remain industry standard, giving vendors clear negotiation leverage while integration complexity and data lock-in raise switching costs materially.
- High switching costs due to integration and proprietary TOS
- 99.9% uptime SLAs and cybersecurity obligations boost vendor leverage
- Co-development and open APIs reduce single-vendor risk
Port pricing power, OEM bottlenecks and rising energy and wage costs squeeze margins
Port landlords, long leases and scarce waterfront give landlords pricing power; berth access drives costs. OEM concentration (CRRC, Alstom, Siemens) and 6–24m lead times raise switching costs. Energy costs (crude ~86 USD/barrel in 2024) and ~4% wage growth tighten margins. Tech and unions add service‑critical leverage.
| Metric | 2024 |
|---|---|
| Crude oil | ~86 USD/bbl |
| Wage growth | ~4% YoY |
| OEM concentration | High (CRRC/Alstom/Siemens) |
What is included in the product
Detailed Word Document
Uncovers competitive drivers, supplier and buyer power, threat of substitutes and entry, and rivalry; tailored to Qube's logistics and port-services position, highlighting disruptive threats, regulatory and infrastructure barriers, pricing pressure and strategic responses.
Customizable Excel Spreadsheet
Rapidly pinpoint competitive pressure and strategic gaps with Qube's Five Forces one-sheet—ideal for fast, board-ready decisions. Swap in live data or scenarios to relieve analysis bottlenecks and align teams instantly.
Customers Bargaining Power
Large importers and exporters
High-volume importers and exporters in containers, agribulk and resources negotiate aggressive rates, with Qube reporting FY24 revenue of A$1.85bn, reflecting intense price pressure from scale buyers. Multi-year, multi-site tenders—often benchmarked across providers—enable customers to demand step-down pricing and service SLAs. Buyers can shift lanes or split volumes to alternative operators, while Qube leverages value-added services (warehousing, stevedoring, logistics) to defend margins.
Shipping lines and freight forwarders
Global carriers and 3PLs aggregate volumes and run competitive bid cycles—top 10 carriers held roughly 85% of container capacity in 2024, concentrating bargaining power. They prize reliability and sub-48-hour dwell, using KPIs to push pricing and secure mid-single-digit concessions. Alliance rerouting gives them leverage to shift volumes between terminals/corridors, while integrated end-to-end solutions increase customer stickiness.
Mining and bulk commodity producers
Mining and bulk commodity producers (eg BHP, Rio Tinto, Fortescue) exert strong bargaining power in 2024 because they require guaranteed rail paths, stockyards and port throughput; a small number of large buyers drive volumes, so take-or-pay contracts are used to allocate risk but force sharp pricing; service failures carry contract penalties and can prompt immediate volume reallocation to competing terminals.
Automotive OEMs and distributors
Automotive OEMs and distributors exert high bargaining power: vehicle importers demand precise PDI, storage and shuttling with damage rates held to industry benchmarks under 0.5% (2024), volumes are lumpy and track consumer demand swings, and buyers increasingly run national tenders to leverage scale; bespoke workflows and IT integration in 2024 materially reduce price sensitivity and lock in service partners.
- Damage benchmark: <0.5% (2024)
- National tenders capture >90% of import scope
- Volume volatility tied to consumer demand
- Custom IT/workflows lower price elasticity
Retail and FMCG networks
Retail and FMCG networks drive time-definite delivery and peak-season smoothing into Qube contract terms, with buyers frequently unbundling port-to-door services and benchmarking across 3–5 providers. OTIF performance and real-time visibility tools now directly influence rate negotiations and penalty clauses. Collaborative demand planning can extend tenures and stabilize pricing.
- Time-definite delivery
- Unbundling services
- OTIF & visibility
- Collaborative planning
Major carriers and miners press rates as FY24 revenue A$1.85bn faces take-or-pay
Large importers, carriers and miners drive strong buyer power—Qube FY24 revenue A$1.85bn faces aggressive rate pressure from scale customers. Top 10 carriers held ~85% container capacity in 2024, while mining majors force take-or-pay terms. Automotive damage benchmark <0.5% (2024) tightens SLAs and penalties.
| Buyer | Power | FY24 datapoint |
|---|---|---|
| Global carriers | High | Top10 ~85% capacity |
| Mining | Very high | Take-or-pay contracts |
| Importers/OEMs | High | Damage <0.5% |
Preview Before You Purchase
Qube Porter's Five Forces Analysis
This preview shows the exact Qube Ports Porter’s Five Forces analysis you'll receive immediately after purchase—no surprises, no placeholders. The document is fully formatted, actionable, and ready for instant download. It includes tailored assessments of suppliers, buyers, new entrants, substitutes, and industry rivalry.











