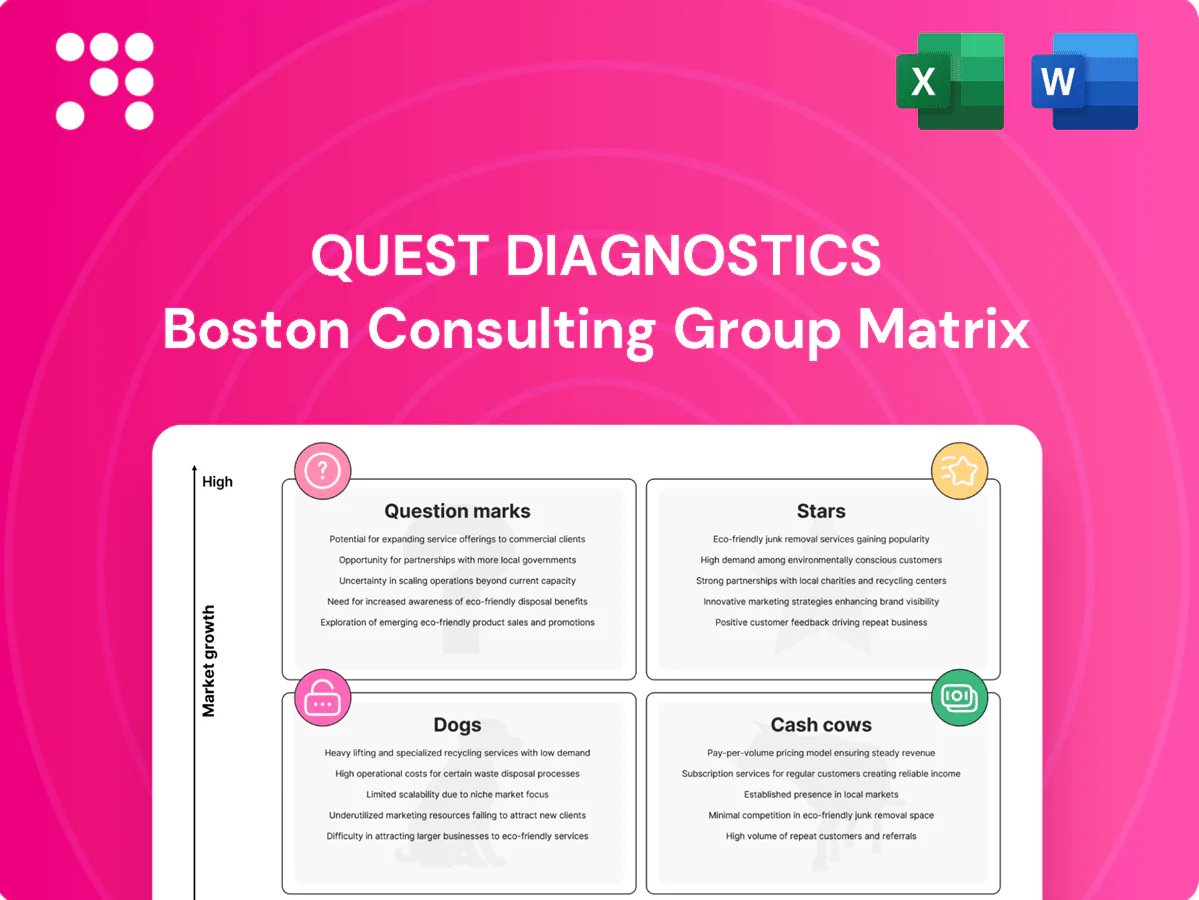
Quest Diagnostics Boston Consulting Group Matrix

Unlock Strategic Clarity
Curious where Quest Diagnostics’ services and test lines land—Stars, Cash Cows, Dogs, or Question Marks? This snapshot hints at strengths and pressure points, but the full BCG Matrix gives you quadrant-by-quadrant placement, data-backed recommendations, and a clear capital-allocation roadmap. Buy the full report for a ready-to-use Word analysis plus an Excel summary—skip the guesswork and get strategic clarity fast.
Stars

Advanced molecular diagnostics
Advanced molecular diagnostics sits in Stars: oncology, infectious disease, and rare-disease testing are driving high-volume, higher-priced assays amid an estimated ~9% global molecular diagnostics CAGR in 2024; Quest captures meaningful share via scale—~2,200 patient service centers and 145 labs—and specialist talent. Ongoing platform capex and validation are required; continued investment can convert current growth into outsized cash flow as the segment matures.
Genetic & genomic testing
Genetic and genomic testing is a Star as consumer and clinician adoption rises rapidly, with NIPT penetration topping 60% in many developed markets and oncology panel volumes up ~15% year-over-year in 2023–24. Quest’s brand, payer contracts and compliance stack leverage its scale—Quest Diagnostics reported ~$11.9B revenue in 2023—to win trust in a crowded field. Capital intensity remains high with continued capex and marketing spend to educate physicians. Invest to cement leadership before growth normalizes.

Hospital & health system partnerships
Hospital systems are accelerating lab outsourcing to cut costs and improve turnaround, and Quest—serving roughly 150 million patients annually and ~45,000 employees—wins with scale, logistics, IT connectivity and strict SLAs. Integrations are complex, often taking 12–24 months and consuming significant upfront cash. Quest uses land-and-expand to secure long-term volumes now and higher margin mix later.

Specialty oncology assays
Specialty oncology assays (companion diagnostics and MRD) sit in Stars: expanding markets with premium pricing; global companion diagnostics market exceeded 2024 estimates near 6.8B and MRD adoption accelerated in 2024 with double-digit clinical uptake. Quest (2024 revenue ~10.8B) can leverage oncologist ties and payer coverage but must continuously update assays and link trials; leadership multiplies brand and reimbursement clout.
- Market: companion diagnostics ~6.8B (2024)
- Adoption: MRD double-digit clinical uptake (2024)
- Quest: 2024 revenue ~10.8B
- Needs: constant assay updates + trial linkage
- Benefit: leadership boosts brand & reimbursement
Digital ordering & EMR integrations
Clinician-friendly digital ordering and tight EMR integrations drive workflow adoption; studies show integrated order flows can cut ordering time by ~30% and boost lab utilization—Quest, processing about 500 million tests annually (2024), leverages a broad connectivity footprint with major EHRs to create defensible network effects.
Keeping this lead requires ongoing IT spend and co-development with health systems; doubling down raises switching costs and supports share gains in high-value segments.
- Tags: integration, workflow, EMR, connectivity, switching-costs
Scale-driven molecular testing: premium pricing, companion Dx & MRD lift margins amid capex needs
Quest's Stars: advanced molecular and genetic testing drive ~9% global molecular CAGR (2024) with Quest leveraging scale—~2,200 PSCs, 145 labs and ~500M tests—to capture premium pricing. Companion diagnostics (~6.8B 2024) and MRD (double-digit 2024 uptake) boost margins but require continual assay investment. Hospital outsourcing and EMR integration create durable share gains while capex and validation remain material.
| Metric | 2024 |
|---|---|
| Revenue | $11.9B |
| Tests | 500M |
| PSCs / Labs | 2,200 / 145 |
| Companion Dx | $6.8B |
What is included in the product
 Detailed Word Document
Tailored BCG Matrix for Quest Diagnostics: identifies Stars, Cash Cows, Question Marks, Dogs with clear invest/hold/divest guidance.

 Customizable Excel Spreadsheet
One-page Quest Diagnostics BCG Matrix highlighting underperformers and growth bets to stop wasted spend.
Cash Cows

Routine clinical chemistry
Routine clinical chemistry panels (CBC, CMP, lipids, A1c) are high-volume, cash-generating services for Quest Diagnostics with mature market demand and predictable reimbursement under programs like the Medicare Clinical Laboratory Fee Schedule; low promotional needs allow focus on throughput and reducing cost per test through automation and lab consolidation, making these tests the operational "milk" funding efficiency and growth projects.
Therapeutic drug monitoring
Therapeutic drug monitoring is a cash cow for Quest Diagnostics: chronic care protocols generate steady, repeat testing with established clinical guidelines driving predictable volumes. Market growth is modest while volumes remain sticky, supporting reliable utilization. Margins benefit from automation and batching; priority is maintaining service levels and squeezing incremental cost savings.

Pathology & histology services
Core surgical pathology remains essential and largely contracted within Quest Diagnostics, supporting referral networks across its ~2,200 patient service centers and ~45,000 employees (2024). Growth is slow single-digit, but a complex case mix sustains strong margins and lower churn due to brand and CAP/CLIA accreditations. Maintain high quality and invest in digital workflow and AI-assisted slide review to lift yield and throughput.

Toxicology (clinical compliance)
Clinical toxicology for pain-management and compliance is a cash cow: mature market with consistent volumes (~±1% YoY in 2024) and stable pricing; payer coverage remained reliable through 2024, preserving steady reimbursements. Differentiation is operational excellence, not marketing—scale and lab efficiency drive margins. Standardize platforms, reduce unit cost, and convert predictable throughput into free cash flow.
- Market maturity: stable volumes (~±1% YoY, 2024)
- Payer coverage: reliable in 2024, preserving reimbursement
- Differentiator: operational excellence, not promotion
- Strategy: standardize platforms and pocket cash
Employer wellness screening
Employer wellness screening is a cash cow: biometric screenings and panels are recurring, seasonal, and typically contracted, delivering steady utilization through 2024 rather than growth spikes. Once embedded with large employers, marketing spend is minimal; focus on maintaining client relationships and optimizing mobile operations to protect margin and capacity.
- Recurring revenue: contracted, seasonal delivery
- Market: steady in 2024, not surging
- Go-to-market: low ongoing marketing need
- Operational focus: relationship management, mobile ops optimization
Stable lab cash cows: routine tests, TDM, pathology driving predictable margins and free cash flow
Routine panels, therapeutic drug monitoring, surgical pathology, clinical toxicology and employer wellness are Quest Diagnostics cash cows: stable volumes (~±1% YoY, 2024), predictable Medicare CLFS-driven reimbursement, low marketing, high margins via automation and scale; focus on cost per test, digital workflows and converting throughput into free cash flow across ~2,200 patient service centers and ~45,000 employees (2024).
| Service | 2024 Volume Trend | Key Metric |
|---|---|---|
| Routine panels | Stable | Medicare CLFS |
| TDM | Sticky | Chronic repeat tests |
| Pathology | Low growth | High margin, complex cases |
What You See Is What You Get
Quest Diagnostics BCG Matrix
The file you’re previewing is the exact Quest Diagnostics BCG Matrix report you’ll receive after purchase. No watermarks or demo notes—just the fully formatted, analysis-ready document. It’s crafted for strategic clarity and immediate use, editable and printable for presentations or planning. Buy once and download instantly—no surprises.

Unlock Strategic Clarity
Curious where Quest Diagnostics’ services and test lines land—Stars, Cash Cows, Dogs, or Question Marks? This snapshot hints at strengths and pressure points, but the full BCG Matrix gives you quadrant-by-quadrant placement, data-backed recommendations, and a clear capital-allocation roadmap. Buy the full report for a ready-to-use Word analysis plus an Excel summary—skip the guesswork and get strategic clarity fast.
Stars
Advanced molecular diagnostics
Advanced molecular diagnostics sits in Stars: oncology, infectious disease, and rare-disease testing are driving high-volume, higher-priced assays amid an estimated ~9% global molecular diagnostics CAGR in 2024; Quest captures meaningful share via scale—~2,200 patient service centers and 145 labs—and specialist talent. Ongoing platform capex and validation are required; continued investment can convert current growth into outsized cash flow as the segment matures.
Genetic & genomic testing
Genetic and genomic testing is a Star as consumer and clinician adoption rises rapidly, with NIPT penetration topping 60% in many developed markets and oncology panel volumes up ~15% year-over-year in 2023–24. Quest’s brand, payer contracts and compliance stack leverage its scale—Quest Diagnostics reported ~$11.9B revenue in 2023—to win trust in a crowded field. Capital intensity remains high with continued capex and marketing spend to educate physicians. Invest to cement leadership before growth normalizes.
Hospital & health system partnerships
Hospital systems are accelerating lab outsourcing to cut costs and improve turnaround, and Quest—serving roughly 150 million patients annually and ~45,000 employees—wins with scale, logistics, IT connectivity and strict SLAs. Integrations are complex, often taking 12–24 months and consuming significant upfront cash. Quest uses land-and-expand to secure long-term volumes now and higher margin mix later.
Specialty oncology assays
Specialty oncology assays (companion diagnostics and MRD) sit in Stars: expanding markets with premium pricing; global companion diagnostics market exceeded 2024 estimates near 6.8B and MRD adoption accelerated in 2024 with double-digit clinical uptake. Quest (2024 revenue ~10.8B) can leverage oncologist ties and payer coverage but must continuously update assays and link trials; leadership multiplies brand and reimbursement clout.
- Market: companion diagnostics ~6.8B (2024)
- Adoption: MRD double-digit clinical uptake (2024)
- Quest: 2024 revenue ~10.8B
- Needs: constant assay updates + trial linkage
- Benefit: leadership boosts brand & reimbursement
Digital ordering & EMR integrations
Clinician-friendly digital ordering and tight EMR integrations drive workflow adoption; studies show integrated order flows can cut ordering time by ~30% and boost lab utilization—Quest, processing about 500 million tests annually (2024), leverages a broad connectivity footprint with major EHRs to create defensible network effects.
Keeping this lead requires ongoing IT spend and co-development with health systems; doubling down raises switching costs and supports share gains in high-value segments.
- Tags: integration, workflow, EMR, connectivity, switching-costs
Scale-driven molecular testing: premium pricing, companion Dx & MRD lift margins amid capex needs
Quest's Stars: advanced molecular and genetic testing drive ~9% global molecular CAGR (2024) with Quest leveraging scale—~2,200 PSCs, 145 labs and ~500M tests—to capture premium pricing. Companion diagnostics (~6.8B 2024) and MRD (double-digit 2024 uptake) boost margins but require continual assay investment. Hospital outsourcing and EMR integration create durable share gains while capex and validation remain material.
| Metric | 2024 |
|---|---|
| Revenue | $11.9B |
| Tests | 500M |
| PSCs / Labs | 2,200 / 145 |
| Companion Dx | $6.8B |
What is included in the product
Detailed Word Document
Tailored BCG Matrix for Quest Diagnostics: identifies Stars, Cash Cows, Question Marks, Dogs with clear invest/hold/divest guidance.
Customizable Excel Spreadsheet
One-page Quest Diagnostics BCG Matrix highlighting underperformers and growth bets to stop wasted spend.
Cash Cows
Routine clinical chemistry
Routine clinical chemistry panels (CBC, CMP, lipids, A1c) are high-volume, cash-generating services for Quest Diagnostics with mature market demand and predictable reimbursement under programs like the Medicare Clinical Laboratory Fee Schedule; low promotional needs allow focus on throughput and reducing cost per test through automation and lab consolidation, making these tests the operational "milk" funding efficiency and growth projects.
Therapeutic drug monitoring
Therapeutic drug monitoring is a cash cow for Quest Diagnostics: chronic care protocols generate steady, repeat testing with established clinical guidelines driving predictable volumes. Market growth is modest while volumes remain sticky, supporting reliable utilization. Margins benefit from automation and batching; priority is maintaining service levels and squeezing incremental cost savings.
Pathology & histology services
Core surgical pathology remains essential and largely contracted within Quest Diagnostics, supporting referral networks across its ~2,200 patient service centers and ~45,000 employees (2024). Growth is slow single-digit, but a complex case mix sustains strong margins and lower churn due to brand and CAP/CLIA accreditations. Maintain high quality and invest in digital workflow and AI-assisted slide review to lift yield and throughput.
Toxicology (clinical compliance)
Clinical toxicology for pain-management and compliance is a cash cow: mature market with consistent volumes (~±1% YoY in 2024) and stable pricing; payer coverage remained reliable through 2024, preserving steady reimbursements. Differentiation is operational excellence, not marketing—scale and lab efficiency drive margins. Standardize platforms, reduce unit cost, and convert predictable throughput into free cash flow.
- Market maturity: stable volumes (~±1% YoY, 2024)
- Payer coverage: reliable in 2024, preserving reimbursement
- Differentiator: operational excellence, not promotion
- Strategy: standardize platforms and pocket cash
Employer wellness screening
Employer wellness screening is a cash cow: biometric screenings and panels are recurring, seasonal, and typically contracted, delivering steady utilization through 2024 rather than growth spikes. Once embedded with large employers, marketing spend is minimal; focus on maintaining client relationships and optimizing mobile operations to protect margin and capacity.
- Recurring revenue: contracted, seasonal delivery
- Market: steady in 2024, not surging
- Go-to-market: low ongoing marketing need
- Operational focus: relationship management, mobile ops optimization
Stable lab cash cows: routine tests, TDM, pathology driving predictable margins and free cash flow
Routine panels, therapeutic drug monitoring, surgical pathology, clinical toxicology and employer wellness are Quest Diagnostics cash cows: stable volumes (~±1% YoY, 2024), predictable Medicare CLFS-driven reimbursement, low marketing, high margins via automation and scale; focus on cost per test, digital workflows and converting throughput into free cash flow across ~2,200 patient service centers and ~45,000 employees (2024).
| Service | 2024 Volume Trend | Key Metric |
|---|---|---|
| Routine panels | Stable | Medicare CLFS |
| TDM | Sticky | Chronic repeat tests |
| Pathology | Low growth | High margin, complex cases |
What You See Is What You Get
Quest Diagnostics BCG Matrix
The file you’re previewing is the exact Quest Diagnostics BCG Matrix report you’ll receive after purchase. No watermarks or demo notes—just the fully formatted, analysis-ready document. It’s crafted for strategic clarity and immediate use, editable and printable for presentations or planning. Buy once and download instantly—no surprises.
Original: $10.00
-65%$10.00
$3.50Description
Unlock Strategic Clarity
Curious where Quest Diagnostics’ services and test lines land—Stars, Cash Cows, Dogs, or Question Marks? This snapshot hints at strengths and pressure points, but the full BCG Matrix gives you quadrant-by-quadrant placement, data-backed recommendations, and a clear capital-allocation roadmap. Buy the full report for a ready-to-use Word analysis plus an Excel summary—skip the guesswork and get strategic clarity fast.
Stars
Advanced molecular diagnostics
Advanced molecular diagnostics sits in Stars: oncology, infectious disease, and rare-disease testing are driving high-volume, higher-priced assays amid an estimated ~9% global molecular diagnostics CAGR in 2024; Quest captures meaningful share via scale—~2,200 patient service centers and 145 labs—and specialist talent. Ongoing platform capex and validation are required; continued investment can convert current growth into outsized cash flow as the segment matures.
Genetic & genomic testing
Genetic and genomic testing is a Star as consumer and clinician adoption rises rapidly, with NIPT penetration topping 60% in many developed markets and oncology panel volumes up ~15% year-over-year in 2023–24. Quest’s brand, payer contracts and compliance stack leverage its scale—Quest Diagnostics reported ~$11.9B revenue in 2023—to win trust in a crowded field. Capital intensity remains high with continued capex and marketing spend to educate physicians. Invest to cement leadership before growth normalizes.
Hospital & health system partnerships
Hospital systems are accelerating lab outsourcing to cut costs and improve turnaround, and Quest—serving roughly 150 million patients annually and ~45,000 employees—wins with scale, logistics, IT connectivity and strict SLAs. Integrations are complex, often taking 12–24 months and consuming significant upfront cash. Quest uses land-and-expand to secure long-term volumes now and higher margin mix later.
Specialty oncology assays
Specialty oncology assays (companion diagnostics and MRD) sit in Stars: expanding markets with premium pricing; global companion diagnostics market exceeded 2024 estimates near 6.8B and MRD adoption accelerated in 2024 with double-digit clinical uptake. Quest (2024 revenue ~10.8B) can leverage oncologist ties and payer coverage but must continuously update assays and link trials; leadership multiplies brand and reimbursement clout.
- Market: companion diagnostics ~6.8B (2024)
- Adoption: MRD double-digit clinical uptake (2024)
- Quest: 2024 revenue ~10.8B
- Needs: constant assay updates + trial linkage
- Benefit: leadership boosts brand & reimbursement
Digital ordering & EMR integrations
Clinician-friendly digital ordering and tight EMR integrations drive workflow adoption; studies show integrated order flows can cut ordering time by ~30% and boost lab utilization—Quest, processing about 500 million tests annually (2024), leverages a broad connectivity footprint with major EHRs to create defensible network effects.
Keeping this lead requires ongoing IT spend and co-development with health systems; doubling down raises switching costs and supports share gains in high-value segments.
- Tags: integration, workflow, EMR, connectivity, switching-costs
Scale-driven molecular testing: premium pricing, companion Dx & MRD lift margins amid capex needs
Quest's Stars: advanced molecular and genetic testing drive ~9% global molecular CAGR (2024) with Quest leveraging scale—~2,200 PSCs, 145 labs and ~500M tests—to capture premium pricing. Companion diagnostics (~6.8B 2024) and MRD (double-digit 2024 uptake) boost margins but require continual assay investment. Hospital outsourcing and EMR integration create durable share gains while capex and validation remain material.
| Metric | 2024 |
|---|---|
| Revenue | $11.9B |
| Tests | 500M |
| PSCs / Labs | 2,200 / 145 |
| Companion Dx | $6.8B |
What is included in the product
Detailed Word Document
Tailored BCG Matrix for Quest Diagnostics: identifies Stars, Cash Cows, Question Marks, Dogs with clear invest/hold/divest guidance.
Customizable Excel Spreadsheet
One-page Quest Diagnostics BCG Matrix highlighting underperformers and growth bets to stop wasted spend.
Cash Cows
Routine clinical chemistry
Routine clinical chemistry panels (CBC, CMP, lipids, A1c) are high-volume, cash-generating services for Quest Diagnostics with mature market demand and predictable reimbursement under programs like the Medicare Clinical Laboratory Fee Schedule; low promotional needs allow focus on throughput and reducing cost per test through automation and lab consolidation, making these tests the operational "milk" funding efficiency and growth projects.
Therapeutic drug monitoring
Therapeutic drug monitoring is a cash cow for Quest Diagnostics: chronic care protocols generate steady, repeat testing with established clinical guidelines driving predictable volumes. Market growth is modest while volumes remain sticky, supporting reliable utilization. Margins benefit from automation and batching; priority is maintaining service levels and squeezing incremental cost savings.
Pathology & histology services
Core surgical pathology remains essential and largely contracted within Quest Diagnostics, supporting referral networks across its ~2,200 patient service centers and ~45,000 employees (2024). Growth is slow single-digit, but a complex case mix sustains strong margins and lower churn due to brand and CAP/CLIA accreditations. Maintain high quality and invest in digital workflow and AI-assisted slide review to lift yield and throughput.
Toxicology (clinical compliance)
Clinical toxicology for pain-management and compliance is a cash cow: mature market with consistent volumes (~±1% YoY in 2024) and stable pricing; payer coverage remained reliable through 2024, preserving steady reimbursements. Differentiation is operational excellence, not marketing—scale and lab efficiency drive margins. Standardize platforms, reduce unit cost, and convert predictable throughput into free cash flow.
- Market maturity: stable volumes (~±1% YoY, 2024)
- Payer coverage: reliable in 2024, preserving reimbursement
- Differentiator: operational excellence, not promotion
- Strategy: standardize platforms and pocket cash
Employer wellness screening
Employer wellness screening is a cash cow: biometric screenings and panels are recurring, seasonal, and typically contracted, delivering steady utilization through 2024 rather than growth spikes. Once embedded with large employers, marketing spend is minimal; focus on maintaining client relationships and optimizing mobile operations to protect margin and capacity.
- Recurring revenue: contracted, seasonal delivery
- Market: steady in 2024, not surging
- Go-to-market: low ongoing marketing need
- Operational focus: relationship management, mobile ops optimization
Stable lab cash cows: routine tests, TDM, pathology driving predictable margins and free cash flow
Routine panels, therapeutic drug monitoring, surgical pathology, clinical toxicology and employer wellness are Quest Diagnostics cash cows: stable volumes (~±1% YoY, 2024), predictable Medicare CLFS-driven reimbursement, low marketing, high margins via automation and scale; focus on cost per test, digital workflows and converting throughput into free cash flow across ~2,200 patient service centers and ~45,000 employees (2024).
| Service | 2024 Volume Trend | Key Metric |
|---|---|---|
| Routine panels | Stable | Medicare CLFS |
| TDM | Sticky | Chronic repeat tests |
| Pathology | Low growth | High margin, complex cases |
What You See Is What You Get
Quest Diagnostics BCG Matrix
The file you’re previewing is the exact Quest Diagnostics BCG Matrix report you’ll receive after purchase. No watermarks or demo notes—just the fully formatted, analysis-ready document. It’s crafted for strategic clarity and immediate use, editable and printable for presentations or planning. Buy once and download instantly—no surprises.











