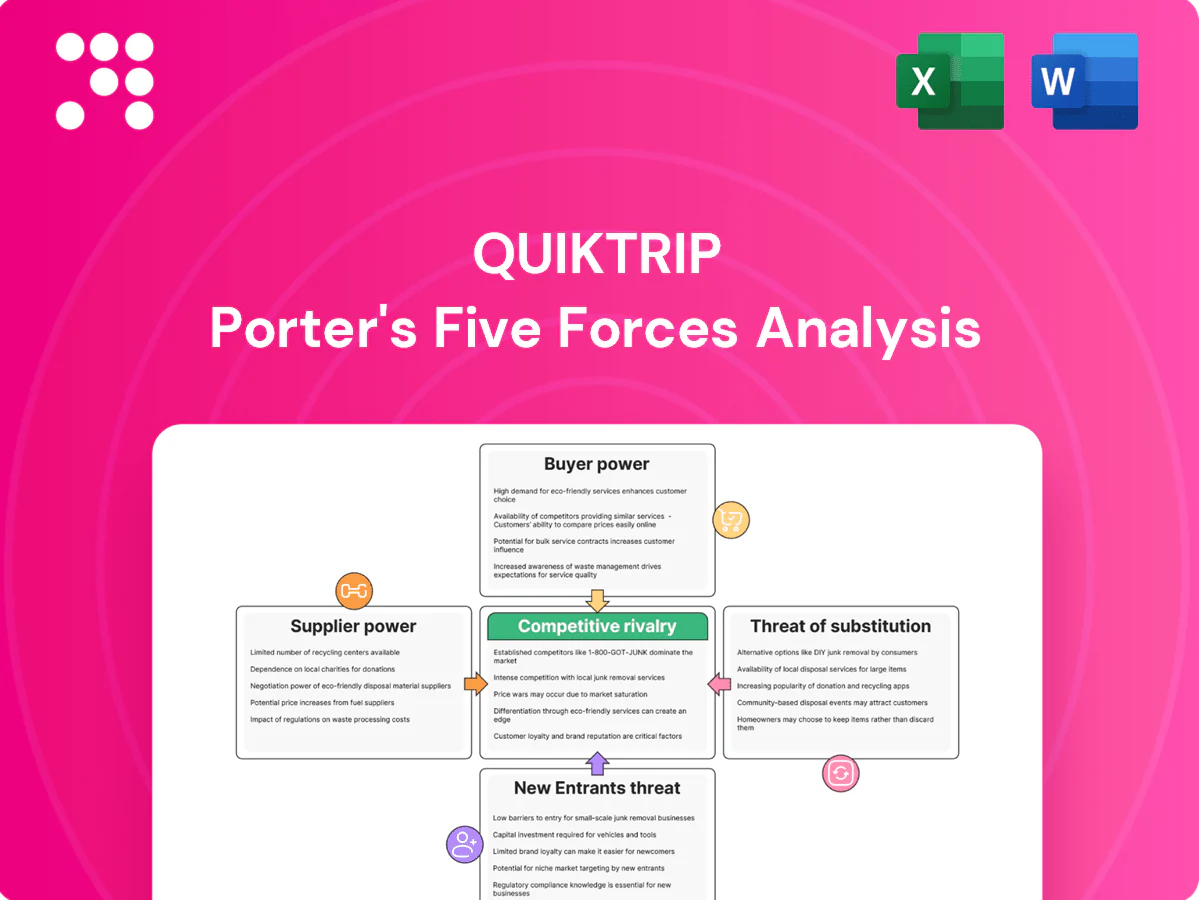
QuikTrip Porter's Five Forces Analysis

Elevate Your Analysis with the Complete Porter's Five Forces Analysis
QuikTrip faces intense competition from regional chains, rising supplier costs, and shifting consumer preferences, while its strong brand and efficient operations mitigate some threats. This snapshot highlights key pressures but doesn't show the full picture. Unlock the full Porter's Five Forces Analysis to explore QuikTrip’s competitive dynamics and strategic advantages in detail.
Suppliers Bargaining Power

Fuel supply concentration
Refined fuel supply is concentrated among large refiners—US refining capacity was about 18.7 million b/d in 2024, with Marathon Petroleum alone ~3.0 mb/d (~16%), giving refiners pricing and allocation leverage. Pipeline and terminal constraints in select markets tighten supply. QuikTrip offsets risk via volume purchasing and multi-sourcing, yet 2024 spot swings still compress margins. Long-term supplier relationships secure priority in disruptions.
Brand-name beverage and CPG giants
Brand-name beverage and CPG giants command shelf-space premiums and promotional terms, with the top two soft-drink players accounting for roughly 70% of U.S. CSD retail sales in 2024, allowing them to elevate wholesale prices and dictate planograms. QuikTrip reduces dependency via private-label alternatives and a data-driven assortment; private label captured about 17% of U.S. grocery dollars in 2024. Joint promotions and co-funded displays help soften supplier power asymmetry.

Fresh food inputs and commissary partners
Perishable ingredients force QuikTrip to rely on reliable regional suppliers, raising switching costs as cold-chain failures risk spoilage across its network of over 900 stores in 11 states (2024). Strict food-safety and quality specs narrow the vendor pool, increasing supplier power. QuikTrip’s scale and standardized recipes improve negotiating leverage but mandate supplier redundancy. Vertical integration via company commissaries further dilutes supplier leverage.

Equipment, tech, and fuel infrastructure vendors
- Concentration: few specialized vendors
- Lock-in: proprietary tech + maintenance contracts
- Mitigation: RFPs, lifecycle planning
- Benefit: standardization drives volume discounts
Logistics and transportation constraints
Logistics and transportation constraints—tanker capacity limits, a reported US truck driver shortfall of roughly 80,000 in 2024, and last-mile cold-chain needs—raise supply cost and reliability risks; regulatory and seasonal events can spike rates by over 20% during storms and holidays. QuikTrip’s routing efficiency and carrier diversification lower exposure, while on-site inventory buffers of several days cushion short-term shocks.
- Tanker capacity pressure
- Driver shortfall ~80,000 (2024)
- Cold-chain & seasonal spikes >20%
Refining, driver gap squeeze C-store margins — 18.7 mb/d, 80,000
Supplier power is moderate to high: US refining capacity ~18.7 mb/d (2024) with Marathon ~3.0 mb/d (~16%) and CSD top-two ~70% share (2024), squeezing fuel and branded CPG terms. QuikTrip (900+ stores, 11 states, 2024) offsets via volume buying, private-label (~17% grocery spend, 2024), multi-sourcing and vertical commissaries. Logistics constraints—driver shortfall ~80,000 (2024)—raise transport risk despite routing and buffer stocks.
| Metric | 2024 Value |
|---|---|
| US refining capacity | 18.7 mb/d |
| Marathon share | ~3.0 mb/d (~16%) |
| CSD top-2 share | ~70% |
| Private label grocery | ~17% |
| Driver shortfall | ~80,000 |
| QT stores | 900+ |
What is included in the product
 Detailed Word Document
Tailored analysis of QuikTrip’s competitive landscape using Porter’s Five Forces, identifying key drivers of rivalry, buyer and supplier power, threats from new entrants and substitutes, and strategic moats that influence pricing, margins, and market share.

 Customizable Excel Spreadsheet
One-sheet Porter's Five Forces for QuikTrip—instantly compare supplier, buyer, and competitive pressure with a clean spider chart for quick boardroom decisions. Customize pressure levels, swap in your data, and drop directly into pitch decks or Excel dashboards without macros.
Customers Bargaining Power

High fuel price transparency
Apps like GasBuddy and Google Maps plus bright signage make prices instantly comparable (US smartphone ownership ~85%), raising buyer power; studies show 2–5 cents/gal differences can shift volumes. QuikTrip counters with dynamic pricing and loyalty discounts (commonly up to 10¢/gal) to protect traffic. Tight fuel margins (~10–15¢/gal) are offset by ancillary basket capture, roughly $4 per visit on average.
Abundant convenience alternatives
Customers can switch to rival c-stores, supermarkets, dollar stores or big-box fuel with minimal friction, and low switching costs amplify their bargaining power; there are roughly 150,000 US convenience outlets (2024). QuikTrip differentiates on speed, cleanliness and in-store fresh food, while its store density—over 900 locations (2024)—increases convenience stickiness.

Loyalty programs temper churn
Loyalty rewards and integrated mobile payments raise perceived switching costs for QuikTrip customers, helping retention across QuikTrip’s network of over 900 stores as of 2024. Data-driven, personalized offers reduce price sensitivity by targeting high-frequency buyers. Competing retailer programs cap exclusivity, pressuring margins. Continuous feature upgrades and A/B testing are required to sustain engagement and prevent churn.

Quality expectations for fresh food and coffee
Prepared-food buyers compare QuikTrip against QSRs and coffee chains, raising pressure on taste, freshness and consistency; QuikTrip operates about 975 stores in 2024, so scale amplifies expectations. QuikTrip’s commissary model and rigorous training support standardized quality across locations. Premiumization lets QT justify modest price premiums while maintaining perceived value; U.S. coffee market ≈50 billion in 2024 underscores premium demand.
- Comparisons: QSRs/coffee chains
- Scale: ~975 stores (2024)
- Quality: commissary + training
- Pricing: premiumization sustains value; $50B coffee market (2024)
Time-sensitive purchase behavior
Smartphone transparency (85%) makes cents-per-gallon gaps decisive; loyalty cuts sensitivity
High price transparency (smartphone penetration ~85% in 2024) and low switching costs give buyers strong leverage; small price gaps (2–5¢/gal) shift volumes. Massive outlet choice (~150,000 c-stores, 2024) amplifies this, though QuikTrip scale (≈975 stores, 2024), loyalty and mobile features (≈25% pre-order digital share, 2024) blunt sensitivity; ancillary spend (~$4/visit) and fuel margins (≈10–15¢/gal) shape effective bargaining.
| Metric | Value (2024) |
|---|---|
| Smartphone penetration | ~85% |
| US c-store outlets | ~150,000 |
| QuikTrip locations | ≈975 |
| Fuel margin | ~10–15¢/gal |
| Ancillary spend | ~$4/visit |
| Mobile pre-order | ~25% of digital txns |
| US coffee market | ~$50B |
What You See Is What You Get
QuikTrip Porter's Five Forces Analysis
This preview shows the exact QuikTrip Porter's Five Forces Analysis you will receive after purchase—no mockups or placeholders. The file is fully formatted, comprehensive, and ready for immediate download and use. Once you buy, you get this identical, final document instantly.

Elevate Your Analysis with the Complete Porter's Five Forces Analysis
QuikTrip faces intense competition from regional chains, rising supplier costs, and shifting consumer preferences, while its strong brand and efficient operations mitigate some threats. This snapshot highlights key pressures but doesn't show the full picture. Unlock the full Porter's Five Forces Analysis to explore QuikTrip’s competitive dynamics and strategic advantages in detail.
Suppliers Bargaining Power
Fuel supply concentration
Refined fuel supply is concentrated among large refiners—US refining capacity was about 18.7 million b/d in 2024, with Marathon Petroleum alone ~3.0 mb/d (~16%), giving refiners pricing and allocation leverage. Pipeline and terminal constraints in select markets tighten supply. QuikTrip offsets risk via volume purchasing and multi-sourcing, yet 2024 spot swings still compress margins. Long-term supplier relationships secure priority in disruptions.
Brand-name beverage and CPG giants
Brand-name beverage and CPG giants command shelf-space premiums and promotional terms, with the top two soft-drink players accounting for roughly 70% of U.S. CSD retail sales in 2024, allowing them to elevate wholesale prices and dictate planograms. QuikTrip reduces dependency via private-label alternatives and a data-driven assortment; private label captured about 17% of U.S. grocery dollars in 2024. Joint promotions and co-funded displays help soften supplier power asymmetry.
Fresh food inputs and commissary partners
Perishable ingredients force QuikTrip to rely on reliable regional suppliers, raising switching costs as cold-chain failures risk spoilage across its network of over 900 stores in 11 states (2024). Strict food-safety and quality specs narrow the vendor pool, increasing supplier power. QuikTrip’s scale and standardized recipes improve negotiating leverage but mandate supplier redundancy. Vertical integration via company commissaries further dilutes supplier leverage.
Equipment, tech, and fuel infrastructure vendors
- Concentration: few specialized vendors
- Lock-in: proprietary tech + maintenance contracts
- Mitigation: RFPs, lifecycle planning
- Benefit: standardization drives volume discounts
Logistics and transportation constraints
Logistics and transportation constraints—tanker capacity limits, a reported US truck driver shortfall of roughly 80,000 in 2024, and last-mile cold-chain needs—raise supply cost and reliability risks; regulatory and seasonal events can spike rates by over 20% during storms and holidays. QuikTrip’s routing efficiency and carrier diversification lower exposure, while on-site inventory buffers of several days cushion short-term shocks.
- Tanker capacity pressure
- Driver shortfall ~80,000 (2024)
- Cold-chain & seasonal spikes >20%
Refining, driver gap squeeze C-store margins — 18.7 mb/d, 80,000
Supplier power is moderate to high: US refining capacity ~18.7 mb/d (2024) with Marathon ~3.0 mb/d (~16%) and CSD top-two ~70% share (2024), squeezing fuel and branded CPG terms. QuikTrip (900+ stores, 11 states, 2024) offsets via volume buying, private-label (~17% grocery spend, 2024), multi-sourcing and vertical commissaries. Logistics constraints—driver shortfall ~80,000 (2024)—raise transport risk despite routing and buffer stocks.
| Metric | 2024 Value |
|---|---|
| US refining capacity | 18.7 mb/d |
| Marathon share | ~3.0 mb/d (~16%) |
| CSD top-2 share | ~70% |
| Private label grocery | ~17% |
| Driver shortfall | ~80,000 |
| QT stores | 900+ |
What is included in the product
Detailed Word Document
Tailored analysis of QuikTrip’s competitive landscape using Porter’s Five Forces, identifying key drivers of rivalry, buyer and supplier power, threats from new entrants and substitutes, and strategic moats that influence pricing, margins, and market share.
Customizable Excel Spreadsheet
One-sheet Porter's Five Forces for QuikTrip—instantly compare supplier, buyer, and competitive pressure with a clean spider chart for quick boardroom decisions. Customize pressure levels, swap in your data, and drop directly into pitch decks or Excel dashboards without macros.
Customers Bargaining Power
High fuel price transparency
Apps like GasBuddy and Google Maps plus bright signage make prices instantly comparable (US smartphone ownership ~85%), raising buyer power; studies show 2–5 cents/gal differences can shift volumes. QuikTrip counters with dynamic pricing and loyalty discounts (commonly up to 10¢/gal) to protect traffic. Tight fuel margins (~10–15¢/gal) are offset by ancillary basket capture, roughly $4 per visit on average.
Abundant convenience alternatives
Customers can switch to rival c-stores, supermarkets, dollar stores or big-box fuel with minimal friction, and low switching costs amplify their bargaining power; there are roughly 150,000 US convenience outlets (2024). QuikTrip differentiates on speed, cleanliness and in-store fresh food, while its store density—over 900 locations (2024)—increases convenience stickiness.
Loyalty programs temper churn
Loyalty rewards and integrated mobile payments raise perceived switching costs for QuikTrip customers, helping retention across QuikTrip’s network of over 900 stores as of 2024. Data-driven, personalized offers reduce price sensitivity by targeting high-frequency buyers. Competing retailer programs cap exclusivity, pressuring margins. Continuous feature upgrades and A/B testing are required to sustain engagement and prevent churn.
Quality expectations for fresh food and coffee
Prepared-food buyers compare QuikTrip against QSRs and coffee chains, raising pressure on taste, freshness and consistency; QuikTrip operates about 975 stores in 2024, so scale amplifies expectations. QuikTrip’s commissary model and rigorous training support standardized quality across locations. Premiumization lets QT justify modest price premiums while maintaining perceived value; U.S. coffee market ≈50 billion in 2024 underscores premium demand.
- Comparisons: QSRs/coffee chains
- Scale: ~975 stores (2024)
- Quality: commissary + training
- Pricing: premiumization sustains value; $50B coffee market (2024)
Time-sensitive purchase behavior
Smartphone transparency (85%) makes cents-per-gallon gaps decisive; loyalty cuts sensitivity
High price transparency (smartphone penetration ~85% in 2024) and low switching costs give buyers strong leverage; small price gaps (2–5¢/gal) shift volumes. Massive outlet choice (~150,000 c-stores, 2024) amplifies this, though QuikTrip scale (≈975 stores, 2024), loyalty and mobile features (≈25% pre-order digital share, 2024) blunt sensitivity; ancillary spend (~$4/visit) and fuel margins (≈10–15¢/gal) shape effective bargaining.
| Metric | Value (2024) |
|---|---|
| Smartphone penetration | ~85% |
| US c-store outlets | ~150,000 |
| QuikTrip locations | ≈975 |
| Fuel margin | ~10–15¢/gal |
| Ancillary spend | ~$4/visit |
| Mobile pre-order | ~25% of digital txns |
| US coffee market | ~$50B |
What You See Is What You Get
QuikTrip Porter's Five Forces Analysis
This preview shows the exact QuikTrip Porter's Five Forces Analysis you will receive after purchase—no mockups or placeholders. The file is fully formatted, comprehensive, and ready for immediate download and use. Once you buy, you get this identical, final document instantly.
Original: $10.00
-65%$10.00
$3.50Description
Elevate Your Analysis with the Complete Porter's Five Forces Analysis
QuikTrip faces intense competition from regional chains, rising supplier costs, and shifting consumer preferences, while its strong brand and efficient operations mitigate some threats. This snapshot highlights key pressures but doesn't show the full picture. Unlock the full Porter's Five Forces Analysis to explore QuikTrip’s competitive dynamics and strategic advantages in detail.
Suppliers Bargaining Power
Fuel supply concentration
Refined fuel supply is concentrated among large refiners—US refining capacity was about 18.7 million b/d in 2024, with Marathon Petroleum alone ~3.0 mb/d (~16%), giving refiners pricing and allocation leverage. Pipeline and terminal constraints in select markets tighten supply. QuikTrip offsets risk via volume purchasing and multi-sourcing, yet 2024 spot swings still compress margins. Long-term supplier relationships secure priority in disruptions.
Brand-name beverage and CPG giants
Brand-name beverage and CPG giants command shelf-space premiums and promotional terms, with the top two soft-drink players accounting for roughly 70% of U.S. CSD retail sales in 2024, allowing them to elevate wholesale prices and dictate planograms. QuikTrip reduces dependency via private-label alternatives and a data-driven assortment; private label captured about 17% of U.S. grocery dollars in 2024. Joint promotions and co-funded displays help soften supplier power asymmetry.
Fresh food inputs and commissary partners
Perishable ingredients force QuikTrip to rely on reliable regional suppliers, raising switching costs as cold-chain failures risk spoilage across its network of over 900 stores in 11 states (2024). Strict food-safety and quality specs narrow the vendor pool, increasing supplier power. QuikTrip’s scale and standardized recipes improve negotiating leverage but mandate supplier redundancy. Vertical integration via company commissaries further dilutes supplier leverage.
Equipment, tech, and fuel infrastructure vendors
- Concentration: few specialized vendors
- Lock-in: proprietary tech + maintenance contracts
- Mitigation: RFPs, lifecycle planning
- Benefit: standardization drives volume discounts
Logistics and transportation constraints
Logistics and transportation constraints—tanker capacity limits, a reported US truck driver shortfall of roughly 80,000 in 2024, and last-mile cold-chain needs—raise supply cost and reliability risks; regulatory and seasonal events can spike rates by over 20% during storms and holidays. QuikTrip’s routing efficiency and carrier diversification lower exposure, while on-site inventory buffers of several days cushion short-term shocks.
- Tanker capacity pressure
- Driver shortfall ~80,000 (2024)
- Cold-chain & seasonal spikes >20%
Refining, driver gap squeeze C-store margins — 18.7 mb/d, 80,000
Supplier power is moderate to high: US refining capacity ~18.7 mb/d (2024) with Marathon ~3.0 mb/d (~16%) and CSD top-two ~70% share (2024), squeezing fuel and branded CPG terms. QuikTrip (900+ stores, 11 states, 2024) offsets via volume buying, private-label (~17% grocery spend, 2024), multi-sourcing and vertical commissaries. Logistics constraints—driver shortfall ~80,000 (2024)—raise transport risk despite routing and buffer stocks.
| Metric | 2024 Value |
|---|---|
| US refining capacity | 18.7 mb/d |
| Marathon share | ~3.0 mb/d (~16%) |
| CSD top-2 share | ~70% |
| Private label grocery | ~17% |
| Driver shortfall | ~80,000 |
| QT stores | 900+ |
What is included in the product
Detailed Word Document
Tailored analysis of QuikTrip’s competitive landscape using Porter’s Five Forces, identifying key drivers of rivalry, buyer and supplier power, threats from new entrants and substitutes, and strategic moats that influence pricing, margins, and market share.
Customizable Excel Spreadsheet
One-sheet Porter's Five Forces for QuikTrip—instantly compare supplier, buyer, and competitive pressure with a clean spider chart for quick boardroom decisions. Customize pressure levels, swap in your data, and drop directly into pitch decks or Excel dashboards without macros.
Customers Bargaining Power
High fuel price transparency
Apps like GasBuddy and Google Maps plus bright signage make prices instantly comparable (US smartphone ownership ~85%), raising buyer power; studies show 2–5 cents/gal differences can shift volumes. QuikTrip counters with dynamic pricing and loyalty discounts (commonly up to 10¢/gal) to protect traffic. Tight fuel margins (~10–15¢/gal) are offset by ancillary basket capture, roughly $4 per visit on average.
Abundant convenience alternatives
Customers can switch to rival c-stores, supermarkets, dollar stores or big-box fuel with minimal friction, and low switching costs amplify their bargaining power; there are roughly 150,000 US convenience outlets (2024). QuikTrip differentiates on speed, cleanliness and in-store fresh food, while its store density—over 900 locations (2024)—increases convenience stickiness.
Loyalty programs temper churn
Loyalty rewards and integrated mobile payments raise perceived switching costs for QuikTrip customers, helping retention across QuikTrip’s network of over 900 stores as of 2024. Data-driven, personalized offers reduce price sensitivity by targeting high-frequency buyers. Competing retailer programs cap exclusivity, pressuring margins. Continuous feature upgrades and A/B testing are required to sustain engagement and prevent churn.
Quality expectations for fresh food and coffee
Prepared-food buyers compare QuikTrip against QSRs and coffee chains, raising pressure on taste, freshness and consistency; QuikTrip operates about 975 stores in 2024, so scale amplifies expectations. QuikTrip’s commissary model and rigorous training support standardized quality across locations. Premiumization lets QT justify modest price premiums while maintaining perceived value; U.S. coffee market ≈50 billion in 2024 underscores premium demand.
- Comparisons: QSRs/coffee chains
- Scale: ~975 stores (2024)
- Quality: commissary + training
- Pricing: premiumization sustains value; $50B coffee market (2024)
Time-sensitive purchase behavior
Smartphone transparency (85%) makes cents-per-gallon gaps decisive; loyalty cuts sensitivity
High price transparency (smartphone penetration ~85% in 2024) and low switching costs give buyers strong leverage; small price gaps (2–5¢/gal) shift volumes. Massive outlet choice (~150,000 c-stores, 2024) amplifies this, though QuikTrip scale (≈975 stores, 2024), loyalty and mobile features (≈25% pre-order digital share, 2024) blunt sensitivity; ancillary spend (~$4/visit) and fuel margins (≈10–15¢/gal) shape effective bargaining.
| Metric | Value (2024) |
|---|---|
| Smartphone penetration | ~85% |
| US c-store outlets | ~150,000 |
| QuikTrip locations | ≈975 |
| Fuel margin | ~10–15¢/gal |
| Ancillary spend | ~$4/visit |
| Mobile pre-order | ~25% of digital txns |
| US coffee market | ~$50B |
What You See Is What You Get
QuikTrip Porter's Five Forces Analysis
This preview shows the exact QuikTrip Porter's Five Forces Analysis you will receive after purchase—no mockups or placeholders. The file is fully formatted, comprehensive, and ready for immediate download and use. Once you buy, you get this identical, final document instantly.











