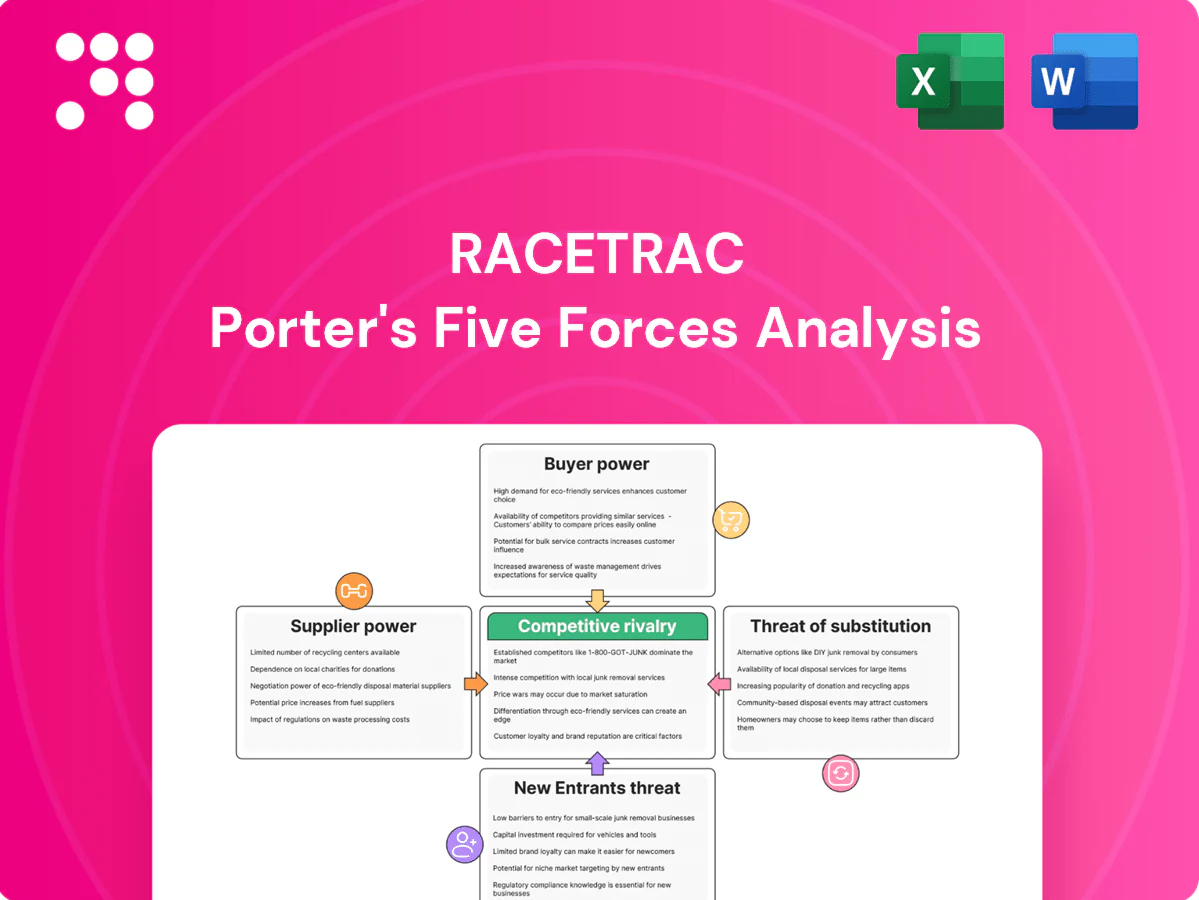
RaceTrac Porter's Five Forces Analysis

Don't Miss the Bigger Picture
This brief Porter's Five Forces snapshot highlights RaceTrac’s competitive landscape—high supplier fragmentation, moderate buyer power, intense rivalry, manageable substitute threats, and barriers deterring new entrants. For force-by-force ratings, visuals, and strategic implications, unlock the full Porter's Five Forces Analysis. Purchase the complete report for consultant-grade insights ready for presentations.
Suppliers Bargaining Power

Concentrated fuel suppliers
Gasoline for RaceTrac is sourced from a relatively concentrated set of refiners—top four U.S. firms controlled about 50% of refining capacity in 2023—boosting supplier leverage on pricing and contractual terms. Contracted supply and access to spot markets buffer risk but do not eliminate exposure; U.S. refinery utilization averaged ~92% in 2024, keeping market tight. Regional pipeline constraints in the South (illustrated by the 2021 Colonial outage) can spike supplier power during disruptions. Diversifying lift points and holding flexible inventory improves negotiating leverage and reduces outage exposure.
Commodity price volatility
Crude and refined product volatility shifts bargaining power to suppliers in tight markets, with US refinery utilization averaging about 90% in 2024, tightening refined product availability. Rapid cost pass-through protects margins but can depress traffic if retail prices rise. Hedging and indexed contracts stabilize input costs yet increase contract complexity. Operational agility and real-time pricing analytics reduce supplier-driven shocks.

Alternative sourcing options
RaceTrac moderates supplier power by sourcing from multiple terminals, traders and branded/unbranded channels, leveraging its >700-store footprint to shift volumes and negotiate better terms. Competitive bidding across suppliers tightens fuel margins and secures service-level commitments. Geographic scale and advanced logistics planning provide rapid fallback routing during regional supply disruptions.

Non-fuel CPG and foodservice
Packaged-goods suppliers for RaceTrac remain numerous, keeping supplier power moderate; private-label penetration in US grocery rose to about 18% in 2023 (NielsenIQ), which helps limit big-brand leverage, though category captains can still dictate planograms and promotional terms.
- Private label ~18% (2023)
- Category captains push promos/planograms
- Local vendors offset national suppliers
- Foodservice fresh items carry higher supplier leverage
- Volume commitments/multi-year contracts reduce costs and supply risk
Payments and infrastructure vendors
Card networks, POS and forecourt equipment vendors wield fee and switching power—U.S. card interchange averages about 1.8% (2024), pressuring margins for fuel and in-store sales across RaceTrac's network of over 650 stores. EMV, PCI and periodic tech upgrades increase dependency and drive hardware/compliance spends of several hundred dollars per terminal. By negotiating network fees at scale and promoting alternative tenders (contactless wallets, store apps) RaceTrac can cut processing costs, while long-term vendor deals trade lower prices for uptime and innovation.
- Interchange pressure: ~1.8% (2024)
- Scale: >650 stores
- Upgrade cost: several hundred $/terminal
- Levers: negotiate fees, alternative tender, long-term SLAs
Refinery 50%, utiliz. 91% squeeze margins; scale limits risk
Suppliers (refiners, card networks, CPG) exert moderate-to-high power: top-4 refiners ~50% capacity (2023) and US refinery utilization ~91% (2024) tighten fuel supply; private-label penetration ~18% (2023) reduces CPG leverage; card interchange ~1.8% (2024) pressures margins; RaceTrac scale (>700 stores) plus multi-sourcing and hedging mitigate supplier risk.
| Supplier | Metric | 2023/2024 |
|---|---|---|
| Refiners | Top-4 share | ~50% (2023) |
| Refinery use | Utilization | ~91% (2024) |
| CPG | Private label | ~18% (2023) |
| Payments | Interchange | ~1.8% (2024) |
What is included in the product
 Detailed Word Document
Tailored Porter's Five Forces analysis for RaceTrac that uncovers key drivers of competition, buyer and supplier power, barriers to entry, and substitute threats impacting pricing and profitability. Detailed, strategic insights identify disruptive forces and defensive advantages to inform investor materials, internal strategy, or academic projects.

 Customizable Excel Spreadsheet
RaceTrac Porter’s Five Forces delivers a clear one-sheet summary of competitive pressures—perfect for rapid site-level or regional decisions—and includes an easy spider chart so teams instantly spot strategic risks without sifting through long reports.
Customers Bargaining Power

High price sensitivity
Fuel buyers are highly price-aware and routinely compare cents-per-gallon across nearby stations.
Small differentials of 2–5 cents per gallon can shift volume quickly in local trade areas.
Transparent price boards and real-time price apps intensify this sensitivity.
Non-fuel offerings and loyalty programs can soften pure price focus, but non-fuel still represented roughly one-third of c‑store revenue in 2024, so price remains decisive.
Low switching costs
Customers face minimal friction to switch to a competitor across the street; RaceTrac operates over 600 convenience stores across the Southeast as of 2024, so close alternatives are common. Mapping apps like Google Maps, with over 1 billion monthly users, and loyalty aggregators increase price and location transparency. Proximity and ingress/egress often decide purchases, especially for quick trips. Maintaining consistent speed, cleanliness, and safety reduces switching.

Loyalty and data programs
Loyalty discounts, app offers and subscriptions create stickiness that reduces buyer power by increasing repeat visits; NACS 2024 notes loyalty members spend about 20% more per visit. Personalized promotions steer baskets to higher-margin categories, while fuel rewards tied to in-store purchases shift value toward bundled spend. Program richness must exceed competitors to prevent churn and negate matching offers.

Segment diversity
Commuters, truck drivers, and convenience shoppers value different attributes; some prioritize speed and fuel price while others focus on fresh food or coffee quality. This heterogeneity fragments buyer power across RaceTrac's network of over 600 stores (2024), reducing uniform bargaining leverage. Tailored assortments and daypart offers capture varied needs and limit aggregate customer pressure.
- Speed/fuel: commuter/trucker priority
- Fresh food/coffee: convenience shoppers
- Over 600 stores (2024) enable localized offers
Local market alternatives
Urban and suburban cores with dense station clusters increase buyer leverage for RaceTrac, while rural sites face lower customer bargaining power due to scarcity; RaceTrac operates ~700 stores (RaceTrac 2024) amid a U.S. retail fueling base of roughly 145,000 stations (EIA 2023). Nearby grocery fuel centers and warehouse clubs expand options and pressure margins, making site selection and micro-market pricing key competitive levers.
- Density: metro clusters raise buyer power
- Scarcity: rural sites reduce leverage
- Competition: grocery/warehouse fuel options
- Strategy: site selection & micro-pricing
2-5¢/gal moves volumes; loyalty lifts spend 20% across ~145k US stations
Fuel buyers are highly price‑sensitive; 2–5¢/gal shifts volumes quickly and apps raise transparency.
Loyalty lifts spend ~20% and reduces churn; RaceTrac ~700 stores (2024) use promos to bundle fuel+in‑store sales.
Urban clusters raise bargaining power; rural scarcity lowers it—US ~145,000 stations (EIA 2023).
| Metric | Value | Source |
|---|---|---|
| RaceTrac stores | ~700 | RaceTrac 2024 |
| Loyalty spend lift | ~20% | NACS 2024 |
| US fuel stations | ~145,000 | EIA 2023 |
What You See Is What You Get
RaceTrac Porter's Five Forces Analysis
This RaceTrac Porter's Five Forces Analysis preview is the exact document you’ll receive after purchase—no placeholders or samples. The full file is professionally formatted, comprehensive, and ready for immediate download and use. Purchase grants instant access to this identical deliverable.

Don't Miss the Bigger Picture
This brief Porter's Five Forces snapshot highlights RaceTrac’s competitive landscape—high supplier fragmentation, moderate buyer power, intense rivalry, manageable substitute threats, and barriers deterring new entrants. For force-by-force ratings, visuals, and strategic implications, unlock the full Porter's Five Forces Analysis. Purchase the complete report for consultant-grade insights ready for presentations.
Suppliers Bargaining Power
Concentrated fuel suppliers
Gasoline for RaceTrac is sourced from a relatively concentrated set of refiners—top four U.S. firms controlled about 50% of refining capacity in 2023—boosting supplier leverage on pricing and contractual terms. Contracted supply and access to spot markets buffer risk but do not eliminate exposure; U.S. refinery utilization averaged ~92% in 2024, keeping market tight. Regional pipeline constraints in the South (illustrated by the 2021 Colonial outage) can spike supplier power during disruptions. Diversifying lift points and holding flexible inventory improves negotiating leverage and reduces outage exposure.
Commodity price volatility
Crude and refined product volatility shifts bargaining power to suppliers in tight markets, with US refinery utilization averaging about 90% in 2024, tightening refined product availability. Rapid cost pass-through protects margins but can depress traffic if retail prices rise. Hedging and indexed contracts stabilize input costs yet increase contract complexity. Operational agility and real-time pricing analytics reduce supplier-driven shocks.
Alternative sourcing options
RaceTrac moderates supplier power by sourcing from multiple terminals, traders and branded/unbranded channels, leveraging its >700-store footprint to shift volumes and negotiate better terms. Competitive bidding across suppliers tightens fuel margins and secures service-level commitments. Geographic scale and advanced logistics planning provide rapid fallback routing during regional supply disruptions.
Non-fuel CPG and foodservice
Packaged-goods suppliers for RaceTrac remain numerous, keeping supplier power moderate; private-label penetration in US grocery rose to about 18% in 2023 (NielsenIQ), which helps limit big-brand leverage, though category captains can still dictate planograms and promotional terms.
- Private label ~18% (2023)
- Category captains push promos/planograms
- Local vendors offset national suppliers
- Foodservice fresh items carry higher supplier leverage
- Volume commitments/multi-year contracts reduce costs and supply risk
Payments and infrastructure vendors
Card networks, POS and forecourt equipment vendors wield fee and switching power—U.S. card interchange averages about 1.8% (2024), pressuring margins for fuel and in-store sales across RaceTrac's network of over 650 stores. EMV, PCI and periodic tech upgrades increase dependency and drive hardware/compliance spends of several hundred dollars per terminal. By negotiating network fees at scale and promoting alternative tenders (contactless wallets, store apps) RaceTrac can cut processing costs, while long-term vendor deals trade lower prices for uptime and innovation.
- Interchange pressure: ~1.8% (2024)
- Scale: >650 stores
- Upgrade cost: several hundred $/terminal
- Levers: negotiate fees, alternative tender, long-term SLAs
Refinery 50%, utiliz. 91% squeeze margins; scale limits risk
Suppliers (refiners, card networks, CPG) exert moderate-to-high power: top-4 refiners ~50% capacity (2023) and US refinery utilization ~91% (2024) tighten fuel supply; private-label penetration ~18% (2023) reduces CPG leverage; card interchange ~1.8% (2024) pressures margins; RaceTrac scale (>700 stores) plus multi-sourcing and hedging mitigate supplier risk.
| Supplier | Metric | 2023/2024 |
|---|---|---|
| Refiners | Top-4 share | ~50% (2023) |
| Refinery use | Utilization | ~91% (2024) |
| CPG | Private label | ~18% (2023) |
| Payments | Interchange | ~1.8% (2024) |
What is included in the product
Detailed Word Document
Tailored Porter's Five Forces analysis for RaceTrac that uncovers key drivers of competition, buyer and supplier power, barriers to entry, and substitute threats impacting pricing and profitability. Detailed, strategic insights identify disruptive forces and defensive advantages to inform investor materials, internal strategy, or academic projects.
Customizable Excel Spreadsheet
RaceTrac Porter’s Five Forces delivers a clear one-sheet summary of competitive pressures—perfect for rapid site-level or regional decisions—and includes an easy spider chart so teams instantly spot strategic risks without sifting through long reports.
Customers Bargaining Power
High price sensitivity
Fuel buyers are highly price-aware and routinely compare cents-per-gallon across nearby stations.
Small differentials of 2–5 cents per gallon can shift volume quickly in local trade areas.
Transparent price boards and real-time price apps intensify this sensitivity.
Non-fuel offerings and loyalty programs can soften pure price focus, but non-fuel still represented roughly one-third of c‑store revenue in 2024, so price remains decisive.
Low switching costs
Customers face minimal friction to switch to a competitor across the street; RaceTrac operates over 600 convenience stores across the Southeast as of 2024, so close alternatives are common. Mapping apps like Google Maps, with over 1 billion monthly users, and loyalty aggregators increase price and location transparency. Proximity and ingress/egress often decide purchases, especially for quick trips. Maintaining consistent speed, cleanliness, and safety reduces switching.
Loyalty and data programs
Loyalty discounts, app offers and subscriptions create stickiness that reduces buyer power by increasing repeat visits; NACS 2024 notes loyalty members spend about 20% more per visit. Personalized promotions steer baskets to higher-margin categories, while fuel rewards tied to in-store purchases shift value toward bundled spend. Program richness must exceed competitors to prevent churn and negate matching offers.
Segment diversity
Commuters, truck drivers, and convenience shoppers value different attributes; some prioritize speed and fuel price while others focus on fresh food or coffee quality. This heterogeneity fragments buyer power across RaceTrac's network of over 600 stores (2024), reducing uniform bargaining leverage. Tailored assortments and daypart offers capture varied needs and limit aggregate customer pressure.
- Speed/fuel: commuter/trucker priority
- Fresh food/coffee: convenience shoppers
- Over 600 stores (2024) enable localized offers
Local market alternatives
Urban and suburban cores with dense station clusters increase buyer leverage for RaceTrac, while rural sites face lower customer bargaining power due to scarcity; RaceTrac operates ~700 stores (RaceTrac 2024) amid a U.S. retail fueling base of roughly 145,000 stations (EIA 2023). Nearby grocery fuel centers and warehouse clubs expand options and pressure margins, making site selection and micro-market pricing key competitive levers.
- Density: metro clusters raise buyer power
- Scarcity: rural sites reduce leverage
- Competition: grocery/warehouse fuel options
- Strategy: site selection & micro-pricing
2-5¢/gal moves volumes; loyalty lifts spend 20% across ~145k US stations
Fuel buyers are highly price‑sensitive; 2–5¢/gal shifts volumes quickly and apps raise transparency.
Loyalty lifts spend ~20% and reduces churn; RaceTrac ~700 stores (2024) use promos to bundle fuel+in‑store sales.
Urban clusters raise bargaining power; rural scarcity lowers it—US ~145,000 stations (EIA 2023).
| Metric | Value | Source |
|---|---|---|
| RaceTrac stores | ~700 | RaceTrac 2024 |
| Loyalty spend lift | ~20% | NACS 2024 |
| US fuel stations | ~145,000 | EIA 2023 |
What You See Is What You Get
RaceTrac Porter's Five Forces Analysis
This RaceTrac Porter's Five Forces Analysis preview is the exact document you’ll receive after purchase—no placeholders or samples. The full file is professionally formatted, comprehensive, and ready for immediate download and use. Purchase grants instant access to this identical deliverable.
Original: $10.00
-65%$10.00
$3.50Description
Don't Miss the Bigger Picture
This brief Porter's Five Forces snapshot highlights RaceTrac’s competitive landscape—high supplier fragmentation, moderate buyer power, intense rivalry, manageable substitute threats, and barriers deterring new entrants. For force-by-force ratings, visuals, and strategic implications, unlock the full Porter's Five Forces Analysis. Purchase the complete report for consultant-grade insights ready for presentations.
Suppliers Bargaining Power
Concentrated fuel suppliers
Gasoline for RaceTrac is sourced from a relatively concentrated set of refiners—top four U.S. firms controlled about 50% of refining capacity in 2023—boosting supplier leverage on pricing and contractual terms. Contracted supply and access to spot markets buffer risk but do not eliminate exposure; U.S. refinery utilization averaged ~92% in 2024, keeping market tight. Regional pipeline constraints in the South (illustrated by the 2021 Colonial outage) can spike supplier power during disruptions. Diversifying lift points and holding flexible inventory improves negotiating leverage and reduces outage exposure.
Commodity price volatility
Crude and refined product volatility shifts bargaining power to suppliers in tight markets, with US refinery utilization averaging about 90% in 2024, tightening refined product availability. Rapid cost pass-through protects margins but can depress traffic if retail prices rise. Hedging and indexed contracts stabilize input costs yet increase contract complexity. Operational agility and real-time pricing analytics reduce supplier-driven shocks.
Alternative sourcing options
RaceTrac moderates supplier power by sourcing from multiple terminals, traders and branded/unbranded channels, leveraging its >700-store footprint to shift volumes and negotiate better terms. Competitive bidding across suppliers tightens fuel margins and secures service-level commitments. Geographic scale and advanced logistics planning provide rapid fallback routing during regional supply disruptions.
Non-fuel CPG and foodservice
Packaged-goods suppliers for RaceTrac remain numerous, keeping supplier power moderate; private-label penetration in US grocery rose to about 18% in 2023 (NielsenIQ), which helps limit big-brand leverage, though category captains can still dictate planograms and promotional terms.
- Private label ~18% (2023)
- Category captains push promos/planograms
- Local vendors offset national suppliers
- Foodservice fresh items carry higher supplier leverage
- Volume commitments/multi-year contracts reduce costs and supply risk
Payments and infrastructure vendors
Card networks, POS and forecourt equipment vendors wield fee and switching power—U.S. card interchange averages about 1.8% (2024), pressuring margins for fuel and in-store sales across RaceTrac's network of over 650 stores. EMV, PCI and periodic tech upgrades increase dependency and drive hardware/compliance spends of several hundred dollars per terminal. By negotiating network fees at scale and promoting alternative tenders (contactless wallets, store apps) RaceTrac can cut processing costs, while long-term vendor deals trade lower prices for uptime and innovation.
- Interchange pressure: ~1.8% (2024)
- Scale: >650 stores
- Upgrade cost: several hundred $/terminal
- Levers: negotiate fees, alternative tender, long-term SLAs
Refinery 50%, utiliz. 91% squeeze margins; scale limits risk
Suppliers (refiners, card networks, CPG) exert moderate-to-high power: top-4 refiners ~50% capacity (2023) and US refinery utilization ~91% (2024) tighten fuel supply; private-label penetration ~18% (2023) reduces CPG leverage; card interchange ~1.8% (2024) pressures margins; RaceTrac scale (>700 stores) plus multi-sourcing and hedging mitigate supplier risk.
| Supplier | Metric | 2023/2024 |
|---|---|---|
| Refiners | Top-4 share | ~50% (2023) |
| Refinery use | Utilization | ~91% (2024) |
| CPG | Private label | ~18% (2023) |
| Payments | Interchange | ~1.8% (2024) |
What is included in the product
Detailed Word Document
Tailored Porter's Five Forces analysis for RaceTrac that uncovers key drivers of competition, buyer and supplier power, barriers to entry, and substitute threats impacting pricing and profitability. Detailed, strategic insights identify disruptive forces and defensive advantages to inform investor materials, internal strategy, or academic projects.
Customizable Excel Spreadsheet
RaceTrac Porter’s Five Forces delivers a clear one-sheet summary of competitive pressures—perfect for rapid site-level or regional decisions—and includes an easy spider chart so teams instantly spot strategic risks without sifting through long reports.
Customers Bargaining Power
High price sensitivity
Fuel buyers are highly price-aware and routinely compare cents-per-gallon across nearby stations.
Small differentials of 2–5 cents per gallon can shift volume quickly in local trade areas.
Transparent price boards and real-time price apps intensify this sensitivity.
Non-fuel offerings and loyalty programs can soften pure price focus, but non-fuel still represented roughly one-third of c‑store revenue in 2024, so price remains decisive.
Low switching costs
Customers face minimal friction to switch to a competitor across the street; RaceTrac operates over 600 convenience stores across the Southeast as of 2024, so close alternatives are common. Mapping apps like Google Maps, with over 1 billion monthly users, and loyalty aggregators increase price and location transparency. Proximity and ingress/egress often decide purchases, especially for quick trips. Maintaining consistent speed, cleanliness, and safety reduces switching.
Loyalty and data programs
Loyalty discounts, app offers and subscriptions create stickiness that reduces buyer power by increasing repeat visits; NACS 2024 notes loyalty members spend about 20% more per visit. Personalized promotions steer baskets to higher-margin categories, while fuel rewards tied to in-store purchases shift value toward bundled spend. Program richness must exceed competitors to prevent churn and negate matching offers.
Segment diversity
Commuters, truck drivers, and convenience shoppers value different attributes; some prioritize speed and fuel price while others focus on fresh food or coffee quality. This heterogeneity fragments buyer power across RaceTrac's network of over 600 stores (2024), reducing uniform bargaining leverage. Tailored assortments and daypart offers capture varied needs and limit aggregate customer pressure.
- Speed/fuel: commuter/trucker priority
- Fresh food/coffee: convenience shoppers
- Over 600 stores (2024) enable localized offers
Local market alternatives
Urban and suburban cores with dense station clusters increase buyer leverage for RaceTrac, while rural sites face lower customer bargaining power due to scarcity; RaceTrac operates ~700 stores (RaceTrac 2024) amid a U.S. retail fueling base of roughly 145,000 stations (EIA 2023). Nearby grocery fuel centers and warehouse clubs expand options and pressure margins, making site selection and micro-market pricing key competitive levers.
- Density: metro clusters raise buyer power
- Scarcity: rural sites reduce leverage
- Competition: grocery/warehouse fuel options
- Strategy: site selection & micro-pricing
2-5¢/gal moves volumes; loyalty lifts spend 20% across ~145k US stations
Fuel buyers are highly price‑sensitive; 2–5¢/gal shifts volumes quickly and apps raise transparency.
Loyalty lifts spend ~20% and reduces churn; RaceTrac ~700 stores (2024) use promos to bundle fuel+in‑store sales.
Urban clusters raise bargaining power; rural scarcity lowers it—US ~145,000 stations (EIA 2023).
| Metric | Value | Source |
|---|---|---|
| RaceTrac stores | ~700 | RaceTrac 2024 |
| Loyalty spend lift | ~20% | NACS 2024 |
| US fuel stations | ~145,000 | EIA 2023 |
What You See Is What You Get
RaceTrac Porter's Five Forces Analysis
This RaceTrac Porter's Five Forces Analysis preview is the exact document you’ll receive after purchase—no placeholders or samples. The full file is professionally formatted, comprehensive, and ready for immediate download and use. Purchase grants instant access to this identical deliverable.











