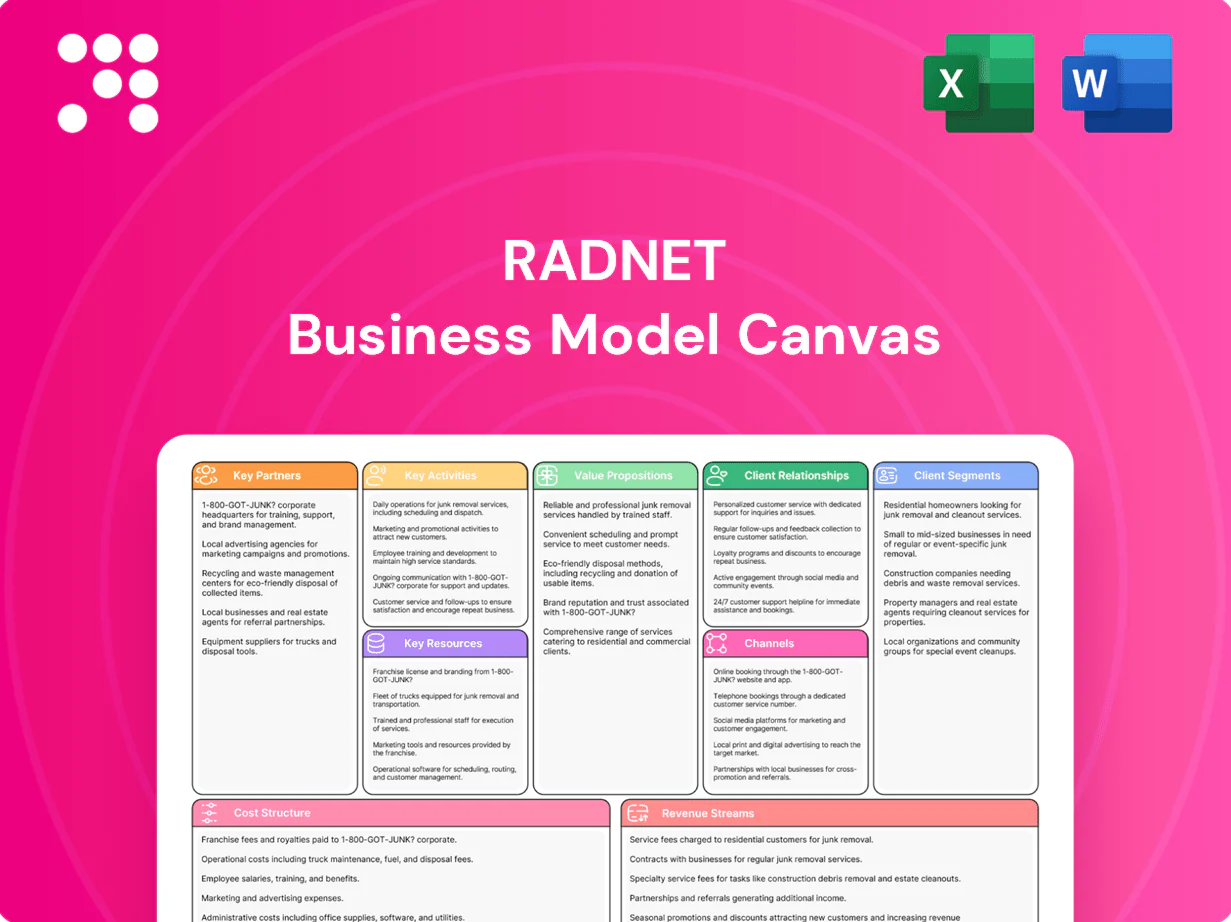
RadNet Business Model Canvas

Unlock the strategic Business Model Canvas for imaging healthcare investors
Unlock RadNet’s strategic blueprint with our Business Model Canvas—clarifying customer segments, value propositions, revenue streams, and cost drivers in a single, actionable page. Perfect for investors and strategists—purchase the full Word/Excel canvas to apply these insights immediately.
Partnerships

Referring Physicians & Clinics
Primary care and specialty physicians generate the majority (>50%) of imaging referrals to RadNet, which operates over 360 outpatient imaging centers nationwide. Strong ties ensure steady volume and appropriate modality selection. RadNet supports referral workflows with easy electronic ordering, rapid report turnaround and direct consult access. Ongoing education and outreach reinforce clinical alignment and loyalty.
Payers & Managed Care Organizations
Payers—commercial insurers, Medicare Advantage, and Medicaid—dictate access and reimbursement; Medicare Advantage enrollment exceeded 30 million in 2023 and Medicaid/CHIP covered roughly 83 million beneficiaries in 2023. Contracting for preferred status and prior-authorization support reduces denials and friction, preserving revenue. Value-based, bundled, and narrow-network deals can shift volume to lower-cost sites. Data sharing improves utilization management and outcomes reporting.

Hospitals & Health Systems
Partnerships, joint ventures, and outsourcing with hospitals provide system-aligned access points, leveraging RadNet’s network of over 300 outpatient imaging centers (2024). Hospitals capture outpatient cost efficiencies while preserving quality through shared protocols. Integrated scheduling and referral pathways streamline patient flow and reduce ED imaging. Co-branding strengthens market reach and improves leverage in payer negotiations.

Imaging OEMs & Service Providers
Imaging OEMs GE, Siemens and Philips supply MRI, CT, PET and mammography systems and represent roughly 70–80% of the global installed base in 2024; scanners range about 1–3 million USD for MRI. Service agreements with 98–99% uptime guarantees and scheduled upgrades sustain image quality and throughput. Calibration partners provide annual or semiannual compliance checks to ensure consistent performance.
- OEMs: GE/Siemens/Philips ~70–80% market share (2024)
- Scanner cost: MRI ~1–3M USD
- Uptime guarantees: 98–99%
- Calibration: annual/semiannual
AI/IT Vendors & Teleradiology
AI developers, PACS/RIS vendors and cloud partners accelerate accuracy and throughput—RadNet (over 350 outpatient centers) leverages 24/7 teleradiology for subspecialty and after-hours reads while integration support cuts manual steps and errors; joint R&D pilots in 2024 validate clinical and operational ROI through measured reductions in turnaround time and improved report consistency.
- AI market 2024: >1B USD adoption momentum
- RadNet footprint: over 350 centers
- Teleradiology: 24/7 subspecialty coverage
- Integration: fewer manual steps, lower error rates
Primary care drives >50% of outpatient imaging referrals; payers, OEMs and AI shape access
Primary care and specialists drive >50% of imaging referrals to RadNet’s ~360 outpatient centers (2024), supported by electronic ordering, fast reports and clinician outreach. Payer contracts (Medicare Advantage >30M enrollees 2023; Medicaid/CHIP ~83M 2023) shape access and reimbursement; value-based/narrow networks shift volume. Hospital JVs, OEMs (GE/Siemens/Philips 70–80% 2024) and AI/teleradiology partners sustain capacity, uptime and 24/7 reads.
| Metric | Value (2024/2023) |
|---|---|
| RadNet centers | ~360 (2024) |
| Referral share | >50% |
| Medicare Advantage | >30M (2023) |
| Medicaid/CHIP | ~83M (2023) |
| OEM market share | 70–80% (2024) |
What is included in the product
 Detailed Word Document
A comprehensive, pre-written Business Model Canvas for RadNet that maps all 9 BMC blocks—customer segments, channels, value propositions, revenue streams, resources, activities, partnerships, cost structure and customer relationships—reflecting real-world operations, competitive advantages and linked SWOT insights; ideal for investor presentations, strategic planning and validation using company-specific data.

 Customizable Excel Spreadsheet
Condenses RadNet’s complex diagnostic imaging services, referral networks, and revenue streams into an editable one-page canvas, saving hours of structuring and enabling teams to quickly align strategy, operations, and growth initiatives.
Activities

Imaging Operations & Workflow
Daily high-throughput imaging across MRI, CT, PET, mammography and ultrasound at RadNet’s network of over 360 centers delivers roughly 3.1 million exams annually (2024), with protocol optimization balancing diagnostic quality and reduced patient dose. Rigorous downtime management and preventive maintenance protect capacity and revenue. Continuous improvement initiatives focus on shortening wait times and enhancing patient experience.
Clinical Interpretation & QA
As of 2024, board-certified radiologists deliver timely, accurate reads across RadNet’s outpatient network, with targeted subspecialty coverage elevating diagnostic quality for complex cases. Robust peer review and discrepancy-tracking programs drive continuous QA and measurable error reduction. Structured reporting and critical-results workflows standardize communication, shorten follow-up times, and reduce clinical and malpractice risk.

Scheduling & Patient Access
Multichannel booking across web, app and call centers at RadNet's network of over 350 outpatient imaging centers lowers barriers to care and boosts conversion. Robust pre-authorization and benefits verification target industry claim denial rates of roughly 5–10%, preserving revenue. SMS reminders and prep instructions, shown to cut no-shows by up to 30%, improve throughput. Patient navigation supports special populations and complex studies, raising completion rates.

Payer Contracting & Revenue Cycle
Payer contracting—negotiating rates, utilization policies, and network status—directly drives RadNet’s imaging margin, while rigorous front-end eligibility checks and precise coding minimize costly rework. Robust denial management combined with analytics improves cash yield and shortens days in accounts receivable. Strict adherence to payer rules and audit-ready documentation protects cash flow and reduces clawbacks.
- Negotiation: focus on rates, utilization, network placement
- Front-end accuracy: eligibility verification, correct coding
- Yield optimization: denial management, analytics
- Compliance: payer rules, documentation to safeguard cash
Technology & AI Enablement
Deploying PACS/RIS with AI triage and dose-management tools raises throughput and efficiency; over 500 FDA-cleared imaging AI tools existed by 2024, supporting faster reads and protocol optimization. Robust data pipelines enable continuous model training and monitoring, while cybersecurity is critical—healthcare breach costs averaged $10.93M in 2023 (IBM). Change management secures clinician adoption and trust.
- PACS/RIS + AI: faster throughput, fewer backlogs
- Data pipelines: continuous training & monitoring
- Cybersecurity: protects PHI, prevents costly downtime
- Change management: clinician adoption & trust
Network of 360 centers performs 3.1M exams annually with AI
RadNet operates ~360 outpatient centers performing ~3.1M exams annually (2024), optimizing protocols to balance quality and dose. Board-certified radiologists deliver subspecialty reads with QA/peer review; payer denials target 5–10% and denial management shortens AR. PACS/RIS plus AI (500+ FDA-cleared tools by 2024) and cybersecurity (avg breach cost $10.93M in 2023) support throughput.
| Metric | 2024 |
|---|---|
| Centers | ~360 |
| Annual exams | ~3.1M |
| Payer denial rate | 5–10% |
| FDA-cleared AI tools | 500+ |
| Avg breach cost (2023) | $10.93M |
Full Document Unlocks After Purchase
Business Model Canvas
The RadNet Business Model Canvas previewed here is the exact document you’ll receive after purchase — not a mockup or sample. When you complete your order, you’ll get the same fully formatted, editable file ready for presentation and analysis in Word and Excel. No surprises, just the complete deliverable as shown.

Unlock the strategic Business Model Canvas for imaging healthcare investors
Unlock RadNet’s strategic blueprint with our Business Model Canvas—clarifying customer segments, value propositions, revenue streams, and cost drivers in a single, actionable page. Perfect for investors and strategists—purchase the full Word/Excel canvas to apply these insights immediately.
Partnerships
Referring Physicians & Clinics
Primary care and specialty physicians generate the majority (>50%) of imaging referrals to RadNet, which operates over 360 outpatient imaging centers nationwide. Strong ties ensure steady volume and appropriate modality selection. RadNet supports referral workflows with easy electronic ordering, rapid report turnaround and direct consult access. Ongoing education and outreach reinforce clinical alignment and loyalty.
Payers & Managed Care Organizations
Payers—commercial insurers, Medicare Advantage, and Medicaid—dictate access and reimbursement; Medicare Advantage enrollment exceeded 30 million in 2023 and Medicaid/CHIP covered roughly 83 million beneficiaries in 2023. Contracting for preferred status and prior-authorization support reduces denials and friction, preserving revenue. Value-based, bundled, and narrow-network deals can shift volume to lower-cost sites. Data sharing improves utilization management and outcomes reporting.
Hospitals & Health Systems
Partnerships, joint ventures, and outsourcing with hospitals provide system-aligned access points, leveraging RadNet’s network of over 300 outpatient imaging centers (2024). Hospitals capture outpatient cost efficiencies while preserving quality through shared protocols. Integrated scheduling and referral pathways streamline patient flow and reduce ED imaging. Co-branding strengthens market reach and improves leverage in payer negotiations.
Imaging OEMs & Service Providers
Imaging OEMs GE, Siemens and Philips supply MRI, CT, PET and mammography systems and represent roughly 70–80% of the global installed base in 2024; scanners range about 1–3 million USD for MRI. Service agreements with 98–99% uptime guarantees and scheduled upgrades sustain image quality and throughput. Calibration partners provide annual or semiannual compliance checks to ensure consistent performance.
- OEMs: GE/Siemens/Philips ~70–80% market share (2024)
- Scanner cost: MRI ~1–3M USD
- Uptime guarantees: 98–99%
- Calibration: annual/semiannual
AI/IT Vendors & Teleradiology
AI developers, PACS/RIS vendors and cloud partners accelerate accuracy and throughput—RadNet (over 350 outpatient centers) leverages 24/7 teleradiology for subspecialty and after-hours reads while integration support cuts manual steps and errors; joint R&D pilots in 2024 validate clinical and operational ROI through measured reductions in turnaround time and improved report consistency.
- AI market 2024: >1B USD adoption momentum
- RadNet footprint: over 350 centers
- Teleradiology: 24/7 subspecialty coverage
- Integration: fewer manual steps, lower error rates
Primary care drives >50% of outpatient imaging referrals; payers, OEMs and AI shape access
Primary care and specialists drive >50% of imaging referrals to RadNet’s ~360 outpatient centers (2024), supported by electronic ordering, fast reports and clinician outreach. Payer contracts (Medicare Advantage >30M enrollees 2023; Medicaid/CHIP ~83M 2023) shape access and reimbursement; value-based/narrow networks shift volume. Hospital JVs, OEMs (GE/Siemens/Philips 70–80% 2024) and AI/teleradiology partners sustain capacity, uptime and 24/7 reads.
| Metric | Value (2024/2023) |
|---|---|
| RadNet centers | ~360 (2024) |
| Referral share | >50% |
| Medicare Advantage | >30M (2023) |
| Medicaid/CHIP | ~83M (2023) |
| OEM market share | 70–80% (2024) |
What is included in the product
Detailed Word Document
A comprehensive, pre-written Business Model Canvas for RadNet that maps all 9 BMC blocks—customer segments, channels, value propositions, revenue streams, resources, activities, partnerships, cost structure and customer relationships—reflecting real-world operations, competitive advantages and linked SWOT insights; ideal for investor presentations, strategic planning and validation using company-specific data.
Customizable Excel Spreadsheet
Condenses RadNet’s complex diagnostic imaging services, referral networks, and revenue streams into an editable one-page canvas, saving hours of structuring and enabling teams to quickly align strategy, operations, and growth initiatives.
Activities
Imaging Operations & Workflow
Daily high-throughput imaging across MRI, CT, PET, mammography and ultrasound at RadNet’s network of over 360 centers delivers roughly 3.1 million exams annually (2024), with protocol optimization balancing diagnostic quality and reduced patient dose. Rigorous downtime management and preventive maintenance protect capacity and revenue. Continuous improvement initiatives focus on shortening wait times and enhancing patient experience.
Clinical Interpretation & QA
As of 2024, board-certified radiologists deliver timely, accurate reads across RadNet’s outpatient network, with targeted subspecialty coverage elevating diagnostic quality for complex cases. Robust peer review and discrepancy-tracking programs drive continuous QA and measurable error reduction. Structured reporting and critical-results workflows standardize communication, shorten follow-up times, and reduce clinical and malpractice risk.
Scheduling & Patient Access
Multichannel booking across web, app and call centers at RadNet's network of over 350 outpatient imaging centers lowers barriers to care and boosts conversion. Robust pre-authorization and benefits verification target industry claim denial rates of roughly 5–10%, preserving revenue. SMS reminders and prep instructions, shown to cut no-shows by up to 30%, improve throughput. Patient navigation supports special populations and complex studies, raising completion rates.
Payer Contracting & Revenue Cycle
Payer contracting—negotiating rates, utilization policies, and network status—directly drives RadNet’s imaging margin, while rigorous front-end eligibility checks and precise coding minimize costly rework. Robust denial management combined with analytics improves cash yield and shortens days in accounts receivable. Strict adherence to payer rules and audit-ready documentation protects cash flow and reduces clawbacks.
- Negotiation: focus on rates, utilization, network placement
- Front-end accuracy: eligibility verification, correct coding
- Yield optimization: denial management, analytics
- Compliance: payer rules, documentation to safeguard cash
Technology & AI Enablement
Deploying PACS/RIS with AI triage and dose-management tools raises throughput and efficiency; over 500 FDA-cleared imaging AI tools existed by 2024, supporting faster reads and protocol optimization. Robust data pipelines enable continuous model training and monitoring, while cybersecurity is critical—healthcare breach costs averaged $10.93M in 2023 (IBM). Change management secures clinician adoption and trust.
- PACS/RIS + AI: faster throughput, fewer backlogs
- Data pipelines: continuous training & monitoring
- Cybersecurity: protects PHI, prevents costly downtime
- Change management: clinician adoption & trust
Network of 360 centers performs 3.1M exams annually with AI
RadNet operates ~360 outpatient centers performing ~3.1M exams annually (2024), optimizing protocols to balance quality and dose. Board-certified radiologists deliver subspecialty reads with QA/peer review; payer denials target 5–10% and denial management shortens AR. PACS/RIS plus AI (500+ FDA-cleared tools by 2024) and cybersecurity (avg breach cost $10.93M in 2023) support throughput.
| Metric | 2024 |
|---|---|
| Centers | ~360 |
| Annual exams | ~3.1M |
| Payer denial rate | 5–10% |
| FDA-cleared AI tools | 500+ |
| Avg breach cost (2023) | $10.93M |
Full Document Unlocks After Purchase
Business Model Canvas
The RadNet Business Model Canvas previewed here is the exact document you’ll receive after purchase — not a mockup or sample. When you complete your order, you’ll get the same fully formatted, editable file ready for presentation and analysis in Word and Excel. No surprises, just the complete deliverable as shown.
Original: $10.00
-65%$10.00
$3.50Description
Unlock the strategic Business Model Canvas for imaging healthcare investors
Unlock RadNet’s strategic blueprint with our Business Model Canvas—clarifying customer segments, value propositions, revenue streams, and cost drivers in a single, actionable page. Perfect for investors and strategists—purchase the full Word/Excel canvas to apply these insights immediately.
Partnerships
Referring Physicians & Clinics
Primary care and specialty physicians generate the majority (>50%) of imaging referrals to RadNet, which operates over 360 outpatient imaging centers nationwide. Strong ties ensure steady volume and appropriate modality selection. RadNet supports referral workflows with easy electronic ordering, rapid report turnaround and direct consult access. Ongoing education and outreach reinforce clinical alignment and loyalty.
Payers & Managed Care Organizations
Payers—commercial insurers, Medicare Advantage, and Medicaid—dictate access and reimbursement; Medicare Advantage enrollment exceeded 30 million in 2023 and Medicaid/CHIP covered roughly 83 million beneficiaries in 2023. Contracting for preferred status and prior-authorization support reduces denials and friction, preserving revenue. Value-based, bundled, and narrow-network deals can shift volume to lower-cost sites. Data sharing improves utilization management and outcomes reporting.
Hospitals & Health Systems
Partnerships, joint ventures, and outsourcing with hospitals provide system-aligned access points, leveraging RadNet’s network of over 300 outpatient imaging centers (2024). Hospitals capture outpatient cost efficiencies while preserving quality through shared protocols. Integrated scheduling and referral pathways streamline patient flow and reduce ED imaging. Co-branding strengthens market reach and improves leverage in payer negotiations.
Imaging OEMs & Service Providers
Imaging OEMs GE, Siemens and Philips supply MRI, CT, PET and mammography systems and represent roughly 70–80% of the global installed base in 2024; scanners range about 1–3 million USD for MRI. Service agreements with 98–99% uptime guarantees and scheduled upgrades sustain image quality and throughput. Calibration partners provide annual or semiannual compliance checks to ensure consistent performance.
- OEMs: GE/Siemens/Philips ~70–80% market share (2024)
- Scanner cost: MRI ~1–3M USD
- Uptime guarantees: 98–99%
- Calibration: annual/semiannual
AI/IT Vendors & Teleradiology
AI developers, PACS/RIS vendors and cloud partners accelerate accuracy and throughput—RadNet (over 350 outpatient centers) leverages 24/7 teleradiology for subspecialty and after-hours reads while integration support cuts manual steps and errors; joint R&D pilots in 2024 validate clinical and operational ROI through measured reductions in turnaround time and improved report consistency.
- AI market 2024: >1B USD adoption momentum
- RadNet footprint: over 350 centers
- Teleradiology: 24/7 subspecialty coverage
- Integration: fewer manual steps, lower error rates
Primary care drives >50% of outpatient imaging referrals; payers, OEMs and AI shape access
Primary care and specialists drive >50% of imaging referrals to RadNet’s ~360 outpatient centers (2024), supported by electronic ordering, fast reports and clinician outreach. Payer contracts (Medicare Advantage >30M enrollees 2023; Medicaid/CHIP ~83M 2023) shape access and reimbursement; value-based/narrow networks shift volume. Hospital JVs, OEMs (GE/Siemens/Philips 70–80% 2024) and AI/teleradiology partners sustain capacity, uptime and 24/7 reads.
| Metric | Value (2024/2023) |
|---|---|
| RadNet centers | ~360 (2024) |
| Referral share | >50% |
| Medicare Advantage | >30M (2023) |
| Medicaid/CHIP | ~83M (2023) |
| OEM market share | 70–80% (2024) |
What is included in the product
Detailed Word Document
A comprehensive, pre-written Business Model Canvas for RadNet that maps all 9 BMC blocks—customer segments, channels, value propositions, revenue streams, resources, activities, partnerships, cost structure and customer relationships—reflecting real-world operations, competitive advantages and linked SWOT insights; ideal for investor presentations, strategic planning and validation using company-specific data.
Customizable Excel Spreadsheet
Condenses RadNet’s complex diagnostic imaging services, referral networks, and revenue streams into an editable one-page canvas, saving hours of structuring and enabling teams to quickly align strategy, operations, and growth initiatives.
Activities
Imaging Operations & Workflow
Daily high-throughput imaging across MRI, CT, PET, mammography and ultrasound at RadNet’s network of over 360 centers delivers roughly 3.1 million exams annually (2024), with protocol optimization balancing diagnostic quality and reduced patient dose. Rigorous downtime management and preventive maintenance protect capacity and revenue. Continuous improvement initiatives focus on shortening wait times and enhancing patient experience.
Clinical Interpretation & QA
As of 2024, board-certified radiologists deliver timely, accurate reads across RadNet’s outpatient network, with targeted subspecialty coverage elevating diagnostic quality for complex cases. Robust peer review and discrepancy-tracking programs drive continuous QA and measurable error reduction. Structured reporting and critical-results workflows standardize communication, shorten follow-up times, and reduce clinical and malpractice risk.
Scheduling & Patient Access
Multichannel booking across web, app and call centers at RadNet's network of over 350 outpatient imaging centers lowers barriers to care and boosts conversion. Robust pre-authorization and benefits verification target industry claim denial rates of roughly 5–10%, preserving revenue. SMS reminders and prep instructions, shown to cut no-shows by up to 30%, improve throughput. Patient navigation supports special populations and complex studies, raising completion rates.
Payer Contracting & Revenue Cycle
Payer contracting—negotiating rates, utilization policies, and network status—directly drives RadNet’s imaging margin, while rigorous front-end eligibility checks and precise coding minimize costly rework. Robust denial management combined with analytics improves cash yield and shortens days in accounts receivable. Strict adherence to payer rules and audit-ready documentation protects cash flow and reduces clawbacks.
- Negotiation: focus on rates, utilization, network placement
- Front-end accuracy: eligibility verification, correct coding
- Yield optimization: denial management, analytics
- Compliance: payer rules, documentation to safeguard cash
Technology & AI Enablement
Deploying PACS/RIS with AI triage and dose-management tools raises throughput and efficiency; over 500 FDA-cleared imaging AI tools existed by 2024, supporting faster reads and protocol optimization. Robust data pipelines enable continuous model training and monitoring, while cybersecurity is critical—healthcare breach costs averaged $10.93M in 2023 (IBM). Change management secures clinician adoption and trust.
- PACS/RIS + AI: faster throughput, fewer backlogs
- Data pipelines: continuous training & monitoring
- Cybersecurity: protects PHI, prevents costly downtime
- Change management: clinician adoption & trust
Network of 360 centers performs 3.1M exams annually with AI
RadNet operates ~360 outpatient centers performing ~3.1M exams annually (2024), optimizing protocols to balance quality and dose. Board-certified radiologists deliver subspecialty reads with QA/peer review; payer denials target 5–10% and denial management shortens AR. PACS/RIS plus AI (500+ FDA-cleared tools by 2024) and cybersecurity (avg breach cost $10.93M in 2023) support throughput.
| Metric | 2024 |
|---|---|
| Centers | ~360 |
| Annual exams | ~3.1M |
| Payer denial rate | 5–10% |
| FDA-cleared AI tools | 500+ |
| Avg breach cost (2023) | $10.93M |
Full Document Unlocks After Purchase
Business Model Canvas
The RadNet Business Model Canvas previewed here is the exact document you’ll receive after purchase — not a mockup or sample. When you complete your order, you’ll get the same fully formatted, editable file ready for presentation and analysis in Word and Excel. No surprises, just the complete deliverable as shown.











