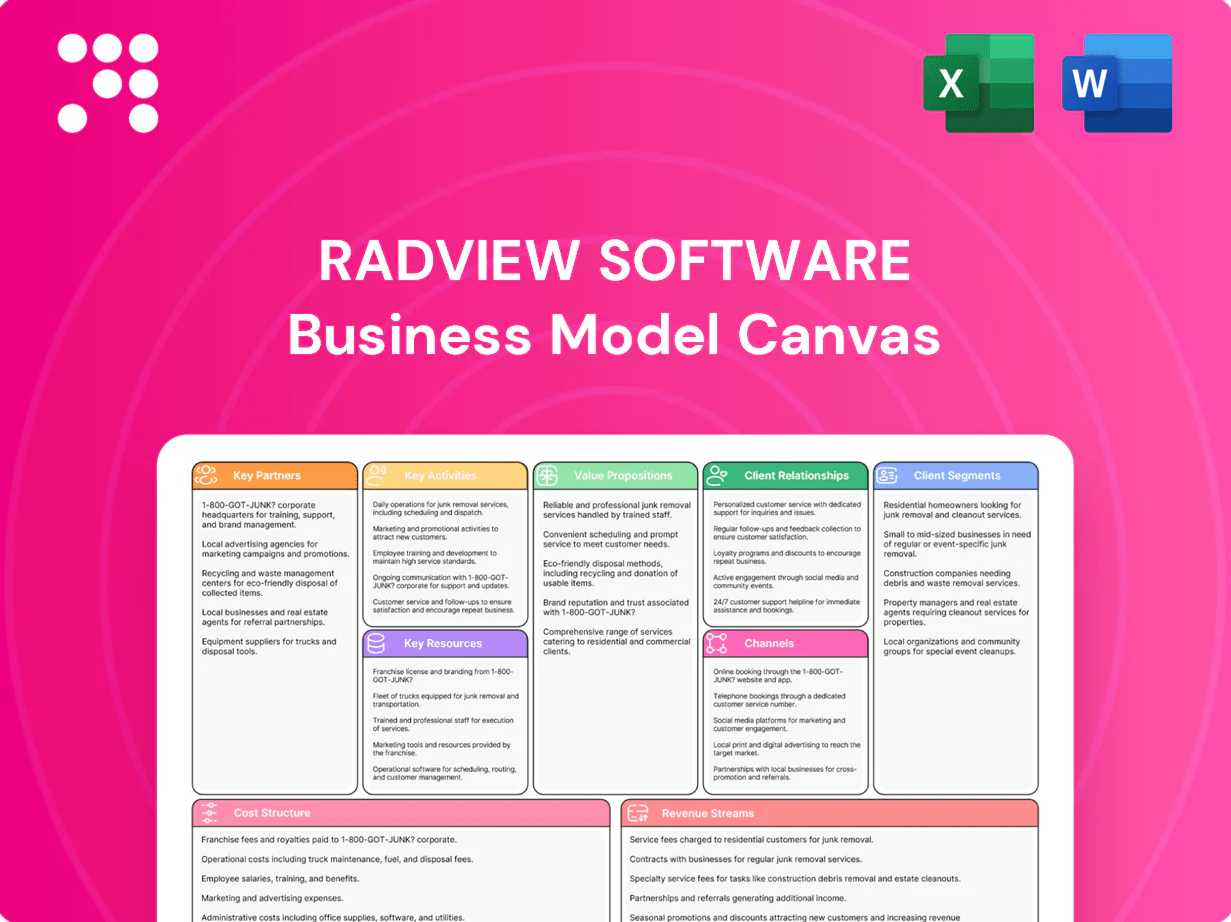
RadView Software Business Model Canvas

Strategic Business Model Canvas for Web Testing and Performance Software
Unlock the strategic blueprint behind RadView Software with our concise Business Model Canvas—three to five sentences that reveal core value propositions, revenue streams, and growth levers. This snapshot highlights key partnerships and scalable activities that drive market traction. Purchase the full, editable Canvas to get section-by-section insights and templates ready for action.
Partnerships

Cloud providers (AWS, Azure, GCP)
Partnering with hyperscalers (AWS ~32% market share, Microsoft Azure ~23%, Google Cloud ~11% in 2024) enables elastic load generation and regional test coverage across 30+ regions and 90+ availability zones, supporting global scale tests. Joint reference architectures and marketplace listings shorten procurement cycles. Co-marketing and credits programs can cut customer acquisition costs and test spend by up to ~20%. Technical alignment ensures network, autoscaling, and cost controls operate seamlessly.
DevOps & CI/CD platforms
Integrations with Jenkins, GitLab, GitHub Actions and Azure DevOps enable RadView to push shift-left performance testing into developers’ pipelines; native plugins and REST APIs allow automated test triggers and reporting. Platform partners collectively served over 100 million developers in 2024, expanding addressable engineering teams via co-selling motions. Continuous roadmap alignment ensures compatibility with evolving CI standards and reduces integration churn.

APM/Observability vendors
Align with Datadog (900+ integrations), New Relic, Dynatrace and OpenTelemetry to deliver end-to-end diagnostics that correlate load test events with traces, metrics and logs for pinpointing bottlenecks.
Joint dashboards reduce triage time and deepen RCA by merging synthetic load data with live telemetry; OpenTelemetry adoption reached about 70% of observability users in 2024.
These partnerships enable bundled offerings and mutual referrals, converting faster into pipeline and expanding go-to-market reach.

Systems integrators & performance consultancies
Systems integrators and performance consultancies enable SIs to deliver test design, execution, and performance tuning services for enterprise-scale projects, using shared playbooks to accelerate adoption and value realization; certifications build a skilled partner bench for large programs, while revenue sharing and co-delivery scale capacity without adding headcount.
- Enablement: SI-led test design & tuning
- Playbooks: faster enterprise rollout
- Certs: scalable partner bench for large programs
- Commercials: revenue share & co-delivery to expand scale
Browser/device labs & network/CDN partners
RadView partners with BrowserStack (2,000+ real devices in 2024) and Sauce Labs (800+ browser/OS combos in 2024) to run true-browser performance scenarios, while coordinating with CDNs and edge networks to emulate realistic traffic paths and geographic routing. Joint tests validate caching behavior, routing decisions and WAF rules under load, improving diagnostic fidelity and reducing mean-time-to-resolution.
- BrowserStack: 2,000+ real devices (2024)
- Sauce Labs: 800+ browser/OS combos (2024)
- CDN/edge integration: validates caching, routing, WAF under load
- Outcome: higher realism and faster diagnostics
Global automated load testing trims spend by 20% via hyperscalers & CI/CD
RadView leverages hyperscalers (AWS 32%/Azure 23%/GCP 11% in 2024), CI/CD vendors, observability firms (OpenTelemetry ~70% adoption) and browser farms to deliver global, automated, end-to-end load testing with faster procurement and ~20% lower test spend. SIs and consultancies scale delivery via playbooks, certifications and revenue share, accelerating enterprise rollouts. Integrations drive shifted-left testing across 100M+ developers in 2024.
| Partner | Role | 2024 metric | Impact |
|---|---|---|---|
| AWS/Azure/GCP | Load fabric | 32%/23%/11% market share | Global scale, regional coverage |
| CI/CD (GitHub/Jenkins) | Shift-left | 100M+ devs | Automated pipelines |
| BrowserStack/Sauce | Real-browser | 2,000/800 devices | Higher realism |
What is included in the product
 Detailed Word Document
A concise, pre-written Business Model Canvas for RadView Software detailing customer segments, channels, value propositions and revenue streams across the 9 classic BMC blocks, aligned with real-world operations and growth plans. Ideal for investor pitches and strategic planning, it includes competitive analysis and SWOT-linked insights to support validation and decision-making.

 Customizable Excel Spreadsheet
High-level view of RadView Software’s business model with editable cells, condensing strategy into a one-page snapshot that saves hours of formatting and enables quick team collaboration and board-ready presentations.
Activities

Engine & platform R&D
Design scalable load generators, protocol handlers and results pipelines to emulate thousands to millions of virtual users while optimizing concurrency and cost efficiency; load-test realism mirrors production traffic patterns. Maintain resilience across multi-region cloud and on-prem deployments to meet common 99.95%–99.99% SLAs. Continuously benchmark against industry workloads and published 2024 graphs for traffic mixes and latency percentiles.
Product development & UX
Build scenario designers, dashboards, and reporting workflows that scale to enterprise needs, reflecting 2024 demand for faster insights. Simplify complex test authoring with templates and versioning to cut iteration cycles by up to 30% in high‑automation teams. Deliver intuitive correlation and bottleneck insights for rapid root‑cause analysis. Prioritize collaboration features so cross‑functional teams can co-author and review in real time.

Integrations & APIs
Develop robust REST/CLI/SDK interfaces for automation, targeting sub-100ms API response SLAs and client libraries in 5 major languages; maintain connectors for CI/CD, APM, and ticketing tools to support enterprises where ~70% use automated pipelines. Ensure backward compatibility, OAuth2/mTLS authentication and versioned APIs to minimize churn. Publish code examples and Terraform modules to accelerate adoption and reduce integration time by weeks.

Customer success & support
Customer success delivers onboarding, test-plan reviews and best-practice playbooks; average onboarding is 10 days (2024) with test reviews reducing false positives. SLAs include 4-hour response and 99.95% uptime targets, plus performance tuning clinics and incident assistance. Feedback loops prioritize roadmap items and measure outcomes via time-to-detect (improved ~35% in 2024) and release velocity (+20%).
- Onboarding: 10 days
- SLA: 4-hour response, 99.95% uptime
- Outcomes: time-to-detect -35%, release velocity +20%
- Activities: reviews, clinics, incident support, feedback→roadmap
Security, compliance & reliability
Implement robust data handling, encryption and tenancy isolation while pursuing enterprise certifications such as SOC 2 and ISO 27001 and conducting regular audits; run scheduled chaos and reliability tests on the platform; maintain incident response playbooks and transparent status communications with a 99.95% uptime target (≈4.38 hours downtime/year).
- Data encryption at rest and in transit
- SOC 2 / ISO 27001 audits
- Chaos engineering for resilience
- Incident response + public status SLAs
Multi-region testing: sub-100ms APIs, 99.95% SLA, 10d onboarding
Design/operate scalable load generators and realistic scenarios; maintain multi‑region resilience and 99.95% uptime. Deliver dashboards, SDKs (5 languages), CI/CD connectors, sub‑100ms APIs, and onboarding (10 days) with 4‑hour SLA to reduce time‑to‑detect 35% and boost release velocity 20% (2024).
| Metric | Value |
|---|---|
| Uptime SLA | 99.95% |
| Onboarding | 10 days |
| Time‑to‑detect | -35% |
| Release velocity | +20% |
| API latency | <100ms |
Preview Before You Purchase
Business Model Canvas
The document you're previewing is the exact RadView Software Business Model Canvas you'll receive after purchase. It's not a mockup—this live preview mirrors the full deliverable, formatted and structured identically. After buying, you'll download the complete, editable Word and Excel files with all content included.

Strategic Business Model Canvas for Web Testing and Performance Software
Unlock the strategic blueprint behind RadView Software with our concise Business Model Canvas—three to five sentences that reveal core value propositions, revenue streams, and growth levers. This snapshot highlights key partnerships and scalable activities that drive market traction. Purchase the full, editable Canvas to get section-by-section insights and templates ready for action.
Partnerships
Cloud providers (AWS, Azure, GCP)
Partnering with hyperscalers (AWS ~32% market share, Microsoft Azure ~23%, Google Cloud ~11% in 2024) enables elastic load generation and regional test coverage across 30+ regions and 90+ availability zones, supporting global scale tests. Joint reference architectures and marketplace listings shorten procurement cycles. Co-marketing and credits programs can cut customer acquisition costs and test spend by up to ~20%. Technical alignment ensures network, autoscaling, and cost controls operate seamlessly.
DevOps & CI/CD platforms
Integrations with Jenkins, GitLab, GitHub Actions and Azure DevOps enable RadView to push shift-left performance testing into developers’ pipelines; native plugins and REST APIs allow automated test triggers and reporting. Platform partners collectively served over 100 million developers in 2024, expanding addressable engineering teams via co-selling motions. Continuous roadmap alignment ensures compatibility with evolving CI standards and reduces integration churn.
APM/Observability vendors
Align with Datadog (900+ integrations), New Relic, Dynatrace and OpenTelemetry to deliver end-to-end diagnostics that correlate load test events with traces, metrics and logs for pinpointing bottlenecks.
Joint dashboards reduce triage time and deepen RCA by merging synthetic load data with live telemetry; OpenTelemetry adoption reached about 70% of observability users in 2024.
These partnerships enable bundled offerings and mutual referrals, converting faster into pipeline and expanding go-to-market reach.
Systems integrators & performance consultancies
Systems integrators and performance consultancies enable SIs to deliver test design, execution, and performance tuning services for enterprise-scale projects, using shared playbooks to accelerate adoption and value realization; certifications build a skilled partner bench for large programs, while revenue sharing and co-delivery scale capacity without adding headcount.
- Enablement: SI-led test design & tuning
- Playbooks: faster enterprise rollout
- Certs: scalable partner bench for large programs
- Commercials: revenue share & co-delivery to expand scale
Browser/device labs & network/CDN partners
RadView partners with BrowserStack (2,000+ real devices in 2024) and Sauce Labs (800+ browser/OS combos in 2024) to run true-browser performance scenarios, while coordinating with CDNs and edge networks to emulate realistic traffic paths and geographic routing. Joint tests validate caching behavior, routing decisions and WAF rules under load, improving diagnostic fidelity and reducing mean-time-to-resolution.
- BrowserStack: 2,000+ real devices (2024)
- Sauce Labs: 800+ browser/OS combos (2024)
- CDN/edge integration: validates caching, routing, WAF under load
- Outcome: higher realism and faster diagnostics
Global automated load testing trims spend by 20% via hyperscalers & CI/CD
RadView leverages hyperscalers (AWS 32%/Azure 23%/GCP 11% in 2024), CI/CD vendors, observability firms (OpenTelemetry ~70% adoption) and browser farms to deliver global, automated, end-to-end load testing with faster procurement and ~20% lower test spend. SIs and consultancies scale delivery via playbooks, certifications and revenue share, accelerating enterprise rollouts. Integrations drive shifted-left testing across 100M+ developers in 2024.
| Partner | Role | 2024 metric | Impact |
|---|---|---|---|
| AWS/Azure/GCP | Load fabric | 32%/23%/11% market share | Global scale, regional coverage |
| CI/CD (GitHub/Jenkins) | Shift-left | 100M+ devs | Automated pipelines |
| BrowserStack/Sauce | Real-browser | 2,000/800 devices | Higher realism |
What is included in the product
Detailed Word Document
A concise, pre-written Business Model Canvas for RadView Software detailing customer segments, channels, value propositions and revenue streams across the 9 classic BMC blocks, aligned with real-world operations and growth plans. Ideal for investor pitches and strategic planning, it includes competitive analysis and SWOT-linked insights to support validation and decision-making.
Customizable Excel Spreadsheet
High-level view of RadView Software’s business model with editable cells, condensing strategy into a one-page snapshot that saves hours of formatting and enables quick team collaboration and board-ready presentations.
Activities
Engine & platform R&D
Design scalable load generators, protocol handlers and results pipelines to emulate thousands to millions of virtual users while optimizing concurrency and cost efficiency; load-test realism mirrors production traffic patterns. Maintain resilience across multi-region cloud and on-prem deployments to meet common 99.95%–99.99% SLAs. Continuously benchmark against industry workloads and published 2024 graphs for traffic mixes and latency percentiles.
Product development & UX
Build scenario designers, dashboards, and reporting workflows that scale to enterprise needs, reflecting 2024 demand for faster insights. Simplify complex test authoring with templates and versioning to cut iteration cycles by up to 30% in high‑automation teams. Deliver intuitive correlation and bottleneck insights for rapid root‑cause analysis. Prioritize collaboration features so cross‑functional teams can co-author and review in real time.
Integrations & APIs
Develop robust REST/CLI/SDK interfaces for automation, targeting sub-100ms API response SLAs and client libraries in 5 major languages; maintain connectors for CI/CD, APM, and ticketing tools to support enterprises where ~70% use automated pipelines. Ensure backward compatibility, OAuth2/mTLS authentication and versioned APIs to minimize churn. Publish code examples and Terraform modules to accelerate adoption and reduce integration time by weeks.
Customer success & support
Customer success delivers onboarding, test-plan reviews and best-practice playbooks; average onboarding is 10 days (2024) with test reviews reducing false positives. SLAs include 4-hour response and 99.95% uptime targets, plus performance tuning clinics and incident assistance. Feedback loops prioritize roadmap items and measure outcomes via time-to-detect (improved ~35% in 2024) and release velocity (+20%).
- Onboarding: 10 days
- SLA: 4-hour response, 99.95% uptime
- Outcomes: time-to-detect -35%, release velocity +20%
- Activities: reviews, clinics, incident support, feedback→roadmap
Security, compliance & reliability
Implement robust data handling, encryption and tenancy isolation while pursuing enterprise certifications such as SOC 2 and ISO 27001 and conducting regular audits; run scheduled chaos and reliability tests on the platform; maintain incident response playbooks and transparent status communications with a 99.95% uptime target (≈4.38 hours downtime/year).
- Data encryption at rest and in transit
- SOC 2 / ISO 27001 audits
- Chaos engineering for resilience
- Incident response + public status SLAs
Multi-region testing: sub-100ms APIs, 99.95% SLA, 10d onboarding
Design/operate scalable load generators and realistic scenarios; maintain multi‑region resilience and 99.95% uptime. Deliver dashboards, SDKs (5 languages), CI/CD connectors, sub‑100ms APIs, and onboarding (10 days) with 4‑hour SLA to reduce time‑to‑detect 35% and boost release velocity 20% (2024).
| Metric | Value |
|---|---|
| Uptime SLA | 99.95% |
| Onboarding | 10 days |
| Time‑to‑detect | -35% |
| Release velocity | +20% |
| API latency | <100ms |
Preview Before You Purchase
Business Model Canvas
The document you're previewing is the exact RadView Software Business Model Canvas you'll receive after purchase. It's not a mockup—this live preview mirrors the full deliverable, formatted and structured identically. After buying, you'll download the complete, editable Word and Excel files with all content included.
Description
Strategic Business Model Canvas for Web Testing and Performance Software
Unlock the strategic blueprint behind RadView Software with our concise Business Model Canvas—three to five sentences that reveal core value propositions, revenue streams, and growth levers. This snapshot highlights key partnerships and scalable activities that drive market traction. Purchase the full, editable Canvas to get section-by-section insights and templates ready for action.
Partnerships
Cloud providers (AWS, Azure, GCP)
Partnering with hyperscalers (AWS ~32% market share, Microsoft Azure ~23%, Google Cloud ~11% in 2024) enables elastic load generation and regional test coverage across 30+ regions and 90+ availability zones, supporting global scale tests. Joint reference architectures and marketplace listings shorten procurement cycles. Co-marketing and credits programs can cut customer acquisition costs and test spend by up to ~20%. Technical alignment ensures network, autoscaling, and cost controls operate seamlessly.
DevOps & CI/CD platforms
Integrations with Jenkins, GitLab, GitHub Actions and Azure DevOps enable RadView to push shift-left performance testing into developers’ pipelines; native plugins and REST APIs allow automated test triggers and reporting. Platform partners collectively served over 100 million developers in 2024, expanding addressable engineering teams via co-selling motions. Continuous roadmap alignment ensures compatibility with evolving CI standards and reduces integration churn.
APM/Observability vendors
Align with Datadog (900+ integrations), New Relic, Dynatrace and OpenTelemetry to deliver end-to-end diagnostics that correlate load test events with traces, metrics and logs for pinpointing bottlenecks.
Joint dashboards reduce triage time and deepen RCA by merging synthetic load data with live telemetry; OpenTelemetry adoption reached about 70% of observability users in 2024.
These partnerships enable bundled offerings and mutual referrals, converting faster into pipeline and expanding go-to-market reach.
Systems integrators & performance consultancies
Systems integrators and performance consultancies enable SIs to deliver test design, execution, and performance tuning services for enterprise-scale projects, using shared playbooks to accelerate adoption and value realization; certifications build a skilled partner bench for large programs, while revenue sharing and co-delivery scale capacity without adding headcount.
- Enablement: SI-led test design & tuning
- Playbooks: faster enterprise rollout
- Certs: scalable partner bench for large programs
- Commercials: revenue share & co-delivery to expand scale
Browser/device labs & network/CDN partners
RadView partners with BrowserStack (2,000+ real devices in 2024) and Sauce Labs (800+ browser/OS combos in 2024) to run true-browser performance scenarios, while coordinating with CDNs and edge networks to emulate realistic traffic paths and geographic routing. Joint tests validate caching behavior, routing decisions and WAF rules under load, improving diagnostic fidelity and reducing mean-time-to-resolution.
- BrowserStack: 2,000+ real devices (2024)
- Sauce Labs: 800+ browser/OS combos (2024)
- CDN/edge integration: validates caching, routing, WAF under load
- Outcome: higher realism and faster diagnostics
Global automated load testing trims spend by 20% via hyperscalers & CI/CD
RadView leverages hyperscalers (AWS 32%/Azure 23%/GCP 11% in 2024), CI/CD vendors, observability firms (OpenTelemetry ~70% adoption) and browser farms to deliver global, automated, end-to-end load testing with faster procurement and ~20% lower test spend. SIs and consultancies scale delivery via playbooks, certifications and revenue share, accelerating enterprise rollouts. Integrations drive shifted-left testing across 100M+ developers in 2024.
| Partner | Role | 2024 metric | Impact |
|---|---|---|---|
| AWS/Azure/GCP | Load fabric | 32%/23%/11% market share | Global scale, regional coverage |
| CI/CD (GitHub/Jenkins) | Shift-left | 100M+ devs | Automated pipelines |
| BrowserStack/Sauce | Real-browser | 2,000/800 devices | Higher realism |
What is included in the product
Detailed Word Document
A concise, pre-written Business Model Canvas for RadView Software detailing customer segments, channels, value propositions and revenue streams across the 9 classic BMC blocks, aligned with real-world operations and growth plans. Ideal for investor pitches and strategic planning, it includes competitive analysis and SWOT-linked insights to support validation and decision-making.
Customizable Excel Spreadsheet
High-level view of RadView Software’s business model with editable cells, condensing strategy into a one-page snapshot that saves hours of formatting and enables quick team collaboration and board-ready presentations.
Activities
Engine & platform R&D
Design scalable load generators, protocol handlers and results pipelines to emulate thousands to millions of virtual users while optimizing concurrency and cost efficiency; load-test realism mirrors production traffic patterns. Maintain resilience across multi-region cloud and on-prem deployments to meet common 99.95%–99.99% SLAs. Continuously benchmark against industry workloads and published 2024 graphs for traffic mixes and latency percentiles.
Product development & UX
Build scenario designers, dashboards, and reporting workflows that scale to enterprise needs, reflecting 2024 demand for faster insights. Simplify complex test authoring with templates and versioning to cut iteration cycles by up to 30% in high‑automation teams. Deliver intuitive correlation and bottleneck insights for rapid root‑cause analysis. Prioritize collaboration features so cross‑functional teams can co-author and review in real time.
Integrations & APIs
Develop robust REST/CLI/SDK interfaces for automation, targeting sub-100ms API response SLAs and client libraries in 5 major languages; maintain connectors for CI/CD, APM, and ticketing tools to support enterprises where ~70% use automated pipelines. Ensure backward compatibility, OAuth2/mTLS authentication and versioned APIs to minimize churn. Publish code examples and Terraform modules to accelerate adoption and reduce integration time by weeks.
Customer success & support
Customer success delivers onboarding, test-plan reviews and best-practice playbooks; average onboarding is 10 days (2024) with test reviews reducing false positives. SLAs include 4-hour response and 99.95% uptime targets, plus performance tuning clinics and incident assistance. Feedback loops prioritize roadmap items and measure outcomes via time-to-detect (improved ~35% in 2024) and release velocity (+20%).
- Onboarding: 10 days
- SLA: 4-hour response, 99.95% uptime
- Outcomes: time-to-detect -35%, release velocity +20%
- Activities: reviews, clinics, incident support, feedback→roadmap
Security, compliance & reliability
Implement robust data handling, encryption and tenancy isolation while pursuing enterprise certifications such as SOC 2 and ISO 27001 and conducting regular audits; run scheduled chaos and reliability tests on the platform; maintain incident response playbooks and transparent status communications with a 99.95% uptime target (≈4.38 hours downtime/year).
- Data encryption at rest and in transit
- SOC 2 / ISO 27001 audits
- Chaos engineering for resilience
- Incident response + public status SLAs
Multi-region testing: sub-100ms APIs, 99.95% SLA, 10d onboarding
Design/operate scalable load generators and realistic scenarios; maintain multi‑region resilience and 99.95% uptime. Deliver dashboards, SDKs (5 languages), CI/CD connectors, sub‑100ms APIs, and onboarding (10 days) with 4‑hour SLA to reduce time‑to‑detect 35% and boost release velocity 20% (2024).
| Metric | Value |
|---|---|
| Uptime SLA | 99.95% |
| Onboarding | 10 days |
| Time‑to‑detect | -35% |
| Release velocity | +20% |
| API latency | <100ms |
Preview Before You Purchase
Business Model Canvas
The document you're previewing is the exact RadView Software Business Model Canvas you'll receive after purchase. It's not a mockup—this live preview mirrors the full deliverable, formatted and structured identically. After buying, you'll download the complete, editable Word and Excel files with all content included.











