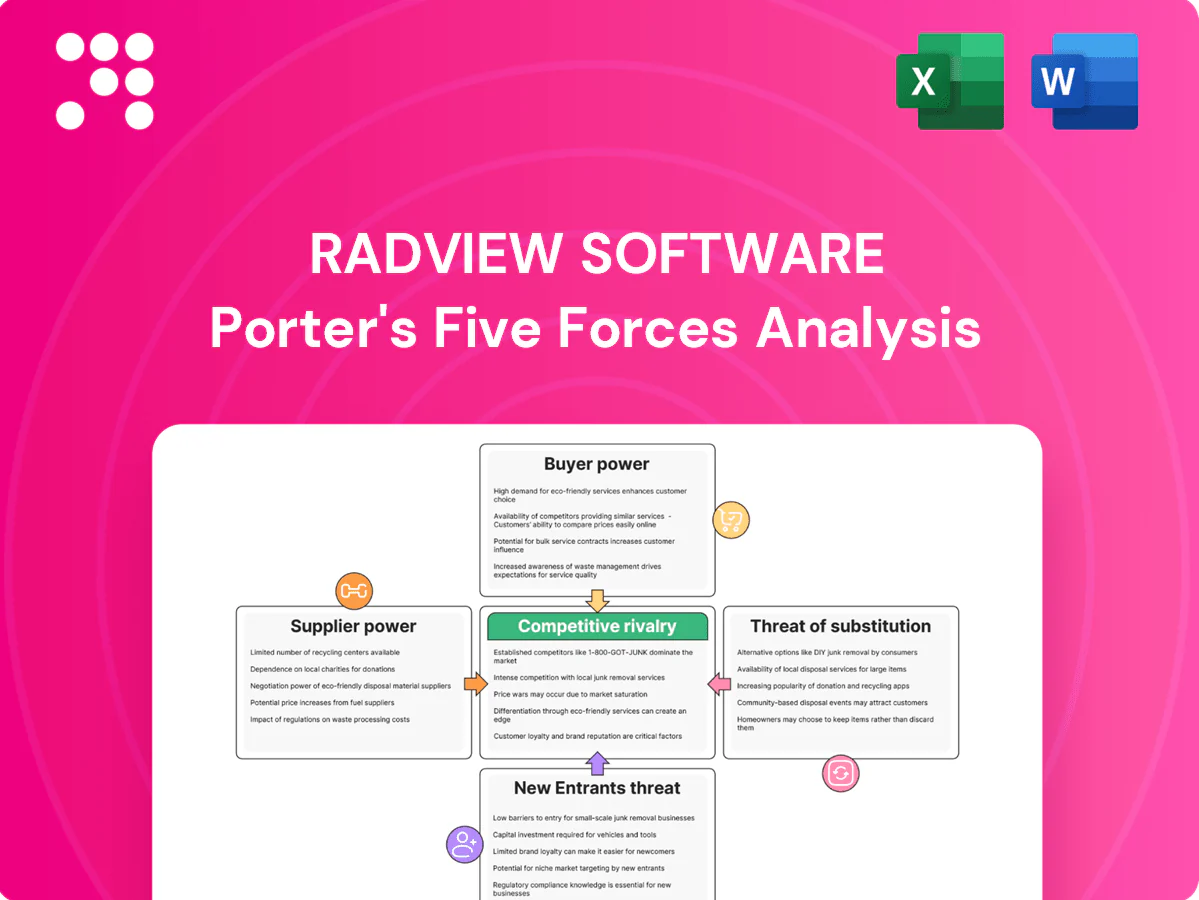
RadView Software Porter's Five Forces Analysis

Go Beyond the Preview—Access the Full Strategic Report
RadView Software faces moderate buyer power, specialized supplier relationships, and an increasing substitute threat as cloud testing platforms gain traction; rivalry hinges on innovation and service depth. This brief snapshot only scratches the surface. Unlock the full Porter's Five Forces Analysis to explore RadView Software’s competitive dynamics, market pressures, and strategic advantages in detail.
Suppliers Bargaining Power

Dependence on hyperscalers
RadView’s orchestration likely runs atop AWS (≈33% market share), Azure (≈22%) or GCP (≈12%), concentrating supplier leverage. Hyperscaler price or service-limit changes can squeeze margins and complicate capacity planning. Preferential peering and regional availability shape latency realism. Multi-cloud abstractions mitigate vendor lock-in but add integration complexity and higher operational cost.
Browser and protocol ecosystems
Support for evolving browsers and HTTP/2/3 ties RadView to upstream roadmaps as Chrome held ~65% global share in 2024 and major browsers added HTTP/3 support >90% by 2024; top‑site HTTP/3 adoption was ~45%, so vendor doc/API delays and slow driver updates can create weeks–months of lag, lowering test fidelity and increasing time‑to‑market risk when standards shift.

Specialized engineering talent
High-caliber performance engineers and SREs act as critical suppliers for RadView, with the US median software developer wage at $120,730 (BLS, May 2023) highlighting wage pressure. Tight labor markets and elevated tech turnover raise attrition risk and hiring costs. Knowledge concentration around core engine and traffic-gen IP amplifies dependency on a small talent pool. Targeted retention programs and automation reduce this exposure.

Third‑party integrations
Third‑party integrations with CI/CD, APM and collaboration platforms like Jenkins, GitHub (over 100M developers in 2024), Jira and Dynatrace are critical complements for RadView; API changes or revised partnership terms can force roadmap delays and break customer workflows. Certification and co‑marketing dependencies add coordination costs and time to value, and vendor lock or ecosystem shifts can rapidly disrupt integrations and revenue retention.
- CI/CD: Jenkins/GitHub
- APM: Dynatrace
- Collaboration: Jira
- Risks: API changes, partnership terms
- Costs: certification, co‑marketing, coordination
- Threat: vendor lock/ecosystem shifts
Data center and network capacity
Burstable bandwidth, large IP pools and regional test nodes are essential for realistic load testing; in 2024 egress pricing ranged roughly 0.02–0.12 USD/GB, directly impacting COGS. Carriers and test-node providers can constrain availability during peak events, with observed capacity squeezes up to 30%. Contracting multiple global POPs (3+) reduces concentration risk and pricing exposure.
- Burstable bandwidth required for realism
- IP pools and regional nodes (3+ POPs) lower risk
- 2024 egress pricing ~0.02–0.12 USD/GB affects COGS
- Carriers/test-node providers may cut capacity up to 30% at peaks
Supplier power surges — cloud, browsers, talent and egress costs squeeze margins
Supplier power is high: hyperscalers (AWS 33%, Azure 22%, GCP 12% in 2024) and carriers control pricing/availability, squeezing margins. Browser/HTTP roadmap dependence (Chrome ~65% 2024) and CI/APM partners raise integration and timing risks. Talent costs (US median dev wage $120,730, BLS May 2023) and egress (0.02–0.12 USD/GB 2024) further increase supplier leverage.
| Supplier | Key metric |
|---|---|
| Hyperscalers | AWS33%/AZ22%/GCP12% (2024) |
| Browsers | Chrome ~65% (2024) |
| Talent | Median dev $120,730 (May 2023) |
| Network | Egress $0.02–0.12/GB (2024); 3+ POPs |
What is included in the product
 Detailed Word Document
Tailored Porter's Five Forces analysis for RadView Software that uncovers key competitive drivers, supplier and buyer power, substitutes and entry risks, and identifies disruptive threats and strategic levers to protect market share and enhance pricing power.

 Customizable Excel Spreadsheet
A concise one-sheet Porter's Five Forces for RadView Software—quickly spot competitive pressures, customize force levels with current data, and drop the clean chart straight into pitch decks for faster strategic decisions.
Customers Bargaining Power

Abundant alternatives
Enterprises can choose among commercial suites and mature open-source tools—Apache JMeter (~3.7k GitHub stars in 2024), k6 (~20k stars), and Locust (~11k)—boosting price sensitivity and negotiation leverage. Easy proofs-of-concept and low trial costs intensify bake-offs, shortening sales cycles. Feature parity across these options forces vendors toward discounts or bundled services to protect ARR and win deals.
Low switching costs for pilots
Test scripts are portable and workloads reproducible, so pilots can move between tools with minimal friction, a dynamic highlighted in 2024 industry reviews. Migration at scale is harder but feasible using scripting adapters and ETL layers. Buyers commonly dual-run tools during evaluation to extract concessions. As a result, contract flexibility becomes a key decision factor for procurement.

Consolidation with APM/DevOps stacks
Buyers increasingly favor unified APM/DevOps suites that bundle load testing, RUM and observability, with 2024 industry surveys indicating roughly 58% of enterprises prioritize integrated platforms for procurement; suite vendors leverage cross-sell to compress pricing for point solutions, making integration depth and data-correlation capabilities decisive purchase criteria, so RadView must demonstrate superior TCO or a clear niche capability to retain pricing power.

Enterprise procurement leverage
Larger RadView enterprise accounts routinely impose stringent security, compliance and SLA terms (SOC 2/ISO 27001 commonly requested), push for volume commitments and multi-year contracts that seek steep discounts (typical range 10–30%), and use vendor risk assessments that can lengthen sales cycles by 30–90 days; strong references and certifications materially offset these demands.
- security: SOC 2/ISO 27001
- discounts: 10–30%
- sales cycle delay: 30–90 days
- mitigation: strong refs & certs
Outcome and ROI focus
Customers prioritize actionable bottleneck insights over raw load generation, pushing vendors to deliver time-to-find and time-to-fix under 24 hours; in 2024 surveys ~75% of buyers said delayed insights prompted demands for credits or churn, and vendors report up to 12% ARR at risk from poor SLAs.
- Outcome focus: actionable diagnostics > raw load
- Speed: <24h TTF/TTR expectation
- Value lift: case studies improve buy-in ~25%
Buyers hold leverage: integrated APM (58%) drives 10-30% discounts and churn risk
Buyers have strong leverage: multiple mature alternatives (k6 ~20k, Locust ~11k GitHub stars in 2024) and low trial costs drive price sensitivity and frequent bake-offs.
Enterprises prefer integrated APM/observability (≈58% in 2024), pushing vendors to bundle or concede discounts (typical 10–30%).
Security/SLA demands (SOC 2/ISO 27001) and delayed insights (75% cite churn risk) create up to ~12% ARR at risk.
| Metric | Value (2024) |
|---|---|
| Integrated platform preference | 58% |
| GitHub stars (k6/Locust) | 20k / 11k |
| Typical discount range | 10–30% |
| ARR at risk from poor SLAs | ~12% |
What You See Is What You Get
RadView Software Porter's Five Forces Analysis
This preview shows the exact RadView Software Porter's Five Forces Analysis you'll receive—fully written, formatted and ready for use. The file displayed is the final deliverable with no placeholders or mockups. After purchase you’ll get instant access to this identical document.

Go Beyond the Preview—Access the Full Strategic Report
RadView Software faces moderate buyer power, specialized supplier relationships, and an increasing substitute threat as cloud testing platforms gain traction; rivalry hinges on innovation and service depth. This brief snapshot only scratches the surface. Unlock the full Porter's Five Forces Analysis to explore RadView Software’s competitive dynamics, market pressures, and strategic advantages in detail.
Suppliers Bargaining Power
Dependence on hyperscalers
RadView’s orchestration likely runs atop AWS (≈33% market share), Azure (≈22%) or GCP (≈12%), concentrating supplier leverage. Hyperscaler price or service-limit changes can squeeze margins and complicate capacity planning. Preferential peering and regional availability shape latency realism. Multi-cloud abstractions mitigate vendor lock-in but add integration complexity and higher operational cost.
Browser and protocol ecosystems
Support for evolving browsers and HTTP/2/3 ties RadView to upstream roadmaps as Chrome held ~65% global share in 2024 and major browsers added HTTP/3 support >90% by 2024; top‑site HTTP/3 adoption was ~45%, so vendor doc/API delays and slow driver updates can create weeks–months of lag, lowering test fidelity and increasing time‑to‑market risk when standards shift.
Specialized engineering talent
High-caliber performance engineers and SREs act as critical suppliers for RadView, with the US median software developer wage at $120,730 (BLS, May 2023) highlighting wage pressure. Tight labor markets and elevated tech turnover raise attrition risk and hiring costs. Knowledge concentration around core engine and traffic-gen IP amplifies dependency on a small talent pool. Targeted retention programs and automation reduce this exposure.
Third‑party integrations
Third‑party integrations with CI/CD, APM and collaboration platforms like Jenkins, GitHub (over 100M developers in 2024), Jira and Dynatrace are critical complements for RadView; API changes or revised partnership terms can force roadmap delays and break customer workflows. Certification and co‑marketing dependencies add coordination costs and time to value, and vendor lock or ecosystem shifts can rapidly disrupt integrations and revenue retention.
- CI/CD: Jenkins/GitHub
- APM: Dynatrace
- Collaboration: Jira
- Risks: API changes, partnership terms
- Costs: certification, co‑marketing, coordination
- Threat: vendor lock/ecosystem shifts
Data center and network capacity
Burstable bandwidth, large IP pools and regional test nodes are essential for realistic load testing; in 2024 egress pricing ranged roughly 0.02–0.12 USD/GB, directly impacting COGS. Carriers and test-node providers can constrain availability during peak events, with observed capacity squeezes up to 30%. Contracting multiple global POPs (3+) reduces concentration risk and pricing exposure.
- Burstable bandwidth required for realism
- IP pools and regional nodes (3+ POPs) lower risk
- 2024 egress pricing ~0.02–0.12 USD/GB affects COGS
- Carriers/test-node providers may cut capacity up to 30% at peaks
Supplier power surges — cloud, browsers, talent and egress costs squeeze margins
Supplier power is high: hyperscalers (AWS 33%, Azure 22%, GCP 12% in 2024) and carriers control pricing/availability, squeezing margins. Browser/HTTP roadmap dependence (Chrome ~65% 2024) and CI/APM partners raise integration and timing risks. Talent costs (US median dev wage $120,730, BLS May 2023) and egress (0.02–0.12 USD/GB 2024) further increase supplier leverage.
| Supplier | Key metric |
|---|---|
| Hyperscalers | AWS33%/AZ22%/GCP12% (2024) |
| Browsers | Chrome ~65% (2024) |
| Talent | Median dev $120,730 (May 2023) |
| Network | Egress $0.02–0.12/GB (2024); 3+ POPs |
What is included in the product
Detailed Word Document
Tailored Porter's Five Forces analysis for RadView Software that uncovers key competitive drivers, supplier and buyer power, substitutes and entry risks, and identifies disruptive threats and strategic levers to protect market share and enhance pricing power.
Customizable Excel Spreadsheet
A concise one-sheet Porter's Five Forces for RadView Software—quickly spot competitive pressures, customize force levels with current data, and drop the clean chart straight into pitch decks for faster strategic decisions.
Customers Bargaining Power
Abundant alternatives
Enterprises can choose among commercial suites and mature open-source tools—Apache JMeter (~3.7k GitHub stars in 2024), k6 (~20k stars), and Locust (~11k)—boosting price sensitivity and negotiation leverage. Easy proofs-of-concept and low trial costs intensify bake-offs, shortening sales cycles. Feature parity across these options forces vendors toward discounts or bundled services to protect ARR and win deals.
Low switching costs for pilots
Test scripts are portable and workloads reproducible, so pilots can move between tools with minimal friction, a dynamic highlighted in 2024 industry reviews. Migration at scale is harder but feasible using scripting adapters and ETL layers. Buyers commonly dual-run tools during evaluation to extract concessions. As a result, contract flexibility becomes a key decision factor for procurement.
Consolidation with APM/DevOps stacks
Buyers increasingly favor unified APM/DevOps suites that bundle load testing, RUM and observability, with 2024 industry surveys indicating roughly 58% of enterprises prioritize integrated platforms for procurement; suite vendors leverage cross-sell to compress pricing for point solutions, making integration depth and data-correlation capabilities decisive purchase criteria, so RadView must demonstrate superior TCO or a clear niche capability to retain pricing power.
Enterprise procurement leverage
Larger RadView enterprise accounts routinely impose stringent security, compliance and SLA terms (SOC 2/ISO 27001 commonly requested), push for volume commitments and multi-year contracts that seek steep discounts (typical range 10–30%), and use vendor risk assessments that can lengthen sales cycles by 30–90 days; strong references and certifications materially offset these demands.
- security: SOC 2/ISO 27001
- discounts: 10–30%
- sales cycle delay: 30–90 days
- mitigation: strong refs & certs
Outcome and ROI focus
Customers prioritize actionable bottleneck insights over raw load generation, pushing vendors to deliver time-to-find and time-to-fix under 24 hours; in 2024 surveys ~75% of buyers said delayed insights prompted demands for credits or churn, and vendors report up to 12% ARR at risk from poor SLAs.
- Outcome focus: actionable diagnostics > raw load
- Speed: <24h TTF/TTR expectation
- Value lift: case studies improve buy-in ~25%
Buyers hold leverage: integrated APM (58%) drives 10-30% discounts and churn risk
Buyers have strong leverage: multiple mature alternatives (k6 ~20k, Locust ~11k GitHub stars in 2024) and low trial costs drive price sensitivity and frequent bake-offs.
Enterprises prefer integrated APM/observability (≈58% in 2024), pushing vendors to bundle or concede discounts (typical 10–30%).
Security/SLA demands (SOC 2/ISO 27001) and delayed insights (75% cite churn risk) create up to ~12% ARR at risk.
| Metric | Value (2024) |
|---|---|
| Integrated platform preference | 58% |
| GitHub stars (k6/Locust) | 20k / 11k |
| Typical discount range | 10–30% |
| ARR at risk from poor SLAs | ~12% |
What You See Is What You Get
RadView Software Porter's Five Forces Analysis
This preview shows the exact RadView Software Porter's Five Forces Analysis you'll receive—fully written, formatted and ready for use. The file displayed is the final deliverable with no placeholders or mockups. After purchase you’ll get instant access to this identical document.
Original: $10.00
-65%$10.00
$3.50Description
Go Beyond the Preview—Access the Full Strategic Report
RadView Software faces moderate buyer power, specialized supplier relationships, and an increasing substitute threat as cloud testing platforms gain traction; rivalry hinges on innovation and service depth. This brief snapshot only scratches the surface. Unlock the full Porter's Five Forces Analysis to explore RadView Software’s competitive dynamics, market pressures, and strategic advantages in detail.
Suppliers Bargaining Power
Dependence on hyperscalers
RadView’s orchestration likely runs atop AWS (≈33% market share), Azure (≈22%) or GCP (≈12%), concentrating supplier leverage. Hyperscaler price or service-limit changes can squeeze margins and complicate capacity planning. Preferential peering and regional availability shape latency realism. Multi-cloud abstractions mitigate vendor lock-in but add integration complexity and higher operational cost.
Browser and protocol ecosystems
Support for evolving browsers and HTTP/2/3 ties RadView to upstream roadmaps as Chrome held ~65% global share in 2024 and major browsers added HTTP/3 support >90% by 2024; top‑site HTTP/3 adoption was ~45%, so vendor doc/API delays and slow driver updates can create weeks–months of lag, lowering test fidelity and increasing time‑to‑market risk when standards shift.
Specialized engineering talent
High-caliber performance engineers and SREs act as critical suppliers for RadView, with the US median software developer wage at $120,730 (BLS, May 2023) highlighting wage pressure. Tight labor markets and elevated tech turnover raise attrition risk and hiring costs. Knowledge concentration around core engine and traffic-gen IP amplifies dependency on a small talent pool. Targeted retention programs and automation reduce this exposure.
Third‑party integrations
Third‑party integrations with CI/CD, APM and collaboration platforms like Jenkins, GitHub (over 100M developers in 2024), Jira and Dynatrace are critical complements for RadView; API changes or revised partnership terms can force roadmap delays and break customer workflows. Certification and co‑marketing dependencies add coordination costs and time to value, and vendor lock or ecosystem shifts can rapidly disrupt integrations and revenue retention.
- CI/CD: Jenkins/GitHub
- APM: Dynatrace
- Collaboration: Jira
- Risks: API changes, partnership terms
- Costs: certification, co‑marketing, coordination
- Threat: vendor lock/ecosystem shifts
Data center and network capacity
Burstable bandwidth, large IP pools and regional test nodes are essential for realistic load testing; in 2024 egress pricing ranged roughly 0.02–0.12 USD/GB, directly impacting COGS. Carriers and test-node providers can constrain availability during peak events, with observed capacity squeezes up to 30%. Contracting multiple global POPs (3+) reduces concentration risk and pricing exposure.
- Burstable bandwidth required for realism
- IP pools and regional nodes (3+ POPs) lower risk
- 2024 egress pricing ~0.02–0.12 USD/GB affects COGS
- Carriers/test-node providers may cut capacity up to 30% at peaks
Supplier power surges — cloud, browsers, talent and egress costs squeeze margins
Supplier power is high: hyperscalers (AWS 33%, Azure 22%, GCP 12% in 2024) and carriers control pricing/availability, squeezing margins. Browser/HTTP roadmap dependence (Chrome ~65% 2024) and CI/APM partners raise integration and timing risks. Talent costs (US median dev wage $120,730, BLS May 2023) and egress (0.02–0.12 USD/GB 2024) further increase supplier leverage.
| Supplier | Key metric |
|---|---|
| Hyperscalers | AWS33%/AZ22%/GCP12% (2024) |
| Browsers | Chrome ~65% (2024) |
| Talent | Median dev $120,730 (May 2023) |
| Network | Egress $0.02–0.12/GB (2024); 3+ POPs |
What is included in the product
Detailed Word Document
Tailored Porter's Five Forces analysis for RadView Software that uncovers key competitive drivers, supplier and buyer power, substitutes and entry risks, and identifies disruptive threats and strategic levers to protect market share and enhance pricing power.
Customizable Excel Spreadsheet
A concise one-sheet Porter's Five Forces for RadView Software—quickly spot competitive pressures, customize force levels with current data, and drop the clean chart straight into pitch decks for faster strategic decisions.
Customers Bargaining Power
Abundant alternatives
Enterprises can choose among commercial suites and mature open-source tools—Apache JMeter (~3.7k GitHub stars in 2024), k6 (~20k stars), and Locust (~11k)—boosting price sensitivity and negotiation leverage. Easy proofs-of-concept and low trial costs intensify bake-offs, shortening sales cycles. Feature parity across these options forces vendors toward discounts or bundled services to protect ARR and win deals.
Low switching costs for pilots
Test scripts are portable and workloads reproducible, so pilots can move between tools with minimal friction, a dynamic highlighted in 2024 industry reviews. Migration at scale is harder but feasible using scripting adapters and ETL layers. Buyers commonly dual-run tools during evaluation to extract concessions. As a result, contract flexibility becomes a key decision factor for procurement.
Consolidation with APM/DevOps stacks
Buyers increasingly favor unified APM/DevOps suites that bundle load testing, RUM and observability, with 2024 industry surveys indicating roughly 58% of enterprises prioritize integrated platforms for procurement; suite vendors leverage cross-sell to compress pricing for point solutions, making integration depth and data-correlation capabilities decisive purchase criteria, so RadView must demonstrate superior TCO or a clear niche capability to retain pricing power.
Enterprise procurement leverage
Larger RadView enterprise accounts routinely impose stringent security, compliance and SLA terms (SOC 2/ISO 27001 commonly requested), push for volume commitments and multi-year contracts that seek steep discounts (typical range 10–30%), and use vendor risk assessments that can lengthen sales cycles by 30–90 days; strong references and certifications materially offset these demands.
- security: SOC 2/ISO 27001
- discounts: 10–30%
- sales cycle delay: 30–90 days
- mitigation: strong refs & certs
Outcome and ROI focus
Customers prioritize actionable bottleneck insights over raw load generation, pushing vendors to deliver time-to-find and time-to-fix under 24 hours; in 2024 surveys ~75% of buyers said delayed insights prompted demands for credits or churn, and vendors report up to 12% ARR at risk from poor SLAs.
- Outcome focus: actionable diagnostics > raw load
- Speed: <24h TTF/TTR expectation
- Value lift: case studies improve buy-in ~25%
Buyers hold leverage: integrated APM (58%) drives 10-30% discounts and churn risk
Buyers have strong leverage: multiple mature alternatives (k6 ~20k, Locust ~11k GitHub stars in 2024) and low trial costs drive price sensitivity and frequent bake-offs.
Enterprises prefer integrated APM/observability (≈58% in 2024), pushing vendors to bundle or concede discounts (typical 10–30%).
Security/SLA demands (SOC 2/ISO 27001) and delayed insights (75% cite churn risk) create up to ~12% ARR at risk.
| Metric | Value (2024) |
|---|---|
| Integrated platform preference | 58% |
| GitHub stars (k6/Locust) | 20k / 11k |
| Typical discount range | 10–30% |
| ARR at risk from poor SLAs | ~12% |
What You See Is What You Get
RadView Software Porter's Five Forces Analysis
This preview shows the exact RadView Software Porter's Five Forces Analysis you'll receive—fully written, formatted and ready for use. The file displayed is the final deliverable with no placeholders or mockups. After purchase you’ll get instant access to this identical document.











