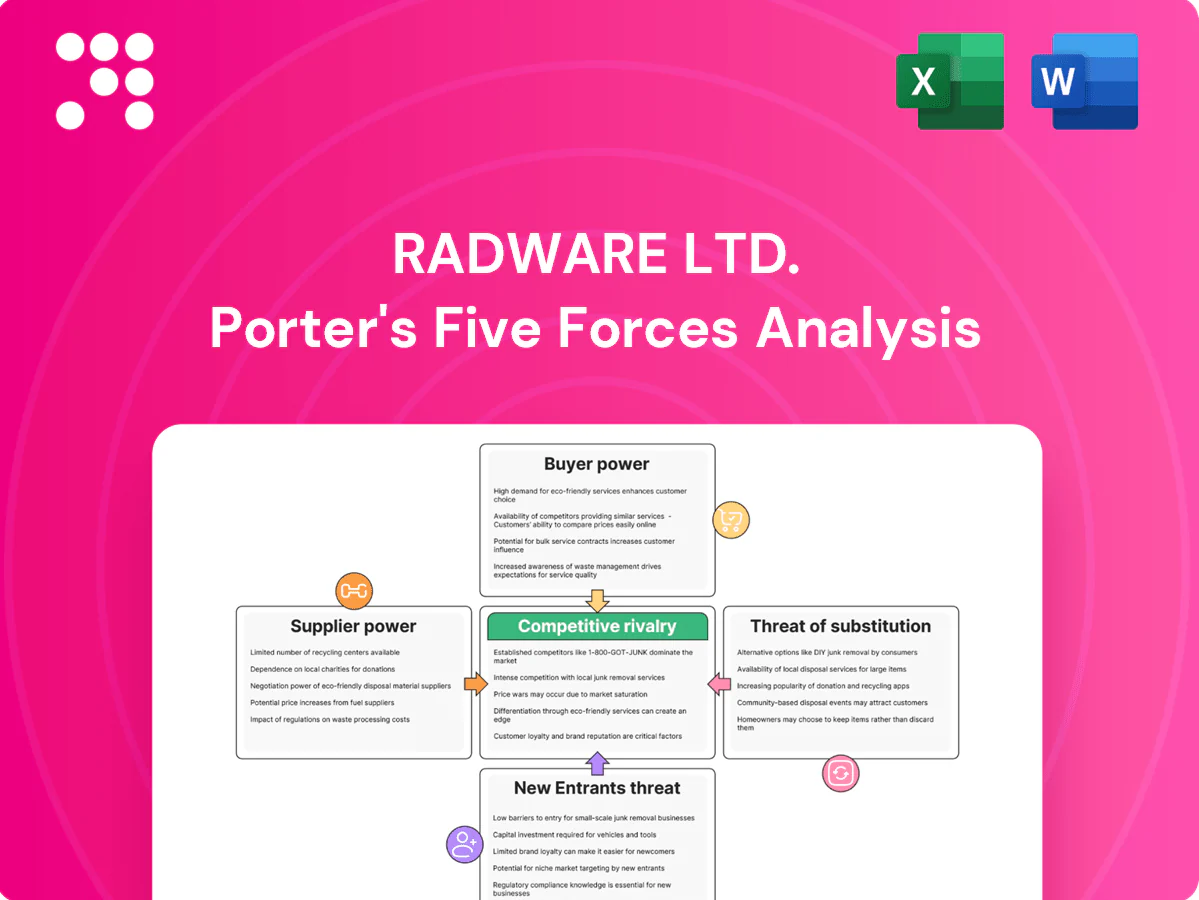
Radware Ltd. Porter's Five Forces Analysis

From Overview to Strategy Blueprint
Radware faces intense rivalry in cybersecurity and application delivery, with moderate supplier leverage, discerning buyers, and rising cloud-native substitutes and new entrants; regulatory and tech shifts heighten risk. This brief snapshot only scratches the surface—unlock the full Porter's Five Forces Analysis to explore Radware Ltd.’s competitive dynamics and strategic advantages in detail.
Suppliers Bargaining Power

Specialized silicon and NIC vendors
Radware’s appliances depend on high-performance CPUs, ASICs, FPGAs and smart NICs sourced from a concentrated supplier base (eg. major CPU, FPGA and NIC vendors in 2024), giving suppliers elevated leverage due to limited alternatives and long qualification cycles that often span months. Component shortages or roadmap shifts can pressure availability and costs, impacting product delivery and margins. Radware reduces risk through multi-sourcing and designing for component flexibility.
Cloud and data center partners
Radware’s cloud DDoS and WAF offerings rely on IaaS providers, carriers and colocation partners; with top cloud vendors holding ~33% (AWS) and ~22% (Microsoft) market share, supplier moves can materially affect service costs and access. Pricing changes, bandwidth fees or peering policy shifts can compress margins and raise OPEX. Geographic coverage and latency SLAs depend on partner capacity, so diversifying regions and providers reduces single-supplier risk.

Threat intelligence and software stacks
Radware Ltd. (NASDAQ: RDWR) integrates third-party threat feeds, signatures and libraries into its stacks, creating dependency on vendor licensing and API terms that can affect cost and time-to-market. Substituting feeds is feasible but demands engineering resources and validation, slowing rollouts. Building proprietary telemetry reduces external supplier leverage over time.

Contract manufacturers and logistics
Contract manufacturers and global freight carriers give EMS partners measurable leverage over Radware's hardware assembly and logistics in 2024, as capacity constraints or geopolitical disruptions can materially elongate lead times and affect product delivery windows. Volume commitments and strict quality standards grant EMS negotiation power, while nearshoring and buffer inventory strategies implemented in 2024 reduce shock exposure.
Skilled cybersecurity talent
Skilled cybersecurity talent—especially ML, advanced detection and L7 specialists—is scarce, giving labor suppliers measurable bargaining power; ISC2 estimates a ~3.4 million global workforce gap (2024). Wage inflation and higher retention costs compress gross margins on services; remote work widens the pool but raises global competition and hiring costs. Training pipelines and automation (SOAR/ML) are reducing per-head dependency.
- Supply gap: 3.4M (ISC2 2024)
- Margin pressure: higher retention/wage inflation
- Remote work: broader pool, more competition
- Mitigants: training pipelines, automation
Security vendor faces supplier power: AWS 33% / MSFT 22%, ISC2 gap 3.4M
Radware faces elevated supplier power in 2024 from concentrated CPU/FPGA/NIC vendors and top cloud providers (AWS ~33%, Microsoft ~22%), risking availability and cost; multi-sourcing and design flexibility mitigate this. EMS, freight and scarce cyber talent (ISC2 gap ~3.4M in 2024) add leverage, offset by nearshoring, buffer stock and automation.
| Supplier | 2024 Metric |
|---|---|
| Cloud share | AWS 33% / MSFT 22% |
| Cyber talent gap | 3.4M (ISC2 2024) |
What is included in the product
 Detailed Word Document
Tailored Porter's Five Forces analysis for Radware Ltd. uncovering competitive rivalry, buyer and supplier influence, substitution risks, and entry barriers, plus disruptive threats and strategic implications for pricing and profitability.

 Customizable Excel Spreadsheet
A concise one-sheet Porter's Five Forces for Radware Ltd.—visual spider chart and customizable pressure levels to instantly reveal competitive pain points and strategic levers; clean layout ready for pitch decks, easy data swaps, no macros, and seamless integration into Excel reports.
Customers Bargaining Power

Large enterprises and carriers
Major buyers run competitive RFPs, demand volume discounts and stringent SLAs (commonly targeting 99.99% uptime) and extract concessions through formal procurement processes.
Their scale and multi-year (typically 3–5 year) contracts give strong negotiating leverage and influence pricing and support tiers.
Large customers also shape product roadmaps and support terms via co-development or feedback loops, while reference value and upsell potential partly offset initial concessions.
Multi-vendor strategies
Customers commonly dual-source ADC and security to reduce downtime and supplier risk; Gartner reported in 2024 that roughly 80% of enterprises pursue multi-vendor/multi-cloud strategies, which boosts buyer leverage by enabling vendor play-offs. API-first integrations and interoperability standards have materially lowered switching costs, while measurable differences in threat mitigation efficacy and management simplicity remain the primary levers vendors use to defend pricing.

Outcome-based SLAs
Buyers demand measurable uptime (commonly 99.9–99.999%), latency and mitigation-time SLAs (typically 15–60 minutes), with service credits or penalties—often tied to a percentage of monthly fees—shifting risk onto vendors. These clauses tighten performance accountability and pressure pricing and margins. Superior telemetry and automated, sub-minute response capabilities materially reduce SLA exposure and related credit payouts.

Cloud-first procurement
Cloud-first procurement shifts buyer power toward OPEX, marketplace billing and elastic capacity; Gartner reported the 2024 public cloud services market near $600B, setting price/reference points that squeeze premium on-prem vendors. Radware must align with AWS/Azure marketplaces and flexible licensing to avoid churn; presenting clear TCO versus cloud-native alternatives reduces discount pressure and preserves margins.
- Market signal: 2024 public cloud ≈ $600B
- Buyer preference: OPEX, pay-as-you-go
- Radware action: marketplace listings, flexible licensing
- Defense: transparent TCO vs cloud-native
Switching costs and lock-in
Policy portability, runbooks, and integrations create moderate switching costs for Radware by preserving configurations and reducing migration risk; 2024 industry surveys show ~62% of enterprises rely on runbooks to cut migration errors. Modern APIs and automation can lower friction, but Radware's strong customer success and migration tooling raise stickiness, while bundled platform value reduces churn and price sensitivity.
- Policy portability: reduces effort
- Runbooks: 62% reliance (2024)
- APIs/automation: ease migrations
- Customer success: increases lock-in
- Bundled value: lowers churn
Buyers wield leverage: ≈80% multi-vendor deals and tight SLAs
Large enterprise buyers exercise strong leverage via competitive RFPs, 3–5 year contracts and dual-sourcing (≈80% pursue multi-vendor strategies in 2024), driving discounts and strict SLAs (99.9–99.999%) that pressure margins. Cloud benchmark ($600B public cloud 2024) and OPEX preferences force marketplace alignment and flexible licensing. Runbooks/APIs lower switching costs but Radware’s migration tooling and bundled value increase stickiness (62% runbook reliance).
| Metric | 2024 Value | Implication |
|---|---|---|
| Multi-vendor adoption | ≈80% | Higher buyer leverage |
| Public cloud market | $600B | OPEX pricing benchmark |
| Runbook reliance | 62% | Lower migration risk |
Same Document Delivered
Radware Ltd. Porter's Five Forces Analysis
This preview shows the exact Porter's Five Forces analysis of Radware Ltd. you'll receive immediately after purchase—no surprises, no placeholders. It covers competitive rivalry, buyer and supplier power, threats of new entrants and substitutes, and strategic implications for Radware. The file is fully formatted and ready to download and use.

From Overview to Strategy Blueprint
Radware faces intense rivalry in cybersecurity and application delivery, with moderate supplier leverage, discerning buyers, and rising cloud-native substitutes and new entrants; regulatory and tech shifts heighten risk. This brief snapshot only scratches the surface—unlock the full Porter's Five Forces Analysis to explore Radware Ltd.’s competitive dynamics and strategic advantages in detail.
Suppliers Bargaining Power
Specialized silicon and NIC vendors
Radware’s appliances depend on high-performance CPUs, ASICs, FPGAs and smart NICs sourced from a concentrated supplier base (eg. major CPU, FPGA and NIC vendors in 2024), giving suppliers elevated leverage due to limited alternatives and long qualification cycles that often span months. Component shortages or roadmap shifts can pressure availability and costs, impacting product delivery and margins. Radware reduces risk through multi-sourcing and designing for component flexibility.
Cloud and data center partners
Radware’s cloud DDoS and WAF offerings rely on IaaS providers, carriers and colocation partners; with top cloud vendors holding ~33% (AWS) and ~22% (Microsoft) market share, supplier moves can materially affect service costs and access. Pricing changes, bandwidth fees or peering policy shifts can compress margins and raise OPEX. Geographic coverage and latency SLAs depend on partner capacity, so diversifying regions and providers reduces single-supplier risk.
Threat intelligence and software stacks
Radware Ltd. (NASDAQ: RDWR) integrates third-party threat feeds, signatures and libraries into its stacks, creating dependency on vendor licensing and API terms that can affect cost and time-to-market. Substituting feeds is feasible but demands engineering resources and validation, slowing rollouts. Building proprietary telemetry reduces external supplier leverage over time.
Contract manufacturers and logistics
Contract manufacturers and global freight carriers give EMS partners measurable leverage over Radware's hardware assembly and logistics in 2024, as capacity constraints or geopolitical disruptions can materially elongate lead times and affect product delivery windows. Volume commitments and strict quality standards grant EMS negotiation power, while nearshoring and buffer inventory strategies implemented in 2024 reduce shock exposure.
Skilled cybersecurity talent
Skilled cybersecurity talent—especially ML, advanced detection and L7 specialists—is scarce, giving labor suppliers measurable bargaining power; ISC2 estimates a ~3.4 million global workforce gap (2024). Wage inflation and higher retention costs compress gross margins on services; remote work widens the pool but raises global competition and hiring costs. Training pipelines and automation (SOAR/ML) are reducing per-head dependency.
- Supply gap: 3.4M (ISC2 2024)
- Margin pressure: higher retention/wage inflation
- Remote work: broader pool, more competition
- Mitigants: training pipelines, automation
Security vendor faces supplier power: AWS 33% / MSFT 22%, ISC2 gap 3.4M
Radware faces elevated supplier power in 2024 from concentrated CPU/FPGA/NIC vendors and top cloud providers (AWS ~33%, Microsoft ~22%), risking availability and cost; multi-sourcing and design flexibility mitigate this. EMS, freight and scarce cyber talent (ISC2 gap ~3.4M in 2024) add leverage, offset by nearshoring, buffer stock and automation.
| Supplier | 2024 Metric |
|---|---|
| Cloud share | AWS 33% / MSFT 22% |
| Cyber talent gap | 3.4M (ISC2 2024) |
What is included in the product
Detailed Word Document
Tailored Porter's Five Forces analysis for Radware Ltd. uncovering competitive rivalry, buyer and supplier influence, substitution risks, and entry barriers, plus disruptive threats and strategic implications for pricing and profitability.
Customizable Excel Spreadsheet
A concise one-sheet Porter's Five Forces for Radware Ltd.—visual spider chart and customizable pressure levels to instantly reveal competitive pain points and strategic levers; clean layout ready for pitch decks, easy data swaps, no macros, and seamless integration into Excel reports.
Customers Bargaining Power
Large enterprises and carriers
Major buyers run competitive RFPs, demand volume discounts and stringent SLAs (commonly targeting 99.99% uptime) and extract concessions through formal procurement processes.
Their scale and multi-year (typically 3–5 year) contracts give strong negotiating leverage and influence pricing and support tiers.
Large customers also shape product roadmaps and support terms via co-development or feedback loops, while reference value and upsell potential partly offset initial concessions.
Multi-vendor strategies
Customers commonly dual-source ADC and security to reduce downtime and supplier risk; Gartner reported in 2024 that roughly 80% of enterprises pursue multi-vendor/multi-cloud strategies, which boosts buyer leverage by enabling vendor play-offs. API-first integrations and interoperability standards have materially lowered switching costs, while measurable differences in threat mitigation efficacy and management simplicity remain the primary levers vendors use to defend pricing.
Outcome-based SLAs
Buyers demand measurable uptime (commonly 99.9–99.999%), latency and mitigation-time SLAs (typically 15–60 minutes), with service credits or penalties—often tied to a percentage of monthly fees—shifting risk onto vendors. These clauses tighten performance accountability and pressure pricing and margins. Superior telemetry and automated, sub-minute response capabilities materially reduce SLA exposure and related credit payouts.
Cloud-first procurement
Cloud-first procurement shifts buyer power toward OPEX, marketplace billing and elastic capacity; Gartner reported the 2024 public cloud services market near $600B, setting price/reference points that squeeze premium on-prem vendors. Radware must align with AWS/Azure marketplaces and flexible licensing to avoid churn; presenting clear TCO versus cloud-native alternatives reduces discount pressure and preserves margins.
- Market signal: 2024 public cloud ≈ $600B
- Buyer preference: OPEX, pay-as-you-go
- Radware action: marketplace listings, flexible licensing
- Defense: transparent TCO vs cloud-native
Switching costs and lock-in
Policy portability, runbooks, and integrations create moderate switching costs for Radware by preserving configurations and reducing migration risk; 2024 industry surveys show ~62% of enterprises rely on runbooks to cut migration errors. Modern APIs and automation can lower friction, but Radware's strong customer success and migration tooling raise stickiness, while bundled platform value reduces churn and price sensitivity.
- Policy portability: reduces effort
- Runbooks: 62% reliance (2024)
- APIs/automation: ease migrations
- Customer success: increases lock-in
- Bundled value: lowers churn
Buyers wield leverage: ≈80% multi-vendor deals and tight SLAs
Large enterprise buyers exercise strong leverage via competitive RFPs, 3–5 year contracts and dual-sourcing (≈80% pursue multi-vendor strategies in 2024), driving discounts and strict SLAs (99.9–99.999%) that pressure margins. Cloud benchmark ($600B public cloud 2024) and OPEX preferences force marketplace alignment and flexible licensing. Runbooks/APIs lower switching costs but Radware’s migration tooling and bundled value increase stickiness (62% runbook reliance).
| Metric | 2024 Value | Implication |
|---|---|---|
| Multi-vendor adoption | ≈80% | Higher buyer leverage |
| Public cloud market | $600B | OPEX pricing benchmark |
| Runbook reliance | 62% | Lower migration risk |
Same Document Delivered
Radware Ltd. Porter's Five Forces Analysis
This preview shows the exact Porter's Five Forces analysis of Radware Ltd. you'll receive immediately after purchase—no surprises, no placeholders. It covers competitive rivalry, buyer and supplier power, threats of new entrants and substitutes, and strategic implications for Radware. The file is fully formatted and ready to download and use.
Original: $10.00
-65%$10.00
$3.50Description
From Overview to Strategy Blueprint
Radware faces intense rivalry in cybersecurity and application delivery, with moderate supplier leverage, discerning buyers, and rising cloud-native substitutes and new entrants; regulatory and tech shifts heighten risk. This brief snapshot only scratches the surface—unlock the full Porter's Five Forces Analysis to explore Radware Ltd.’s competitive dynamics and strategic advantages in detail.
Suppliers Bargaining Power
Specialized silicon and NIC vendors
Radware’s appliances depend on high-performance CPUs, ASICs, FPGAs and smart NICs sourced from a concentrated supplier base (eg. major CPU, FPGA and NIC vendors in 2024), giving suppliers elevated leverage due to limited alternatives and long qualification cycles that often span months. Component shortages or roadmap shifts can pressure availability and costs, impacting product delivery and margins. Radware reduces risk through multi-sourcing and designing for component flexibility.
Cloud and data center partners
Radware’s cloud DDoS and WAF offerings rely on IaaS providers, carriers and colocation partners; with top cloud vendors holding ~33% (AWS) and ~22% (Microsoft) market share, supplier moves can materially affect service costs and access. Pricing changes, bandwidth fees or peering policy shifts can compress margins and raise OPEX. Geographic coverage and latency SLAs depend on partner capacity, so diversifying regions and providers reduces single-supplier risk.
Threat intelligence and software stacks
Radware Ltd. (NASDAQ: RDWR) integrates third-party threat feeds, signatures and libraries into its stacks, creating dependency on vendor licensing and API terms that can affect cost and time-to-market. Substituting feeds is feasible but demands engineering resources and validation, slowing rollouts. Building proprietary telemetry reduces external supplier leverage over time.
Contract manufacturers and logistics
Contract manufacturers and global freight carriers give EMS partners measurable leverage over Radware's hardware assembly and logistics in 2024, as capacity constraints or geopolitical disruptions can materially elongate lead times and affect product delivery windows. Volume commitments and strict quality standards grant EMS negotiation power, while nearshoring and buffer inventory strategies implemented in 2024 reduce shock exposure.
Skilled cybersecurity talent
Skilled cybersecurity talent—especially ML, advanced detection and L7 specialists—is scarce, giving labor suppliers measurable bargaining power; ISC2 estimates a ~3.4 million global workforce gap (2024). Wage inflation and higher retention costs compress gross margins on services; remote work widens the pool but raises global competition and hiring costs. Training pipelines and automation (SOAR/ML) are reducing per-head dependency.
- Supply gap: 3.4M (ISC2 2024)
- Margin pressure: higher retention/wage inflation
- Remote work: broader pool, more competition
- Mitigants: training pipelines, automation
Security vendor faces supplier power: AWS 33% / MSFT 22%, ISC2 gap 3.4M
Radware faces elevated supplier power in 2024 from concentrated CPU/FPGA/NIC vendors and top cloud providers (AWS ~33%, Microsoft ~22%), risking availability and cost; multi-sourcing and design flexibility mitigate this. EMS, freight and scarce cyber talent (ISC2 gap ~3.4M in 2024) add leverage, offset by nearshoring, buffer stock and automation.
| Supplier | 2024 Metric |
|---|---|
| Cloud share | AWS 33% / MSFT 22% |
| Cyber talent gap | 3.4M (ISC2 2024) |
What is included in the product
Detailed Word Document
Tailored Porter's Five Forces analysis for Radware Ltd. uncovering competitive rivalry, buyer and supplier influence, substitution risks, and entry barriers, plus disruptive threats and strategic implications for pricing and profitability.
Customizable Excel Spreadsheet
A concise one-sheet Porter's Five Forces for Radware Ltd.—visual spider chart and customizable pressure levels to instantly reveal competitive pain points and strategic levers; clean layout ready for pitch decks, easy data swaps, no macros, and seamless integration into Excel reports.
Customers Bargaining Power
Large enterprises and carriers
Major buyers run competitive RFPs, demand volume discounts and stringent SLAs (commonly targeting 99.99% uptime) and extract concessions through formal procurement processes.
Their scale and multi-year (typically 3–5 year) contracts give strong negotiating leverage and influence pricing and support tiers.
Large customers also shape product roadmaps and support terms via co-development or feedback loops, while reference value and upsell potential partly offset initial concessions.
Multi-vendor strategies
Customers commonly dual-source ADC and security to reduce downtime and supplier risk; Gartner reported in 2024 that roughly 80% of enterprises pursue multi-vendor/multi-cloud strategies, which boosts buyer leverage by enabling vendor play-offs. API-first integrations and interoperability standards have materially lowered switching costs, while measurable differences in threat mitigation efficacy and management simplicity remain the primary levers vendors use to defend pricing.
Outcome-based SLAs
Buyers demand measurable uptime (commonly 99.9–99.999%), latency and mitigation-time SLAs (typically 15–60 minutes), with service credits or penalties—often tied to a percentage of monthly fees—shifting risk onto vendors. These clauses tighten performance accountability and pressure pricing and margins. Superior telemetry and automated, sub-minute response capabilities materially reduce SLA exposure and related credit payouts.
Cloud-first procurement
Cloud-first procurement shifts buyer power toward OPEX, marketplace billing and elastic capacity; Gartner reported the 2024 public cloud services market near $600B, setting price/reference points that squeeze premium on-prem vendors. Radware must align with AWS/Azure marketplaces and flexible licensing to avoid churn; presenting clear TCO versus cloud-native alternatives reduces discount pressure and preserves margins.
- Market signal: 2024 public cloud ≈ $600B
- Buyer preference: OPEX, pay-as-you-go
- Radware action: marketplace listings, flexible licensing
- Defense: transparent TCO vs cloud-native
Switching costs and lock-in
Policy portability, runbooks, and integrations create moderate switching costs for Radware by preserving configurations and reducing migration risk; 2024 industry surveys show ~62% of enterprises rely on runbooks to cut migration errors. Modern APIs and automation can lower friction, but Radware's strong customer success and migration tooling raise stickiness, while bundled platform value reduces churn and price sensitivity.
- Policy portability: reduces effort
- Runbooks: 62% reliance (2024)
- APIs/automation: ease migrations
- Customer success: increases lock-in
- Bundled value: lowers churn
Buyers wield leverage: ≈80% multi-vendor deals and tight SLAs
Large enterprise buyers exercise strong leverage via competitive RFPs, 3–5 year contracts and dual-sourcing (≈80% pursue multi-vendor strategies in 2024), driving discounts and strict SLAs (99.9–99.999%) that pressure margins. Cloud benchmark ($600B public cloud 2024) and OPEX preferences force marketplace alignment and flexible licensing. Runbooks/APIs lower switching costs but Radware’s migration tooling and bundled value increase stickiness (62% runbook reliance).
| Metric | 2024 Value | Implication |
|---|---|---|
| Multi-vendor adoption | ≈80% | Higher buyer leverage |
| Public cloud market | $600B | OPEX pricing benchmark |
| Runbook reliance | 62% | Lower migration risk |
Same Document Delivered
Radware Ltd. Porter's Five Forces Analysis
This preview shows the exact Porter's Five Forces analysis of Radware Ltd. you'll receive immediately after purchase—no surprises, no placeholders. It covers competitive rivalry, buyer and supplier power, threats of new entrants and substitutes, and strategic implications for Radware. The file is fully formatted and ready to download and use.











