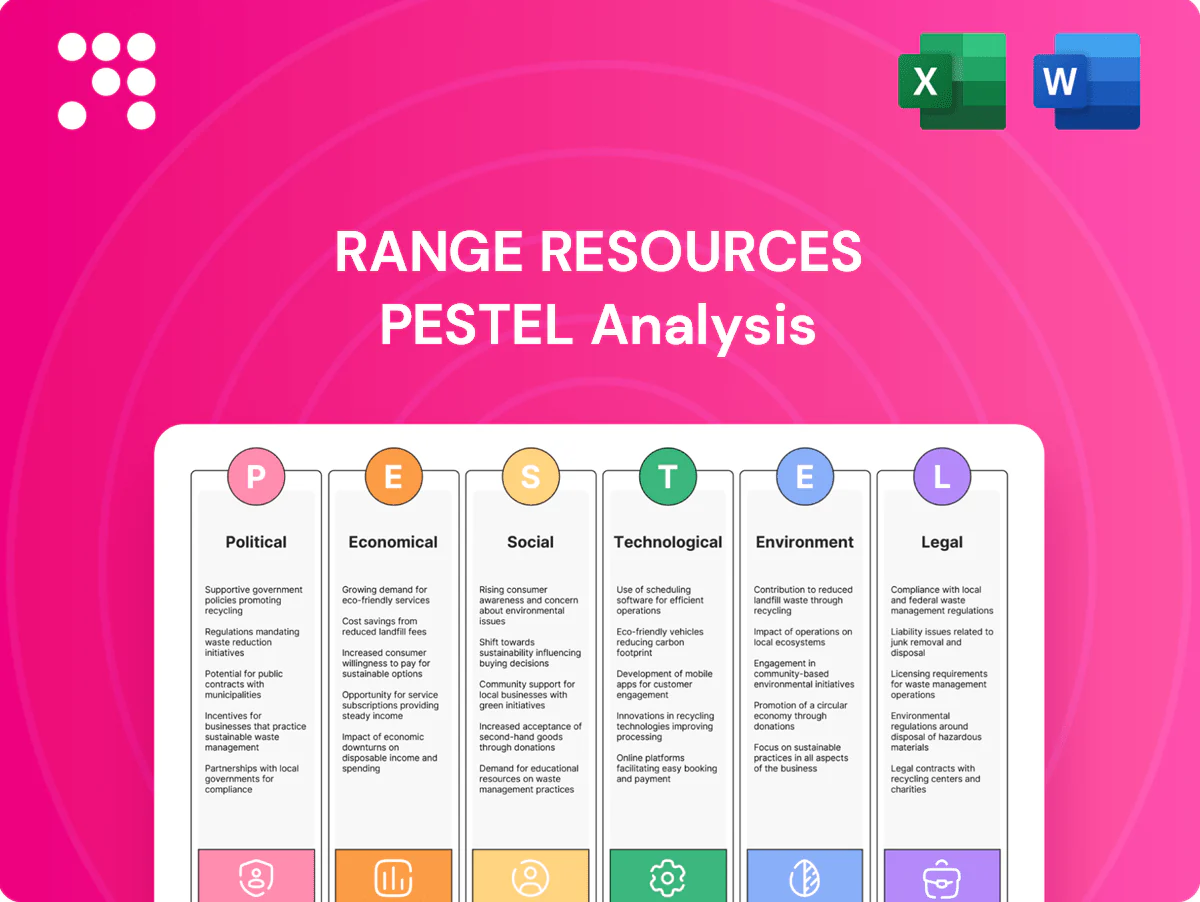
Range Resources PESTLE Analysis

Skip the Research. Get the Strategy.
Discover how political regulation, energy prices, environmental scrutiny, and technological change are reshaping Range Resources in our concise PESTLE snapshot. This analysis highlights risks and opportunities investors and strategists need now. Buy the full PESTLE for a complete, actionable breakdown ready for decision-making.
Political factors

Federal and state energy policy shifts
Policy priorities on natural gas, permitting timelines, and emissions targets directly affect project pacing and NPV; natural gas supplied 38% of U.S. electricity in 2023 (EIA), keeping demand strong but sensitive to regulatory costs. EPA finalized updated methane standards for oil and gas in 2023 and administration shifts can tighten or relax upstream rules and leasing. For Range Resources, Pennsylvania and West Virginia permitting and state rules typically drive near-term timing; regulatory stability reduces planning risk, abrupt shifts can stall capital programs.
Pipeline and midstream permitting
Political support or resistance to interstate pipelines directly alters Appalachia takeaway; Mountain Valley Pipeline adds roughly 2 Bcf/d of potential capacity but remains delayed. Permitting hurdles have historically helped push Marcellus basis discounts as wide as about -6 $/MMBtu versus Henry Hub. Faster approvals would relieve bottlenecks and likely raise Range Resources realized prices; adverse rulings can strand volumes and impede growth.

LNG export stance and geopolitics
US national policy linking LNG approvals to global demand ties domestic supplies to world markets: US liquefaction capacity reached ≈14 Bcf/d by mid‑2025, driving strong export flows that tighten US balances and supported Henry Hub rallies (peaks >9 $/MMBtu in 2022–23; 2024 avg ≈3.5 $/MMBtu), benefiting Appalachia producers like Range; geopolitical shocks amplify gains, while export restrictions would blunt long‑run price signals for Range.

Local governance and community relations
County and township officials control zoning, road use and operating hours, directly shaping pad siting and timing; cooperative local politics can streamline pad access and logistics, while opposition can impose setbacks or moratoria that re-sequence drilling schedules. Range Resources’ targeted stakeholder engagement and community agreements reduce localized political friction and enable more predictable operations.
- Local control: zoning, roads, hours
- Cooperation: faster pad access, smoother logistics
- Opposition risk: setbacks/moratoria re-sequence wells
- Mitigation: Range stakeholder engagement reduces delays
Taxation and incentives
Severance, ad valorem and corporate tax changes directly affect Range Resources cash flow; the US federal corporate rate is 21% (2025) and state levies can add material burden, altering free cash flow available for drilling. State incentives for infrastructure or emissions reductions—tax credits or grants—can offset compliance costs. Sudden local tax hikes compress margins and can force slower drilling cadence, while predictable regimes support multi‑year development planning.
- Tax mix: federal 21% plus state severance/ad valorem variability
- Incentives: infrastructure/emissions credits lower compliance cost
- Risk: abrupt hikes compress margins and capex; predictability enables long‑term planning
Policy and methane rules cut Appalachian NPV/timing; US gas 38%
Policy, permitting and methane rules drive Range Resources project timing and NPV; US gas supplied 38% of electricity in 2023 (EIA) and Henry Hub averaged ~3.5 $/MMBtu in 2024, amplifying regulatory impacts. Appalachia takeaway constraints (e.g., MVP ~2 Bcf/d) and local zoning directly affect realized prices and schedule; tax rates and incentives alter free cash flow and drilling cadence.
| Factor | Metric |
|---|---|
| US gas share 2023 | 38% |
| Henry Hub 2024 avg | $3.5/MMBtu |
| MVP potential | ~2 Bcf/d |
| Fed corp rate 2025 | 21% |
What is included in the product
 Detailed Word Document
Explores how macro-environmental factors uniquely affect Range Resources across Political, Economic, Social, Technological, Environmental and Legal dimensions, combining data-driven trends, region-specific regulatory context and forward-looking insights to help executives and investors identify threats, opportunities and strategy implications.

 Customizable Excel Spreadsheet
A concise, visually segmented PESTLE summary of Range Resources that’s easily editable and shareable, enabling quick alignment across teams, supporting external-risk and market-positioning discussions, and ready to drop into presentations or strategy packs.
Economic factors

Natural gas price volatility
Henry Hub volatility (2024 spot roughly $1.90–$4.77/MMBtu) and Appalachia basis differentials (commonly -$0.50 to -$1.20/MMBtu) drive Range Resources revenue swings; U.S. working gas ~3,300 Bcf amplifies sensitivity. Weather, storage draws and power burns trigger short-cycle moves; Range’s ~60% hedged book and cost efficiency blunt but do not remove exposure. Prolonged lows demand capital discipline; sustained highs speed de-levering.
Service cost inflation and supply chain
Pressure pumping, tubulars, and labor rates materially drive Range Resources well costs, with tight service markets pushing AFE budgets higher and extending timelines for completions and tie-ins.
Deflationary windows—following the 2024 U.S. CPI slowdown to about 3.4%—can expand project inventory returns as input costs ease.
Procurement discipline and multi-year contracts have helped Range stabilize inputs and hedge volatility in the Appalachian supply chain.

Interest rates and capital access
Higher policy rates (Fed funds ~5.25–5.50% in mid‑2025) lift borrowing costs and raise drilling hurdle rates, slowing greenfield CAPEX. Investors continue to favor free cash flow over growth, shaping Range’s capital allocation toward returns. Conversely, lower rates and tighter credit spreads enable refinancing and buybacks. Range’s balance sheet strength determines its flexibility across cycles.

Demand growth from power and industrials
- Gas-fired power ~40% share (EIA 2023-24)
- US LNG ~12.9 Bcf/d (2023, EIA)
- Coal-to-gas + data centers support offtake
- Efficiency moderates long-term growth
NGL pricing and product mix
Marcellus wells yield meaningful NGL volumes that diversify Range Resources revenue; ethane, propane and butane realizations hinge on fractionation capacity, Mont Belvieu pricing and export demand. Strong NGL spreads materially lift netbacks and project IRRs, while weak NGL markets narrow the advantage versus dry gas drilling.
- Key drivers: fractionation, exports, oil-linked pricing
- Upside: higher NGL spreads → improved netbacks/IRR
- Downside: weak NGLs → parity with dry gas economics
Policy and methane rules cut Appalachian NPV/timing; US gas 38%
Henry Hub and Appalachia basis swings (2024 spot ~$1.90–$4.77/MMBtu; Appalachia -$0.50–-$1.20) drive Range revenue volatility despite a ~60% hedged book. Service-cost inflation and tight labor raise well costs and AFE risk; Fed funds ~5.25–5.50% (mid‑2025) elevates hurdle rates. US working gas ~3,300 Bcf and LNG exports (~12.9 Bcf/d 2023) underpin demand; NGLs materially shift netbacks in Marcellus.
| Metric | Value |
|---|---|
| Henry Hub 2024 | $1.90–$4.77/MMBtu |
| Appalachia basis | -$0.50 to -$1.20/MMBtu |
| Hedged book | ~60% |
| Fed funds | 5.25–5.50% (mid‑2025) |
| Working gas | ~3,300 Bcf |
| US LNG | ~12.9 Bcf/d (2023) |
Preview the Actual Deliverable
Range Resources PESTLE Analysis
The Range Resources PESTLE Analysis shown here is the exact, fully formatted document you’ll receive after purchase. It’s a professional, ready-to-use file with no placeholders or surprises. The content, layout, and structure in this preview match the downloadable product. Use it immediately after checkout.

Skip the Research. Get the Strategy.
Discover how political regulation, energy prices, environmental scrutiny, and technological change are reshaping Range Resources in our concise PESTLE snapshot. This analysis highlights risks and opportunities investors and strategists need now. Buy the full PESTLE for a complete, actionable breakdown ready for decision-making.
Political factors
Federal and state energy policy shifts
Policy priorities on natural gas, permitting timelines, and emissions targets directly affect project pacing and NPV; natural gas supplied 38% of U.S. electricity in 2023 (EIA), keeping demand strong but sensitive to regulatory costs. EPA finalized updated methane standards for oil and gas in 2023 and administration shifts can tighten or relax upstream rules and leasing. For Range Resources, Pennsylvania and West Virginia permitting and state rules typically drive near-term timing; regulatory stability reduces planning risk, abrupt shifts can stall capital programs.
Pipeline and midstream permitting
Political support or resistance to interstate pipelines directly alters Appalachia takeaway; Mountain Valley Pipeline adds roughly 2 Bcf/d of potential capacity but remains delayed. Permitting hurdles have historically helped push Marcellus basis discounts as wide as about -6 $/MMBtu versus Henry Hub. Faster approvals would relieve bottlenecks and likely raise Range Resources realized prices; adverse rulings can strand volumes and impede growth.
LNG export stance and geopolitics
US national policy linking LNG approvals to global demand ties domestic supplies to world markets: US liquefaction capacity reached ≈14 Bcf/d by mid‑2025, driving strong export flows that tighten US balances and supported Henry Hub rallies (peaks >9 $/MMBtu in 2022–23; 2024 avg ≈3.5 $/MMBtu), benefiting Appalachia producers like Range; geopolitical shocks amplify gains, while export restrictions would blunt long‑run price signals for Range.
Local governance and community relations
County and township officials control zoning, road use and operating hours, directly shaping pad siting and timing; cooperative local politics can streamline pad access and logistics, while opposition can impose setbacks or moratoria that re-sequence drilling schedules. Range Resources’ targeted stakeholder engagement and community agreements reduce localized political friction and enable more predictable operations.
- Local control: zoning, roads, hours
- Cooperation: faster pad access, smoother logistics
- Opposition risk: setbacks/moratoria re-sequence wells
- Mitigation: Range stakeholder engagement reduces delays
Taxation and incentives
Severance, ad valorem and corporate tax changes directly affect Range Resources cash flow; the US federal corporate rate is 21% (2025) and state levies can add material burden, altering free cash flow available for drilling. State incentives for infrastructure or emissions reductions—tax credits or grants—can offset compliance costs. Sudden local tax hikes compress margins and can force slower drilling cadence, while predictable regimes support multi‑year development planning.
- Tax mix: federal 21% plus state severance/ad valorem variability
- Incentives: infrastructure/emissions credits lower compliance cost
- Risk: abrupt hikes compress margins and capex; predictability enables long‑term planning
Policy and methane rules cut Appalachian NPV/timing; US gas 38%
Policy, permitting and methane rules drive Range Resources project timing and NPV; US gas supplied 38% of electricity in 2023 (EIA) and Henry Hub averaged ~3.5 $/MMBtu in 2024, amplifying regulatory impacts. Appalachia takeaway constraints (e.g., MVP ~2 Bcf/d) and local zoning directly affect realized prices and schedule; tax rates and incentives alter free cash flow and drilling cadence.
| Factor | Metric |
|---|---|
| US gas share 2023 | 38% |
| Henry Hub 2024 avg | $3.5/MMBtu |
| MVP potential | ~2 Bcf/d |
| Fed corp rate 2025 | 21% |
What is included in the product
Detailed Word Document
Explores how macro-environmental factors uniquely affect Range Resources across Political, Economic, Social, Technological, Environmental and Legal dimensions, combining data-driven trends, region-specific regulatory context and forward-looking insights to help executives and investors identify threats, opportunities and strategy implications.
Customizable Excel Spreadsheet
A concise, visually segmented PESTLE summary of Range Resources that’s easily editable and shareable, enabling quick alignment across teams, supporting external-risk and market-positioning discussions, and ready to drop into presentations or strategy packs.
Economic factors
Natural gas price volatility
Henry Hub volatility (2024 spot roughly $1.90–$4.77/MMBtu) and Appalachia basis differentials (commonly -$0.50 to -$1.20/MMBtu) drive Range Resources revenue swings; U.S. working gas ~3,300 Bcf amplifies sensitivity. Weather, storage draws and power burns trigger short-cycle moves; Range’s ~60% hedged book and cost efficiency blunt but do not remove exposure. Prolonged lows demand capital discipline; sustained highs speed de-levering.
Service cost inflation and supply chain
Pressure pumping, tubulars, and labor rates materially drive Range Resources well costs, with tight service markets pushing AFE budgets higher and extending timelines for completions and tie-ins.
Deflationary windows—following the 2024 U.S. CPI slowdown to about 3.4%—can expand project inventory returns as input costs ease.
Procurement discipline and multi-year contracts have helped Range stabilize inputs and hedge volatility in the Appalachian supply chain.
Interest rates and capital access
Higher policy rates (Fed funds ~5.25–5.50% in mid‑2025) lift borrowing costs and raise drilling hurdle rates, slowing greenfield CAPEX. Investors continue to favor free cash flow over growth, shaping Range’s capital allocation toward returns. Conversely, lower rates and tighter credit spreads enable refinancing and buybacks. Range’s balance sheet strength determines its flexibility across cycles.
Demand growth from power and industrials
- Gas-fired power ~40% share (EIA 2023-24)
- US LNG ~12.9 Bcf/d (2023, EIA)
- Coal-to-gas + data centers support offtake
- Efficiency moderates long-term growth
NGL pricing and product mix
Marcellus wells yield meaningful NGL volumes that diversify Range Resources revenue; ethane, propane and butane realizations hinge on fractionation capacity, Mont Belvieu pricing and export demand. Strong NGL spreads materially lift netbacks and project IRRs, while weak NGL markets narrow the advantage versus dry gas drilling.
- Key drivers: fractionation, exports, oil-linked pricing
- Upside: higher NGL spreads → improved netbacks/IRR
- Downside: weak NGLs → parity with dry gas economics
Policy and methane rules cut Appalachian NPV/timing; US gas 38%
Henry Hub and Appalachia basis swings (2024 spot ~$1.90–$4.77/MMBtu; Appalachia -$0.50–-$1.20) drive Range revenue volatility despite a ~60% hedged book. Service-cost inflation and tight labor raise well costs and AFE risk; Fed funds ~5.25–5.50% (mid‑2025) elevates hurdle rates. US working gas ~3,300 Bcf and LNG exports (~12.9 Bcf/d 2023) underpin demand; NGLs materially shift netbacks in Marcellus.
| Metric | Value |
|---|---|
| Henry Hub 2024 | $1.90–$4.77/MMBtu |
| Appalachia basis | -$0.50 to -$1.20/MMBtu |
| Hedged book | ~60% |
| Fed funds | 5.25–5.50% (mid‑2025) |
| Working gas | ~3,300 Bcf |
| US LNG | ~12.9 Bcf/d (2023) |
Preview the Actual Deliverable
Range Resources PESTLE Analysis
The Range Resources PESTLE Analysis shown here is the exact, fully formatted document you’ll receive after purchase. It’s a professional, ready-to-use file with no placeholders or surprises. The content, layout, and structure in this preview match the downloadable product. Use it immediately after checkout.
Original: $10.00
-65%$10.00
$3.50Description
Skip the Research. Get the Strategy.
Discover how political regulation, energy prices, environmental scrutiny, and technological change are reshaping Range Resources in our concise PESTLE snapshot. This analysis highlights risks and opportunities investors and strategists need now. Buy the full PESTLE for a complete, actionable breakdown ready for decision-making.
Political factors
Federal and state energy policy shifts
Policy priorities on natural gas, permitting timelines, and emissions targets directly affect project pacing and NPV; natural gas supplied 38% of U.S. electricity in 2023 (EIA), keeping demand strong but sensitive to regulatory costs. EPA finalized updated methane standards for oil and gas in 2023 and administration shifts can tighten or relax upstream rules and leasing. For Range Resources, Pennsylvania and West Virginia permitting and state rules typically drive near-term timing; regulatory stability reduces planning risk, abrupt shifts can stall capital programs.
Pipeline and midstream permitting
Political support or resistance to interstate pipelines directly alters Appalachia takeaway; Mountain Valley Pipeline adds roughly 2 Bcf/d of potential capacity but remains delayed. Permitting hurdles have historically helped push Marcellus basis discounts as wide as about -6 $/MMBtu versus Henry Hub. Faster approvals would relieve bottlenecks and likely raise Range Resources realized prices; adverse rulings can strand volumes and impede growth.
LNG export stance and geopolitics
US national policy linking LNG approvals to global demand ties domestic supplies to world markets: US liquefaction capacity reached ≈14 Bcf/d by mid‑2025, driving strong export flows that tighten US balances and supported Henry Hub rallies (peaks >9 $/MMBtu in 2022–23; 2024 avg ≈3.5 $/MMBtu), benefiting Appalachia producers like Range; geopolitical shocks amplify gains, while export restrictions would blunt long‑run price signals for Range.
Local governance and community relations
County and township officials control zoning, road use and operating hours, directly shaping pad siting and timing; cooperative local politics can streamline pad access and logistics, while opposition can impose setbacks or moratoria that re-sequence drilling schedules. Range Resources’ targeted stakeholder engagement and community agreements reduce localized political friction and enable more predictable operations.
- Local control: zoning, roads, hours
- Cooperation: faster pad access, smoother logistics
- Opposition risk: setbacks/moratoria re-sequence wells
- Mitigation: Range stakeholder engagement reduces delays
Taxation and incentives
Severance, ad valorem and corporate tax changes directly affect Range Resources cash flow; the US federal corporate rate is 21% (2025) and state levies can add material burden, altering free cash flow available for drilling. State incentives for infrastructure or emissions reductions—tax credits or grants—can offset compliance costs. Sudden local tax hikes compress margins and can force slower drilling cadence, while predictable regimes support multi‑year development planning.
- Tax mix: federal 21% plus state severance/ad valorem variability
- Incentives: infrastructure/emissions credits lower compliance cost
- Risk: abrupt hikes compress margins and capex; predictability enables long‑term planning
Policy and methane rules cut Appalachian NPV/timing; US gas 38%
Policy, permitting and methane rules drive Range Resources project timing and NPV; US gas supplied 38% of electricity in 2023 (EIA) and Henry Hub averaged ~3.5 $/MMBtu in 2024, amplifying regulatory impacts. Appalachia takeaway constraints (e.g., MVP ~2 Bcf/d) and local zoning directly affect realized prices and schedule; tax rates and incentives alter free cash flow and drilling cadence.
| Factor | Metric |
|---|---|
| US gas share 2023 | 38% |
| Henry Hub 2024 avg | $3.5/MMBtu |
| MVP potential | ~2 Bcf/d |
| Fed corp rate 2025 | 21% |
What is included in the product
Detailed Word Document
Explores how macro-environmental factors uniquely affect Range Resources across Political, Economic, Social, Technological, Environmental and Legal dimensions, combining data-driven trends, region-specific regulatory context and forward-looking insights to help executives and investors identify threats, opportunities and strategy implications.
Customizable Excel Spreadsheet
A concise, visually segmented PESTLE summary of Range Resources that’s easily editable and shareable, enabling quick alignment across teams, supporting external-risk and market-positioning discussions, and ready to drop into presentations or strategy packs.
Economic factors
Natural gas price volatility
Henry Hub volatility (2024 spot roughly $1.90–$4.77/MMBtu) and Appalachia basis differentials (commonly -$0.50 to -$1.20/MMBtu) drive Range Resources revenue swings; U.S. working gas ~3,300 Bcf amplifies sensitivity. Weather, storage draws and power burns trigger short-cycle moves; Range’s ~60% hedged book and cost efficiency blunt but do not remove exposure. Prolonged lows demand capital discipline; sustained highs speed de-levering.
Service cost inflation and supply chain
Pressure pumping, tubulars, and labor rates materially drive Range Resources well costs, with tight service markets pushing AFE budgets higher and extending timelines for completions and tie-ins.
Deflationary windows—following the 2024 U.S. CPI slowdown to about 3.4%—can expand project inventory returns as input costs ease.
Procurement discipline and multi-year contracts have helped Range stabilize inputs and hedge volatility in the Appalachian supply chain.
Interest rates and capital access
Higher policy rates (Fed funds ~5.25–5.50% in mid‑2025) lift borrowing costs and raise drilling hurdle rates, slowing greenfield CAPEX. Investors continue to favor free cash flow over growth, shaping Range’s capital allocation toward returns. Conversely, lower rates and tighter credit spreads enable refinancing and buybacks. Range’s balance sheet strength determines its flexibility across cycles.
Demand growth from power and industrials
- Gas-fired power ~40% share (EIA 2023-24)
- US LNG ~12.9 Bcf/d (2023, EIA)
- Coal-to-gas + data centers support offtake
- Efficiency moderates long-term growth
NGL pricing and product mix
Marcellus wells yield meaningful NGL volumes that diversify Range Resources revenue; ethane, propane and butane realizations hinge on fractionation capacity, Mont Belvieu pricing and export demand. Strong NGL spreads materially lift netbacks and project IRRs, while weak NGL markets narrow the advantage versus dry gas drilling.
- Key drivers: fractionation, exports, oil-linked pricing
- Upside: higher NGL spreads → improved netbacks/IRR
- Downside: weak NGLs → parity with dry gas economics
Policy and methane rules cut Appalachian NPV/timing; US gas 38%
Henry Hub and Appalachia basis swings (2024 spot ~$1.90–$4.77/MMBtu; Appalachia -$0.50–-$1.20) drive Range revenue volatility despite a ~60% hedged book. Service-cost inflation and tight labor raise well costs and AFE risk; Fed funds ~5.25–5.50% (mid‑2025) elevates hurdle rates. US working gas ~3,300 Bcf and LNG exports (~12.9 Bcf/d 2023) underpin demand; NGLs materially shift netbacks in Marcellus.
| Metric | Value |
|---|---|
| Henry Hub 2024 | $1.90–$4.77/MMBtu |
| Appalachia basis | -$0.50 to -$1.20/MMBtu |
| Hedged book | ~60% |
| Fed funds | 5.25–5.50% (mid‑2025) |
| Working gas | ~3,300 Bcf |
| US LNG | ~12.9 Bcf/d (2023) |
Preview the Actual Deliverable
Range Resources PESTLE Analysis
The Range Resources PESTLE Analysis shown here is the exact, fully formatted document you’ll receive after purchase. It’s a professional, ready-to-use file with no placeholders or surprises. The content, layout, and structure in this preview match the downloadable product. Use it immediately after checkout.











