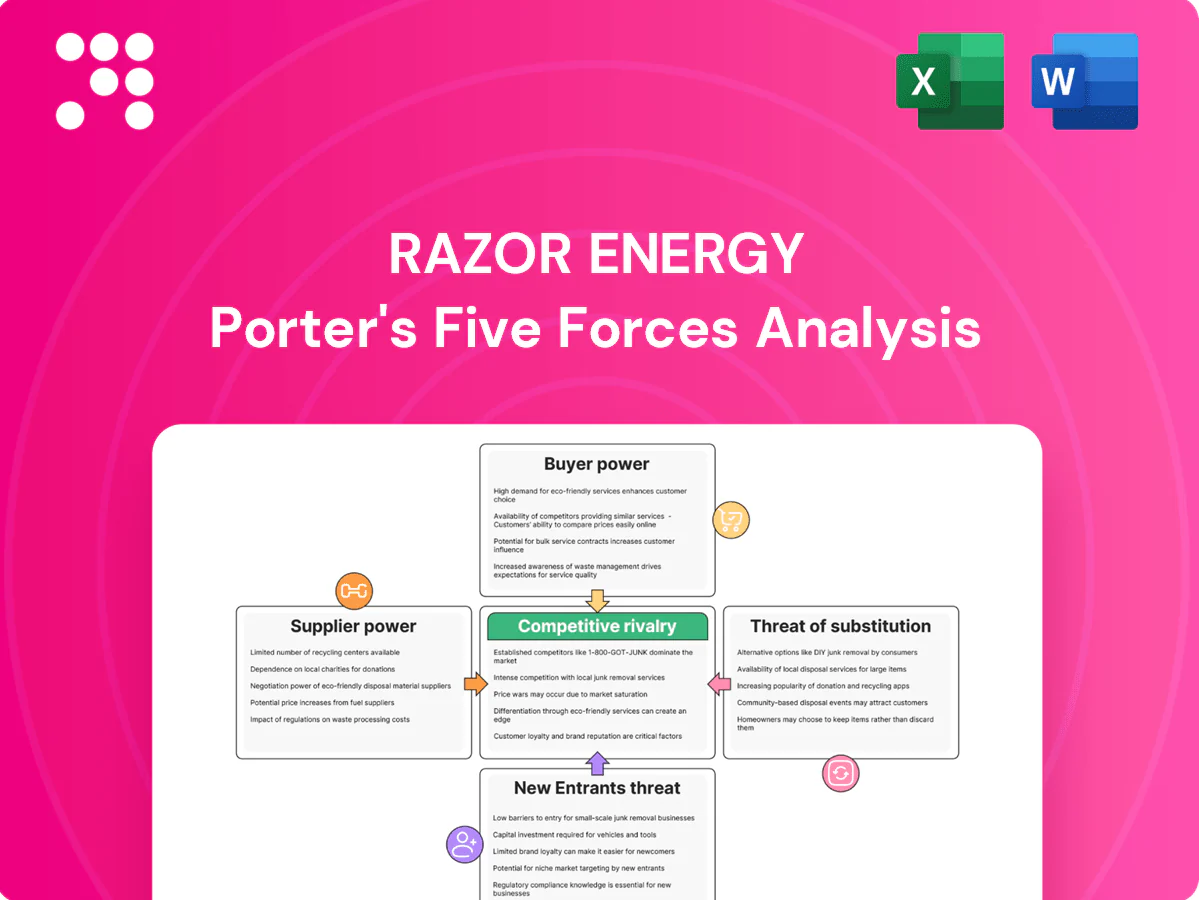
Razor Energy Porter's Five Forces Analysis

Don't Miss the Bigger Picture
Razor Energy’s Porter’s Five Forces snapshot highlights supplier leverage, buyer pressure, moderate barriers to entry and substitution risks in the upstream energy space. It outlines strategic vulnerabilities and opportunity areas for value capture. This brief only scratches the surface—unlock the full analysis for force-by-force ratings, visuals and actionable recommendations.
Suppliers Bargaining Power

Concentrated oilfield services
Drilling, completion and workover providers in Western Canada are relatively concentrated, with major contractors such as Precision, Calfrac and Ensign accounting for over 60% of active fleets, giving suppliers leverage in busy cycles. Day rates and equipment availability have shown volatility tied to commodity swings — 2024 saw seasonal day-rate uplifts of 15–30% in peak months. Razor’s mature-asset focus reduces rig intensity but still depends on key service categories like fracturing and coiled tubing. Multi-year contracts and bundled services modestly temper supplier power.
Pipeline and midstream dependence
Takeaway capacity, processing and storage in Western Canada are concentrated with midstream incumbents such as Enbridge and TC Energy, whose crude systems collectively handle over 3 million b/d, allowing constraints to force local differentials or curtailments and raising supplier power. Long-term toll agreements and tariff structures limit producer flexibility and can lock in basis risk. Alternative outlets via rail or trucking lower dependence but typically add roughly US$10–20 per barrel and only partially mitigate bottlenecks.

Specialized equipment and parts
Artificial lift, compression and emissions‑reduction components are supplied by a concentrated set of qualified vendors (top suppliers often account for >50% of capacity), creating switching costs as lead times of 12–24 weeks and tight specs limit alternatives. Supply chain tightness has driven project delays and equipment cost inflation of roughly 10–20% in 2022–24. Maintaining 6–12 months of strategic inventory and standardizing specs across assets reduces bottleneck risk.

Power and fuel inputs
Electricity (~11.8¢/kWh US industrial average in 2024) and natural gas (Henry Hub ~$2.55/MMBtu 2024 average) are material cost drivers for Razor Energy; volatile power prices and grid constraints can compress margins. FutEra’s co-generation can hedge a portion of on-site power demand and lower carbon intensity, while hedging and demand management cut exposure but cannot eliminate market and grid risk.
- Power cost: 11.8¢/kWh (US industrial avg, 2024)
- Gas price: $2.55/MMBtu (Henry Hub avg, 2024)
- Co-generation: partial on-site hedge, lowers intensity
- Hedging/demand mgmt: reduces but does not fully remove exposure
Skilled labor availability
- Skilled crew scarcity: cyclical, concentrated in upturns
- Wage pressure: ≈6% industry pay rise into 2024
- ESG/safety: raises entry barriers
- Mitigants: training pipelines and contractor networks
Moderate–high supplier power: concentrated drilling, midstream bottlenecks, rig rates +15–30%
Suppliers exert moderate–high power: drilling contractors (Precision/Calfrac/Ensign >60% fleets) and midstream (Enbridge/TC ≈3.0M b/d) can push rates and cause bottlenecks; 2024 saw rig day‑rates +15–30% seasonally and equipment cost inflation ~10–20%. Critical vendors have 12–24 week lead times; rail/road alternatives add ~US$10–20/bbl. Long contracts, inventory and bundling partly mitigate risk.
| Category | Concentration | Key metrics (2024) | Mitigants |
|---|---|---|---|
| Drilling | High | 60% fleet; day‑rates +15–30% | multi‑yr contracts |
| Midstream | High | 3.0M b/d; tariffs | rail/truck (+$10–20/bbl) |
| Equipment | Concentrated | lead 12–24 wks; costs +10–20% | inventory, standard specs |
| Energy | Market | Power 11.8¢/kWh; gas $2.55/MMBtu | on‑site cogeneration, hedges |
What is included in the product
 Detailed Word Document
Concise Porter’s Five Forces for Razor Energy, revealing competitive intensity, supplier/buyer leverage, entry barriers, substitution risks, and actionable insights to safeguard margins and inform strategic moves.

 Customizable Excel Spreadsheet
A concise one-sheet Porter’s Five Forces for Razor Energy that turns complex competitive dynamics into actionable priorities. Customizable pressure levels and a ready-to-use radar chart make strategic decisions fast and slide-ready.
Customers Bargaining Power

Commodity buyers are few, large
Crude and gas are sold to a small number of refiners, marketers and utilities, and in 2024 global oil demand averaged about 101.8 million barrels per day (IEA), concentrating purchasing power. Large buyers can insist on favorable payment terms and tight quality specs, keeping Razor a price taker with limited ability to secure meaningful premiums. Razor's counterparty diversification and marketing optionality help dilute buyer power by spreading sales across multiple offtakers and routes.
Price benchmarks set terms
WTI and AECO benchmarks largely set pricing formulas for Razor Energy, with quality differentials vs WTI typically widening realized crude prices by roughly 10–30 USD/bbl for heavy grades. Buyers rigorously enforce market-linked formulas and resist premium deviations, constraining seller leverage. Transportation and basis costs commonly shave 5–25 USD/bbl from netbacks; improving crude quality and managing basis can boost realizations by several USD/bbl.

Logistics and delivery risk
Buyers can penalize Razor Energy for delivery variability or off-spec volumes through allocation adjustments and price deductions, increasing realized discounts on crude and condensate. Pipeline nominations and scheduling rules give purchasers leverage over timing and volumes, often forcing sellers to accept reallocations. Access to storage — global SPR capacity ~714 million barrels in 2024 — reduces need for forced sales at steep discounts. Operational reliability is therefore critical to preserve pricing and minimize buyer leverage.

ESG and certification demands
Buyers increasingly favor lower-carbon barrels and certified gas, driving procurement toward documented, audited supply chains that shift verification costs onto producers. Meeting ESG standards can unlock premiums or access to European and corporate buyers; FutEra initiatives may strengthen Razor’s credibility and pricing power.
- Documentation shifts audit costs to producers
- Certification can unlock premium markets
- FutEra initiatives bolster Razor’s positioning
Switching among producers is easy
Hydrocarbon products are largely undifferentiated, so buyers treat crude and refined fuels as interchangeable; global oil demand was about 101 million barrels per day in 2024 (IEA), reinforcing broad fungibility. Buyers can reallocate volumes across suppliers with minimal friction, keeping pricing disciplined and margins tight. Deep commercial relationships provide limited but real stickiness, often measured in contract tenors and logistics integration.
- Undifferentiated product: high fungibility
- Reallocation speed: low switching costs
- Pricing effect: disciplined market, compressed margins
- Stickiness: moderate—contracts/logistics give some loyalty
Buyers dominate 2024 oil market — 101.8 mb/d demand, quality & transport pressure
Bargaining power of customers is high: global oil demand ~101.8 mb/d in 2024 (IEA) concentrates buyers and keeps Razor a price-taker; WTI/AECO benchmarks and quality differentials (≈10–30 USD/bbl) limit premiums. Transportation/basis drags (≈5–25 USD/bbl) and strict specs raise buyer leverage; storage (SPR ≈714 million bbl in 2024) and certification can mitigate discounts.
| Metric | 2024 | Impact on Razor |
|---|---|---|
| Global demand | 101.8 mb/d | Concentrated buyer power |
| Quality diff | 10–30 USD/bbl | Limits premiums |
| Basis/transport | 5–25 USD/bbl | Reduces netbacks |
| SPR capacity | ≈714 mln bbl | Reduces forced sales |
What You See Is What You Get
Razor Energy Porter's Five Forces Analysis
This preview shows the exact Razor Energy Porter's Five Forces Analysis you'll receive immediately after purchase—no placeholders or edits. The document displayed is fully formatted, professionally written and ready for download the moment you buy. You're looking at the final deliverable.

Don't Miss the Bigger Picture
Razor Energy’s Porter’s Five Forces snapshot highlights supplier leverage, buyer pressure, moderate barriers to entry and substitution risks in the upstream energy space. It outlines strategic vulnerabilities and opportunity areas for value capture. This brief only scratches the surface—unlock the full analysis for force-by-force ratings, visuals and actionable recommendations.
Suppliers Bargaining Power
Concentrated oilfield services
Drilling, completion and workover providers in Western Canada are relatively concentrated, with major contractors such as Precision, Calfrac and Ensign accounting for over 60% of active fleets, giving suppliers leverage in busy cycles. Day rates and equipment availability have shown volatility tied to commodity swings — 2024 saw seasonal day-rate uplifts of 15–30% in peak months. Razor’s mature-asset focus reduces rig intensity but still depends on key service categories like fracturing and coiled tubing. Multi-year contracts and bundled services modestly temper supplier power.
Pipeline and midstream dependence
Takeaway capacity, processing and storage in Western Canada are concentrated with midstream incumbents such as Enbridge and TC Energy, whose crude systems collectively handle over 3 million b/d, allowing constraints to force local differentials or curtailments and raising supplier power. Long-term toll agreements and tariff structures limit producer flexibility and can lock in basis risk. Alternative outlets via rail or trucking lower dependence but typically add roughly US$10–20 per barrel and only partially mitigate bottlenecks.
Specialized equipment and parts
Artificial lift, compression and emissions‑reduction components are supplied by a concentrated set of qualified vendors (top suppliers often account for >50% of capacity), creating switching costs as lead times of 12–24 weeks and tight specs limit alternatives. Supply chain tightness has driven project delays and equipment cost inflation of roughly 10–20% in 2022–24. Maintaining 6–12 months of strategic inventory and standardizing specs across assets reduces bottleneck risk.
Power and fuel inputs
Electricity (~11.8¢/kWh US industrial average in 2024) and natural gas (Henry Hub ~$2.55/MMBtu 2024 average) are material cost drivers for Razor Energy; volatile power prices and grid constraints can compress margins. FutEra’s co-generation can hedge a portion of on-site power demand and lower carbon intensity, while hedging and demand management cut exposure but cannot eliminate market and grid risk.
- Power cost: 11.8¢/kWh (US industrial avg, 2024)
- Gas price: $2.55/MMBtu (Henry Hub avg, 2024)
- Co-generation: partial on-site hedge, lowers intensity
- Hedging/demand mgmt: reduces but does not fully remove exposure
Skilled labor availability
- Skilled crew scarcity: cyclical, concentrated in upturns
- Wage pressure: ≈6% industry pay rise into 2024
- ESG/safety: raises entry barriers
- Mitigants: training pipelines and contractor networks
Moderate–high supplier power: concentrated drilling, midstream bottlenecks, rig rates +15–30%
Suppliers exert moderate–high power: drilling contractors (Precision/Calfrac/Ensign >60% fleets) and midstream (Enbridge/TC ≈3.0M b/d) can push rates and cause bottlenecks; 2024 saw rig day‑rates +15–30% seasonally and equipment cost inflation ~10–20%. Critical vendors have 12–24 week lead times; rail/road alternatives add ~US$10–20/bbl. Long contracts, inventory and bundling partly mitigate risk.
| Category | Concentration | Key metrics (2024) | Mitigants |
|---|---|---|---|
| Drilling | High | 60% fleet; day‑rates +15–30% | multi‑yr contracts |
| Midstream | High | 3.0M b/d; tariffs | rail/truck (+$10–20/bbl) |
| Equipment | Concentrated | lead 12–24 wks; costs +10–20% | inventory, standard specs |
| Energy | Market | Power 11.8¢/kWh; gas $2.55/MMBtu | on‑site cogeneration, hedges |
What is included in the product
Detailed Word Document
Concise Porter’s Five Forces for Razor Energy, revealing competitive intensity, supplier/buyer leverage, entry barriers, substitution risks, and actionable insights to safeguard margins and inform strategic moves.
Customizable Excel Spreadsheet
A concise one-sheet Porter’s Five Forces for Razor Energy that turns complex competitive dynamics into actionable priorities. Customizable pressure levels and a ready-to-use radar chart make strategic decisions fast and slide-ready.
Customers Bargaining Power
Commodity buyers are few, large
Crude and gas are sold to a small number of refiners, marketers and utilities, and in 2024 global oil demand averaged about 101.8 million barrels per day (IEA), concentrating purchasing power. Large buyers can insist on favorable payment terms and tight quality specs, keeping Razor a price taker with limited ability to secure meaningful premiums. Razor's counterparty diversification and marketing optionality help dilute buyer power by spreading sales across multiple offtakers and routes.
Price benchmarks set terms
WTI and AECO benchmarks largely set pricing formulas for Razor Energy, with quality differentials vs WTI typically widening realized crude prices by roughly 10–30 USD/bbl for heavy grades. Buyers rigorously enforce market-linked formulas and resist premium deviations, constraining seller leverage. Transportation and basis costs commonly shave 5–25 USD/bbl from netbacks; improving crude quality and managing basis can boost realizations by several USD/bbl.
Logistics and delivery risk
Buyers can penalize Razor Energy for delivery variability or off-spec volumes through allocation adjustments and price deductions, increasing realized discounts on crude and condensate. Pipeline nominations and scheduling rules give purchasers leverage over timing and volumes, often forcing sellers to accept reallocations. Access to storage — global SPR capacity ~714 million barrels in 2024 — reduces need for forced sales at steep discounts. Operational reliability is therefore critical to preserve pricing and minimize buyer leverage.
ESG and certification demands
Buyers increasingly favor lower-carbon barrels and certified gas, driving procurement toward documented, audited supply chains that shift verification costs onto producers. Meeting ESG standards can unlock premiums or access to European and corporate buyers; FutEra initiatives may strengthen Razor’s credibility and pricing power.
- Documentation shifts audit costs to producers
- Certification can unlock premium markets
- FutEra initiatives bolster Razor’s positioning
Switching among producers is easy
Hydrocarbon products are largely undifferentiated, so buyers treat crude and refined fuels as interchangeable; global oil demand was about 101 million barrels per day in 2024 (IEA), reinforcing broad fungibility. Buyers can reallocate volumes across suppliers with minimal friction, keeping pricing disciplined and margins tight. Deep commercial relationships provide limited but real stickiness, often measured in contract tenors and logistics integration.
- Undifferentiated product: high fungibility
- Reallocation speed: low switching costs
- Pricing effect: disciplined market, compressed margins
- Stickiness: moderate—contracts/logistics give some loyalty
Buyers dominate 2024 oil market — 101.8 mb/d demand, quality & transport pressure
Bargaining power of customers is high: global oil demand ~101.8 mb/d in 2024 (IEA) concentrates buyers and keeps Razor a price-taker; WTI/AECO benchmarks and quality differentials (≈10–30 USD/bbl) limit premiums. Transportation/basis drags (≈5–25 USD/bbl) and strict specs raise buyer leverage; storage (SPR ≈714 million bbl in 2024) and certification can mitigate discounts.
| Metric | 2024 | Impact on Razor |
|---|---|---|
| Global demand | 101.8 mb/d | Concentrated buyer power |
| Quality diff | 10–30 USD/bbl | Limits premiums |
| Basis/transport | 5–25 USD/bbl | Reduces netbacks |
| SPR capacity | ≈714 mln bbl | Reduces forced sales |
What You See Is What You Get
Razor Energy Porter's Five Forces Analysis
This preview shows the exact Razor Energy Porter's Five Forces Analysis you'll receive immediately after purchase—no placeholders or edits. The document displayed is fully formatted, professionally written and ready for download the moment you buy. You're looking at the final deliverable.
Description
Don't Miss the Bigger Picture
Razor Energy’s Porter’s Five Forces snapshot highlights supplier leverage, buyer pressure, moderate barriers to entry and substitution risks in the upstream energy space. It outlines strategic vulnerabilities and opportunity areas for value capture. This brief only scratches the surface—unlock the full analysis for force-by-force ratings, visuals and actionable recommendations.
Suppliers Bargaining Power
Concentrated oilfield services
Drilling, completion and workover providers in Western Canada are relatively concentrated, with major contractors such as Precision, Calfrac and Ensign accounting for over 60% of active fleets, giving suppliers leverage in busy cycles. Day rates and equipment availability have shown volatility tied to commodity swings — 2024 saw seasonal day-rate uplifts of 15–30% in peak months. Razor’s mature-asset focus reduces rig intensity but still depends on key service categories like fracturing and coiled tubing. Multi-year contracts and bundled services modestly temper supplier power.
Pipeline and midstream dependence
Takeaway capacity, processing and storage in Western Canada are concentrated with midstream incumbents such as Enbridge and TC Energy, whose crude systems collectively handle over 3 million b/d, allowing constraints to force local differentials or curtailments and raising supplier power. Long-term toll agreements and tariff structures limit producer flexibility and can lock in basis risk. Alternative outlets via rail or trucking lower dependence but typically add roughly US$10–20 per barrel and only partially mitigate bottlenecks.
Specialized equipment and parts
Artificial lift, compression and emissions‑reduction components are supplied by a concentrated set of qualified vendors (top suppliers often account for >50% of capacity), creating switching costs as lead times of 12–24 weeks and tight specs limit alternatives. Supply chain tightness has driven project delays and equipment cost inflation of roughly 10–20% in 2022–24. Maintaining 6–12 months of strategic inventory and standardizing specs across assets reduces bottleneck risk.
Power and fuel inputs
Electricity (~11.8¢/kWh US industrial average in 2024) and natural gas (Henry Hub ~$2.55/MMBtu 2024 average) are material cost drivers for Razor Energy; volatile power prices and grid constraints can compress margins. FutEra’s co-generation can hedge a portion of on-site power demand and lower carbon intensity, while hedging and demand management cut exposure but cannot eliminate market and grid risk.
- Power cost: 11.8¢/kWh (US industrial avg, 2024)
- Gas price: $2.55/MMBtu (Henry Hub avg, 2024)
- Co-generation: partial on-site hedge, lowers intensity
- Hedging/demand mgmt: reduces but does not fully remove exposure
Skilled labor availability
- Skilled crew scarcity: cyclical, concentrated in upturns
- Wage pressure: ≈6% industry pay rise into 2024
- ESG/safety: raises entry barriers
- Mitigants: training pipelines and contractor networks
Moderate–high supplier power: concentrated drilling, midstream bottlenecks, rig rates +15–30%
Suppliers exert moderate–high power: drilling contractors (Precision/Calfrac/Ensign >60% fleets) and midstream (Enbridge/TC ≈3.0M b/d) can push rates and cause bottlenecks; 2024 saw rig day‑rates +15–30% seasonally and equipment cost inflation ~10–20%. Critical vendors have 12–24 week lead times; rail/road alternatives add ~US$10–20/bbl. Long contracts, inventory and bundling partly mitigate risk.
| Category | Concentration | Key metrics (2024) | Mitigants |
|---|---|---|---|
| Drilling | High | 60% fleet; day‑rates +15–30% | multi‑yr contracts |
| Midstream | High | 3.0M b/d; tariffs | rail/truck (+$10–20/bbl) |
| Equipment | Concentrated | lead 12–24 wks; costs +10–20% | inventory, standard specs |
| Energy | Market | Power 11.8¢/kWh; gas $2.55/MMBtu | on‑site cogeneration, hedges |
What is included in the product
Detailed Word Document
Concise Porter’s Five Forces for Razor Energy, revealing competitive intensity, supplier/buyer leverage, entry barriers, substitution risks, and actionable insights to safeguard margins and inform strategic moves.
Customizable Excel Spreadsheet
A concise one-sheet Porter’s Five Forces for Razor Energy that turns complex competitive dynamics into actionable priorities. Customizable pressure levels and a ready-to-use radar chart make strategic decisions fast and slide-ready.
Customers Bargaining Power
Commodity buyers are few, large
Crude and gas are sold to a small number of refiners, marketers and utilities, and in 2024 global oil demand averaged about 101.8 million barrels per day (IEA), concentrating purchasing power. Large buyers can insist on favorable payment terms and tight quality specs, keeping Razor a price taker with limited ability to secure meaningful premiums. Razor's counterparty diversification and marketing optionality help dilute buyer power by spreading sales across multiple offtakers and routes.
Price benchmarks set terms
WTI and AECO benchmarks largely set pricing formulas for Razor Energy, with quality differentials vs WTI typically widening realized crude prices by roughly 10–30 USD/bbl for heavy grades. Buyers rigorously enforce market-linked formulas and resist premium deviations, constraining seller leverage. Transportation and basis costs commonly shave 5–25 USD/bbl from netbacks; improving crude quality and managing basis can boost realizations by several USD/bbl.
Logistics and delivery risk
Buyers can penalize Razor Energy for delivery variability or off-spec volumes through allocation adjustments and price deductions, increasing realized discounts on crude and condensate. Pipeline nominations and scheduling rules give purchasers leverage over timing and volumes, often forcing sellers to accept reallocations. Access to storage — global SPR capacity ~714 million barrels in 2024 — reduces need for forced sales at steep discounts. Operational reliability is therefore critical to preserve pricing and minimize buyer leverage.
ESG and certification demands
Buyers increasingly favor lower-carbon barrels and certified gas, driving procurement toward documented, audited supply chains that shift verification costs onto producers. Meeting ESG standards can unlock premiums or access to European and corporate buyers; FutEra initiatives may strengthen Razor’s credibility and pricing power.
- Documentation shifts audit costs to producers
- Certification can unlock premium markets
- FutEra initiatives bolster Razor’s positioning
Switching among producers is easy
Hydrocarbon products are largely undifferentiated, so buyers treat crude and refined fuels as interchangeable; global oil demand was about 101 million barrels per day in 2024 (IEA), reinforcing broad fungibility. Buyers can reallocate volumes across suppliers with minimal friction, keeping pricing disciplined and margins tight. Deep commercial relationships provide limited but real stickiness, often measured in contract tenors and logistics integration.
- Undifferentiated product: high fungibility
- Reallocation speed: low switching costs
- Pricing effect: disciplined market, compressed margins
- Stickiness: moderate—contracts/logistics give some loyalty
Buyers dominate 2024 oil market — 101.8 mb/d demand, quality & transport pressure
Bargaining power of customers is high: global oil demand ~101.8 mb/d in 2024 (IEA) concentrates buyers and keeps Razor a price-taker; WTI/AECO benchmarks and quality differentials (≈10–30 USD/bbl) limit premiums. Transportation/basis drags (≈5–25 USD/bbl) and strict specs raise buyer leverage; storage (SPR ≈714 million bbl in 2024) and certification can mitigate discounts.
| Metric | 2024 | Impact on Razor |
|---|---|---|
| Global demand | 101.8 mb/d | Concentrated buyer power |
| Quality diff | 10–30 USD/bbl | Limits premiums |
| Basis/transport | 5–25 USD/bbl | Reduces netbacks |
| SPR capacity | ≈714 mln bbl | Reduces forced sales |
What You See Is What You Get
Razor Energy Porter's Five Forces Analysis
This preview shows the exact Razor Energy Porter's Five Forces Analysis you'll receive immediately after purchase—no placeholders or edits. The document displayed is fully formatted, professionally written and ready for download the moment you buy. You're looking at the final deliverable.











