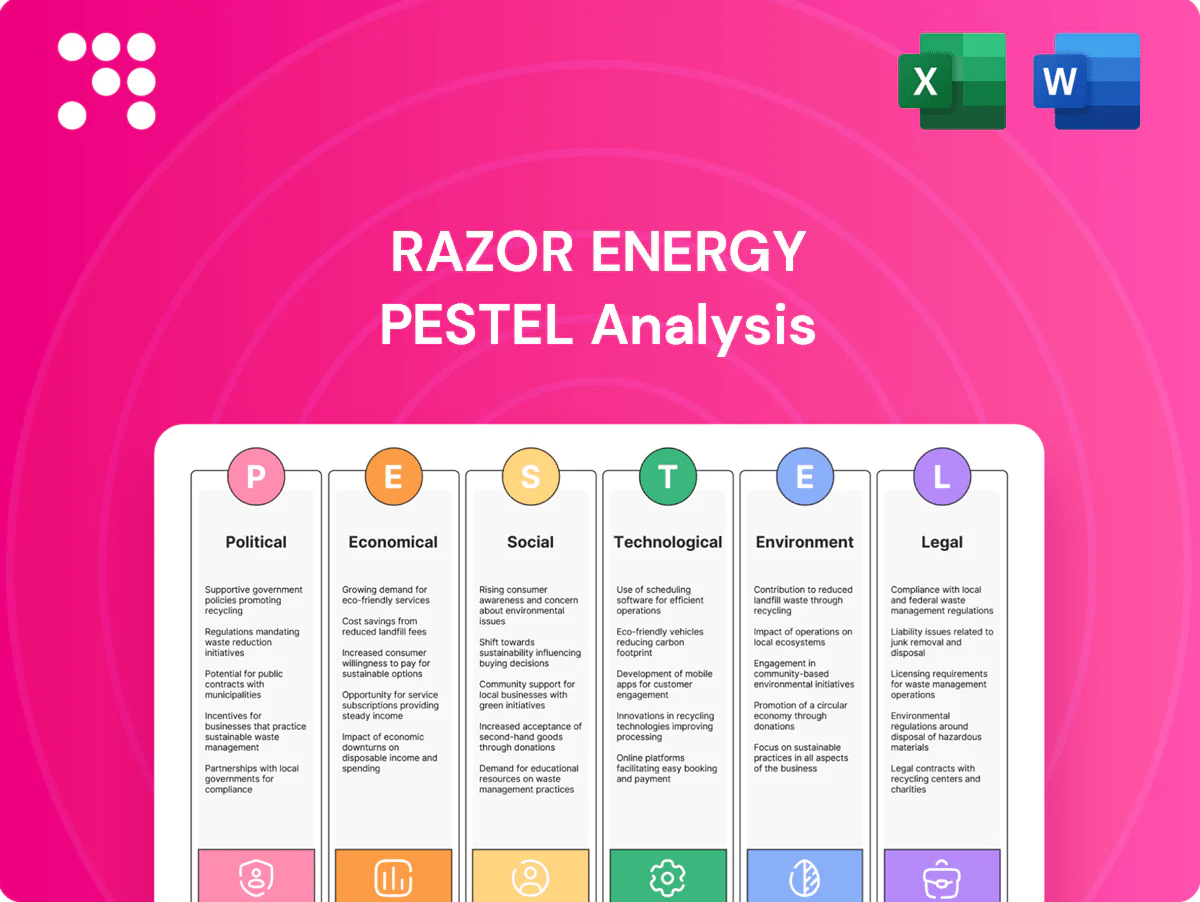
Razor Energy PESTLE Analysis

Your Competitive Advantage Starts with This Report
Unlock competitive advantage with our concise PESTLE Analysis of Razor Energy—revealing how regulatory shifts, market cycles, and environmental trends shape strategy and valuation. Ideal for investors and advisors, it translates external forces into actionable insights. Purchase the full report for the complete, editable breakdown and immediate strategic use.
Political factors

Alberta royalty and fiscal policy
Razor’s cash flows hinge on Alberta royalty frameworks and incentive programs; provincial royalty rates for conventional oil and gas use sliding scales that can reach about 40% at higher commodity prices. Changes to royalty rates or carbon levies (federal carbon price $50/t in 2022 rising to $170/t by 2030) can materially alter project NPV and acquisition valuations. Stability favors long-cycle optimization of legacy assets, so policy shifts require flexible capital allocation.
Federal climate targets direction
Canada's 40–45% emissions cut vs 2005 by 2030 and net-zero by 2050 accelerate decarbonization timetables; federal carbon price rose to CAD95/t in 2025 and is legislated to reach CAD170/t by 2030. Stricter standards increase emissions-abatement capex for oil & gas, while FutEra's low-carbon power offers a policy-risk hedge; misalignment raises compliance and transition risk.

Pipeline and export infrastructure
Political support for pipelines and export egress (Trans Mountain 890 kbpd, Line 3 760 kbpd; ~1.65 mbpd added) directly narrows differentials—WCS averaged ~US$26–28/bbl discount in 2024—boosting Razor’s realized pricing. Bottlenecks widen discounts, depress netbacks and raise storage/rail premiums (rail ~$10–15/bbl), increasing working capital and storage costs. Improved access raises netbacks and M&A rationale; delays force greater rail use and basis risk management.

Indigenous engagement expectations
Government emphasis on Indigenous consultation lengthens permitting timelines and can alter Razor Energy project schedules; Canada’s 2021 Indigenous population was 5.0% (1.8M), highlighting local partner/workforce potential. Strong partnerships and benefits agreements reduce social opposition and project risk but require upfront commitments and capital. Poor engagement can trigger delays and reputational damage.
- Consultation-driven delays: higher permitting risk
- Benefits agreements: improve local support, add upfront costs
- Partnerships: lower social opposition
- Poor engagement: delays, reputational harm
Grid and power market policy
Provincial power-market rules directly shape returns on co-generation and green assets, with market design and tariffs determining project IRRs; interconnection queue congestion is material—FERC reported about 1,200 GW in U.S. queues in 2023, highlighting delays that can stall investments. Incentives for behind-the-fence generation support FutEra projects, but policy uncertainty raises financing risk until clear interconnection and pricing frameworks are set.
- Market rules impact asset IRR
- 1,200 GW U.S. interconnection backlog (2023)
- Behind-the-fence incentives boost FutEra
- Policy uncertainty stalls capex
- Clear tariffs/interconnection unlock value
High royalties, steep carbon costs and transport gaps squeeze oil project returns
Provincial royalties (~up to 40% at high prices) and federal carbon pricing (CAD95/t in 2025, CAD170/t by 2030) materially affect Razor’s NPV and capex. Pipeline egress (~1.65 mbpd added) and WCS differentials (~US$26–28/bbl in 2024) drive realized pricing and rail costs (~US$10–15/bbl). Indigenous consultation (5.0% pop, 1.8M) and interconnection backlogs (~1,200 GW) lengthen schedules and raise upfront costs.
| Metric | Value |
|---|---|
| Carbon price | CAD95/t (2025), CAD170/t (2030) |
| WCS differential | US$26–28/bbl (2024) |
| Pipeline egress added | ~1.65 mbpd |
| Rail premium | US$10–15/bbl |
| Indigenous pop | 5.0% (1.8M) |
| Interconnection backlog | ~1,200 GW (2023) |
What is included in the product
 Detailed Word Document
Explores how Political, Economic, Social, Technological, Environmental and Legal forces uniquely impact Razor Energy, with each category expanded into tailored sub-points and backed by current market and regulatory trends. Designed to guide executives and investors in spotting risks, opportunities and scenario-driven strategies.

 Customizable Excel Spreadsheet
A concise, visually segmented PESTLE summary for Razor Energy that distills regulatory, economic, social, technological, environmental and legal risks into slide-ready bullets. Editable notes and shareable format streamline team alignment and risk discussions during strategy sessions.
Economic factors

Commodity price volatility
WTI averaged about US$77/bbl in 2024 while WCS differentials widened to roughly US$17/bbl, and AECO averaged near C$2.80/mcf, driving Razor Energy’s revenue and capex flexibility; hedging programs smooth cash flows but cap upside on windfalls; downturns create acquisition windows for acreage at lower multiples; active differential management (e.g., rail, blending, condensate swaps) is critical to preserve per‑boe margins.
Interest rates and credit access
Higher interest rates raise Razor Energy’s borrowing costs and hurdle rates, with the US federal funds rate near 5.25% increasing required returns on projects. Reserve-based lending availability remains a primary constraint, directly guiding drilling activity and M&A tempo in the oilpatch. Industry deleveraging through 2023–2025 has improved balance-sheet resilience across peers. Continued capital discipline sustains investor confidence and access to markets.

CAD–USD exchange rate
Oil is priced in USD while Razor Energy’s costs are largely in CAD, so each 1% CAD appreciation vs USD reduces USD revenues by about 1% in CAD terms; as of July 2025 USD/CAD ≈1.33 (1 CAD ≈0.75 USD). With WTI near US$80/bbl in mid‑2025 a weaker CAD boosted CAD revenues, while a stronger CAD compresses margins. FX hedges can stabilize budgets, so planning must include multiple currency scenarios and sensitivities.

Inflation and service costs
Inflation in 2024 (US CPI ~3.4%) lifted equipment, labor and OFS charges, extending cycle times as supplier bottlenecks delayed turnarounds; energy-sector wage growth ran near 5–6% in 2024, pressuring operating costs. Razor Energy offsets with efficiency gains, vendor consolidation and longer-term contracts, keeping cost control central to protecting free cash flow.
- Equipment inflation: sustained upward pressure in 2024
- Labor: ~5–6% wage growth in energy, raising opex
- OFS/supply: bottlenecks prolong turnarounds
- Mitigation: efficiency, vendor strategies, contracts
- Priority: cost control to defend free cash flow
Power prices and cogeneration
Alberta power price volatility materially affects FutEra project returns; market spikes have produced hourly prices above CAD 1,000/MWh in extreme events while average wholesale levels remain highly variable, and residential rates near CAD 0.125/kWh in 2024 underline market value for generated power. Self-supply via cogeneration cuts operating costs and upstream emissions, but revenue certainty demands prudent offtake and fixed-price contracting.
- High-price capture: boosts electricity revenue
- Self-supply: lowers OPEX and emissions
- Volatility: requires firm offtake/contracts
High royalties, steep carbon costs and transport gaps squeeze oil project returns
WTI ~US$80/bbl and WCS differential ~US$17/bbl in 2024–25 drive revenue; AECO ~C$2.80/mcf. Higher rates (Fed funds ~5.25%) and tighter RBLs raise funding costs and capex hurdles. USD/CAD ≈1.33 and ~3.4% inflation with 5–6% energy wage growth compress margins; Alberta power volatility (avg C$0.125/kWh) affects FutEra returns.
| Metric | 2024/25 | Impact |
|---|---|---|
| WTI | US$80/bbl | Revenue driver |
| WCS diff | US$17/bbl | Margin pressure |
| AECO | C$2.80/mcf | Gas revs |
| USD/CAD | 1.33 | FX exposure |
| Fed funds | ~5.25% | Cost of capital |
| CPI | ~3.4% | Opex inflation |
| Wage growth | 5–6% | Opex pressure |
| Alberta power | C$0.125/kWh avg | Project returns |
Same Document Delivered
Razor Energy PESTLE Analysis
The Razor Energy PESTLE Analysis preview shown here is the exact document you’ll receive after purchase—fully formatted and ready to use. This file contains the same content, structure, and professional layout visible in the preview, with actionable political, economic, social, technological, legal, and environmental insights. After checkout you’ll immediately download this exact, finished report—no placeholders, no surprises.

Your Competitive Advantage Starts with This Report
Unlock competitive advantage with our concise PESTLE Analysis of Razor Energy—revealing how regulatory shifts, market cycles, and environmental trends shape strategy and valuation. Ideal for investors and advisors, it translates external forces into actionable insights. Purchase the full report for the complete, editable breakdown and immediate strategic use.
Political factors
Alberta royalty and fiscal policy
Razor’s cash flows hinge on Alberta royalty frameworks and incentive programs; provincial royalty rates for conventional oil and gas use sliding scales that can reach about 40% at higher commodity prices. Changes to royalty rates or carbon levies (federal carbon price $50/t in 2022 rising to $170/t by 2030) can materially alter project NPV and acquisition valuations. Stability favors long-cycle optimization of legacy assets, so policy shifts require flexible capital allocation.
Federal climate targets direction
Canada's 40–45% emissions cut vs 2005 by 2030 and net-zero by 2050 accelerate decarbonization timetables; federal carbon price rose to CAD95/t in 2025 and is legislated to reach CAD170/t by 2030. Stricter standards increase emissions-abatement capex for oil & gas, while FutEra's low-carbon power offers a policy-risk hedge; misalignment raises compliance and transition risk.
Pipeline and export infrastructure
Political support for pipelines and export egress (Trans Mountain 890 kbpd, Line 3 760 kbpd; ~1.65 mbpd added) directly narrows differentials—WCS averaged ~US$26–28/bbl discount in 2024—boosting Razor’s realized pricing. Bottlenecks widen discounts, depress netbacks and raise storage/rail premiums (rail ~$10–15/bbl), increasing working capital and storage costs. Improved access raises netbacks and M&A rationale; delays force greater rail use and basis risk management.
Indigenous engagement expectations
Government emphasis on Indigenous consultation lengthens permitting timelines and can alter Razor Energy project schedules; Canada’s 2021 Indigenous population was 5.0% (1.8M), highlighting local partner/workforce potential. Strong partnerships and benefits agreements reduce social opposition and project risk but require upfront commitments and capital. Poor engagement can trigger delays and reputational damage.
- Consultation-driven delays: higher permitting risk
- Benefits agreements: improve local support, add upfront costs
- Partnerships: lower social opposition
- Poor engagement: delays, reputational harm
Grid and power market policy
Provincial power-market rules directly shape returns on co-generation and green assets, with market design and tariffs determining project IRRs; interconnection queue congestion is material—FERC reported about 1,200 GW in U.S. queues in 2023, highlighting delays that can stall investments. Incentives for behind-the-fence generation support FutEra projects, but policy uncertainty raises financing risk until clear interconnection and pricing frameworks are set.
- Market rules impact asset IRR
- 1,200 GW U.S. interconnection backlog (2023)
- Behind-the-fence incentives boost FutEra
- Policy uncertainty stalls capex
- Clear tariffs/interconnection unlock value
High royalties, steep carbon costs and transport gaps squeeze oil project returns
Provincial royalties (~up to 40% at high prices) and federal carbon pricing (CAD95/t in 2025, CAD170/t by 2030) materially affect Razor’s NPV and capex. Pipeline egress (~1.65 mbpd added) and WCS differentials (~US$26–28/bbl in 2024) drive realized pricing and rail costs (~US$10–15/bbl). Indigenous consultation (5.0% pop, 1.8M) and interconnection backlogs (~1,200 GW) lengthen schedules and raise upfront costs.
| Metric | Value |
|---|---|
| Carbon price | CAD95/t (2025), CAD170/t (2030) |
| WCS differential | US$26–28/bbl (2024) |
| Pipeline egress added | ~1.65 mbpd |
| Rail premium | US$10–15/bbl |
| Indigenous pop | 5.0% (1.8M) |
| Interconnection backlog | ~1,200 GW (2023) |
What is included in the product
Detailed Word Document
Explores how Political, Economic, Social, Technological, Environmental and Legal forces uniquely impact Razor Energy, with each category expanded into tailored sub-points and backed by current market and regulatory trends. Designed to guide executives and investors in spotting risks, opportunities and scenario-driven strategies.
Customizable Excel Spreadsheet
A concise, visually segmented PESTLE summary for Razor Energy that distills regulatory, economic, social, technological, environmental and legal risks into slide-ready bullets. Editable notes and shareable format streamline team alignment and risk discussions during strategy sessions.
Economic factors
Commodity price volatility
WTI averaged about US$77/bbl in 2024 while WCS differentials widened to roughly US$17/bbl, and AECO averaged near C$2.80/mcf, driving Razor Energy’s revenue and capex flexibility; hedging programs smooth cash flows but cap upside on windfalls; downturns create acquisition windows for acreage at lower multiples; active differential management (e.g., rail, blending, condensate swaps) is critical to preserve per‑boe margins.
Interest rates and credit access
Higher interest rates raise Razor Energy’s borrowing costs and hurdle rates, with the US federal funds rate near 5.25% increasing required returns on projects. Reserve-based lending availability remains a primary constraint, directly guiding drilling activity and M&A tempo in the oilpatch. Industry deleveraging through 2023–2025 has improved balance-sheet resilience across peers. Continued capital discipline sustains investor confidence and access to markets.
CAD–USD exchange rate
Oil is priced in USD while Razor Energy’s costs are largely in CAD, so each 1% CAD appreciation vs USD reduces USD revenues by about 1% in CAD terms; as of July 2025 USD/CAD ≈1.33 (1 CAD ≈0.75 USD). With WTI near US$80/bbl in mid‑2025 a weaker CAD boosted CAD revenues, while a stronger CAD compresses margins. FX hedges can stabilize budgets, so planning must include multiple currency scenarios and sensitivities.
Inflation and service costs
Inflation in 2024 (US CPI ~3.4%) lifted equipment, labor and OFS charges, extending cycle times as supplier bottlenecks delayed turnarounds; energy-sector wage growth ran near 5–6% in 2024, pressuring operating costs. Razor Energy offsets with efficiency gains, vendor consolidation and longer-term contracts, keeping cost control central to protecting free cash flow.
- Equipment inflation: sustained upward pressure in 2024
- Labor: ~5–6% wage growth in energy, raising opex
- OFS/supply: bottlenecks prolong turnarounds
- Mitigation: efficiency, vendor strategies, contracts
- Priority: cost control to defend free cash flow
Power prices and cogeneration
Alberta power price volatility materially affects FutEra project returns; market spikes have produced hourly prices above CAD 1,000/MWh in extreme events while average wholesale levels remain highly variable, and residential rates near CAD 0.125/kWh in 2024 underline market value for generated power. Self-supply via cogeneration cuts operating costs and upstream emissions, but revenue certainty demands prudent offtake and fixed-price contracting.
- High-price capture: boosts electricity revenue
- Self-supply: lowers OPEX and emissions
- Volatility: requires firm offtake/contracts
High royalties, steep carbon costs and transport gaps squeeze oil project returns
WTI ~US$80/bbl and WCS differential ~US$17/bbl in 2024–25 drive revenue; AECO ~C$2.80/mcf. Higher rates (Fed funds ~5.25%) and tighter RBLs raise funding costs and capex hurdles. USD/CAD ≈1.33 and ~3.4% inflation with 5–6% energy wage growth compress margins; Alberta power volatility (avg C$0.125/kWh) affects FutEra returns.
| Metric | 2024/25 | Impact |
|---|---|---|
| WTI | US$80/bbl | Revenue driver |
| WCS diff | US$17/bbl | Margin pressure |
| AECO | C$2.80/mcf | Gas revs |
| USD/CAD | 1.33 | FX exposure |
| Fed funds | ~5.25% | Cost of capital |
| CPI | ~3.4% | Opex inflation |
| Wage growth | 5–6% | Opex pressure |
| Alberta power | C$0.125/kWh avg | Project returns |
Same Document Delivered
Razor Energy PESTLE Analysis
The Razor Energy PESTLE Analysis preview shown here is the exact document you’ll receive after purchase—fully formatted and ready to use. This file contains the same content, structure, and professional layout visible in the preview, with actionable political, economic, social, technological, legal, and environmental insights. After checkout you’ll immediately download this exact, finished report—no placeholders, no surprises.
Original: $10.00
-65%$10.00
$3.50Description
Your Competitive Advantage Starts with This Report
Unlock competitive advantage with our concise PESTLE Analysis of Razor Energy—revealing how regulatory shifts, market cycles, and environmental trends shape strategy and valuation. Ideal for investors and advisors, it translates external forces into actionable insights. Purchase the full report for the complete, editable breakdown and immediate strategic use.
Political factors
Alberta royalty and fiscal policy
Razor’s cash flows hinge on Alberta royalty frameworks and incentive programs; provincial royalty rates for conventional oil and gas use sliding scales that can reach about 40% at higher commodity prices. Changes to royalty rates or carbon levies (federal carbon price $50/t in 2022 rising to $170/t by 2030) can materially alter project NPV and acquisition valuations. Stability favors long-cycle optimization of legacy assets, so policy shifts require flexible capital allocation.
Federal climate targets direction
Canada's 40–45% emissions cut vs 2005 by 2030 and net-zero by 2050 accelerate decarbonization timetables; federal carbon price rose to CAD95/t in 2025 and is legislated to reach CAD170/t by 2030. Stricter standards increase emissions-abatement capex for oil & gas, while FutEra's low-carbon power offers a policy-risk hedge; misalignment raises compliance and transition risk.
Pipeline and export infrastructure
Political support for pipelines and export egress (Trans Mountain 890 kbpd, Line 3 760 kbpd; ~1.65 mbpd added) directly narrows differentials—WCS averaged ~US$26–28/bbl discount in 2024—boosting Razor’s realized pricing. Bottlenecks widen discounts, depress netbacks and raise storage/rail premiums (rail ~$10–15/bbl), increasing working capital and storage costs. Improved access raises netbacks and M&A rationale; delays force greater rail use and basis risk management.
Indigenous engagement expectations
Government emphasis on Indigenous consultation lengthens permitting timelines and can alter Razor Energy project schedules; Canada’s 2021 Indigenous population was 5.0% (1.8M), highlighting local partner/workforce potential. Strong partnerships and benefits agreements reduce social opposition and project risk but require upfront commitments and capital. Poor engagement can trigger delays and reputational damage.
- Consultation-driven delays: higher permitting risk
- Benefits agreements: improve local support, add upfront costs
- Partnerships: lower social opposition
- Poor engagement: delays, reputational harm
Grid and power market policy
Provincial power-market rules directly shape returns on co-generation and green assets, with market design and tariffs determining project IRRs; interconnection queue congestion is material—FERC reported about 1,200 GW in U.S. queues in 2023, highlighting delays that can stall investments. Incentives for behind-the-fence generation support FutEra projects, but policy uncertainty raises financing risk until clear interconnection and pricing frameworks are set.
- Market rules impact asset IRR
- 1,200 GW U.S. interconnection backlog (2023)
- Behind-the-fence incentives boost FutEra
- Policy uncertainty stalls capex
- Clear tariffs/interconnection unlock value
High royalties, steep carbon costs and transport gaps squeeze oil project returns
Provincial royalties (~up to 40% at high prices) and federal carbon pricing (CAD95/t in 2025, CAD170/t by 2030) materially affect Razor’s NPV and capex. Pipeline egress (~1.65 mbpd added) and WCS differentials (~US$26–28/bbl in 2024) drive realized pricing and rail costs (~US$10–15/bbl). Indigenous consultation (5.0% pop, 1.8M) and interconnection backlogs (~1,200 GW) lengthen schedules and raise upfront costs.
| Metric | Value |
|---|---|
| Carbon price | CAD95/t (2025), CAD170/t (2030) |
| WCS differential | US$26–28/bbl (2024) |
| Pipeline egress added | ~1.65 mbpd |
| Rail premium | US$10–15/bbl |
| Indigenous pop | 5.0% (1.8M) |
| Interconnection backlog | ~1,200 GW (2023) |
What is included in the product
Detailed Word Document
Explores how Political, Economic, Social, Technological, Environmental and Legal forces uniquely impact Razor Energy, with each category expanded into tailored sub-points and backed by current market and regulatory trends. Designed to guide executives and investors in spotting risks, opportunities and scenario-driven strategies.
Customizable Excel Spreadsheet
A concise, visually segmented PESTLE summary for Razor Energy that distills regulatory, economic, social, technological, environmental and legal risks into slide-ready bullets. Editable notes and shareable format streamline team alignment and risk discussions during strategy sessions.
Economic factors
Commodity price volatility
WTI averaged about US$77/bbl in 2024 while WCS differentials widened to roughly US$17/bbl, and AECO averaged near C$2.80/mcf, driving Razor Energy’s revenue and capex flexibility; hedging programs smooth cash flows but cap upside on windfalls; downturns create acquisition windows for acreage at lower multiples; active differential management (e.g., rail, blending, condensate swaps) is critical to preserve per‑boe margins.
Interest rates and credit access
Higher interest rates raise Razor Energy’s borrowing costs and hurdle rates, with the US federal funds rate near 5.25% increasing required returns on projects. Reserve-based lending availability remains a primary constraint, directly guiding drilling activity and M&A tempo in the oilpatch. Industry deleveraging through 2023–2025 has improved balance-sheet resilience across peers. Continued capital discipline sustains investor confidence and access to markets.
CAD–USD exchange rate
Oil is priced in USD while Razor Energy’s costs are largely in CAD, so each 1% CAD appreciation vs USD reduces USD revenues by about 1% in CAD terms; as of July 2025 USD/CAD ≈1.33 (1 CAD ≈0.75 USD). With WTI near US$80/bbl in mid‑2025 a weaker CAD boosted CAD revenues, while a stronger CAD compresses margins. FX hedges can stabilize budgets, so planning must include multiple currency scenarios and sensitivities.
Inflation and service costs
Inflation in 2024 (US CPI ~3.4%) lifted equipment, labor and OFS charges, extending cycle times as supplier bottlenecks delayed turnarounds; energy-sector wage growth ran near 5–6% in 2024, pressuring operating costs. Razor Energy offsets with efficiency gains, vendor consolidation and longer-term contracts, keeping cost control central to protecting free cash flow.
- Equipment inflation: sustained upward pressure in 2024
- Labor: ~5–6% wage growth in energy, raising opex
- OFS/supply: bottlenecks prolong turnarounds
- Mitigation: efficiency, vendor strategies, contracts
- Priority: cost control to defend free cash flow
Power prices and cogeneration
Alberta power price volatility materially affects FutEra project returns; market spikes have produced hourly prices above CAD 1,000/MWh in extreme events while average wholesale levels remain highly variable, and residential rates near CAD 0.125/kWh in 2024 underline market value for generated power. Self-supply via cogeneration cuts operating costs and upstream emissions, but revenue certainty demands prudent offtake and fixed-price contracting.
- High-price capture: boosts electricity revenue
- Self-supply: lowers OPEX and emissions
- Volatility: requires firm offtake/contracts
High royalties, steep carbon costs and transport gaps squeeze oil project returns
WTI ~US$80/bbl and WCS differential ~US$17/bbl in 2024–25 drive revenue; AECO ~C$2.80/mcf. Higher rates (Fed funds ~5.25%) and tighter RBLs raise funding costs and capex hurdles. USD/CAD ≈1.33 and ~3.4% inflation with 5–6% energy wage growth compress margins; Alberta power volatility (avg C$0.125/kWh) affects FutEra returns.
| Metric | 2024/25 | Impact |
|---|---|---|
| WTI | US$80/bbl | Revenue driver |
| WCS diff | US$17/bbl | Margin pressure |
| AECO | C$2.80/mcf | Gas revs |
| USD/CAD | 1.33 | FX exposure |
| Fed funds | ~5.25% | Cost of capital |
| CPI | ~3.4% | Opex inflation |
| Wage growth | 5–6% | Opex pressure |
| Alberta power | C$0.125/kWh avg | Project returns |
Same Document Delivered
Razor Energy PESTLE Analysis
The Razor Energy PESTLE Analysis preview shown here is the exact document you’ll receive after purchase—fully formatted and ready to use. This file contains the same content, structure, and professional layout visible in the preview, with actionable political, economic, social, technological, legal, and environmental insights. After checkout you’ll immediately download this exact, finished report—no placeholders, no surprises.











