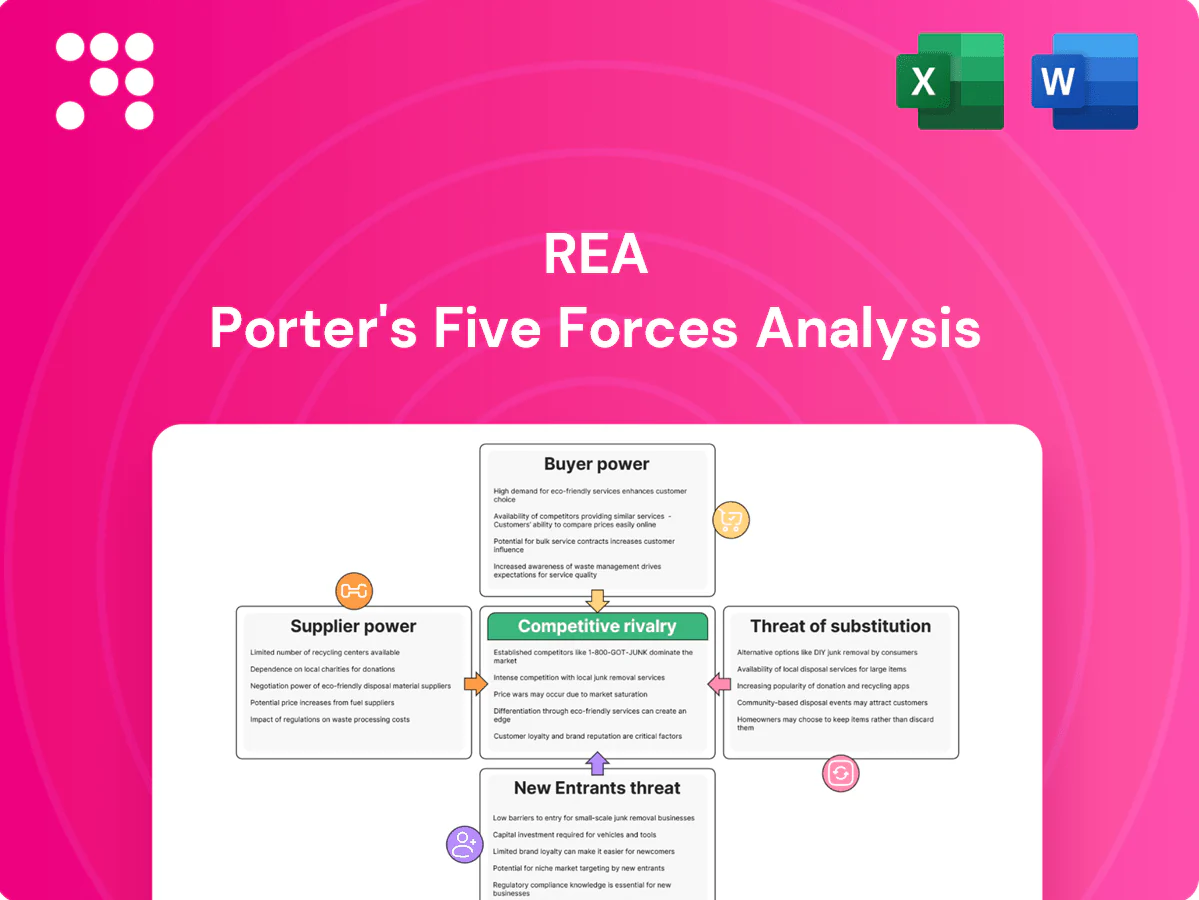
REA Porter's Five Forces Analysis

Don't Miss the Bigger Picture
REA’s Porter’s Five Forces snapshot highlights buyer power, supplier leverage, substitute threats, competitive rivalry, and entry barriers shaping its market position. It reveals key pressure points and strategic levers impacting margins and growth. This brief preview only scratches the surface—unlock the full Porter’s Five Forces Analysis for force-by-force ratings, visuals, and actionable recommendations. Get the complete report to inform smarter investment and strategic decisions.
Suppliers Bargaining Power

Reliance on core tech platforms
REA relies on cloud infrastructure (AWS ~32%, Microsoft ~23%, Google ~11% in 2024), app stores that together control >90% of mobile distribution, mapping APIs and analytics tools concentrated among a few global vendors, giving suppliers leverage on pricing, terms and integration priorities. Switching costs are meaningful due to product dependencies and UX impact; long-term contracts and multi-vendor strategies mitigate but do not eliminate this power.
Unique property data sources
Government land registries, geospatial providers and proprietary valuation/demographic datasets are differentiated inputs; ATTOM, for example, reported coverage of about 155 million U.S. properties in 2024, illustrating supplier concentration. Where access is regulated or exclusive, suppliers can set pricing and licensing limits, and loss or degradation of feeds would harm product quality and monetization. Diversifying data pipelines and investing in first-party datasets reduces supplier leverage and operational risk.

Content creators and media production
Content creators for photography, floorplans, 3D tours and copywriting drive listing quality; in 2024 market fragmentation keeps individual supplier power low, though premium providers face capacity constraints during peak seasons. Bundled vendor marketplaces lower unit costs but create soft dependence on preferred partners. Variance in asset quality directly alters engagement and conversion rates, increasing platform risk.

Financial services partners
- Concentration: Big 4 ~80% mortgages (2024)
- Revenue leverage: platform referral fees often double‑digit
- Cost: compliance raises integration spend
- Mitigation: multi‑lender panels, in‑house broking
Ad tech and measurement ecosystems
Third-party ad servers, identity graphs and attribution partners remain critical for premium ad products, and 2024 privacy shifts and ID deprecation amplified the bargaining power of key measurement suppliers as walled gardens (Google, Meta, Amazon) accounted for ~65% of US digital ad spend in 2024.
- Integration depth increases switching costs and roadmap coupling
- Privacy changes elevated supplier leverage in 2024
- Growing first-party data and in-house measurement are gradually reducing external dependence
Concentrated cloud, app store and data suppliers increase pricing power; multi-vendor reduces risk
REA relies on concentrated cloud (AWS 32%, Microsoft 23%, Google 11% in 2024), app stores >90% mobile distribution and specialist mapping/analytics, creating pricing and integration leverage for suppliers. Land/data providers (ATTOM ~155M US properties 2024) and Big Four banks ~80% home loans (Australia 2024) further increase supplier power. Mitigants—multi‑vendor, first‑party data, in‑house broking—reduce but do not remove risk.
| Supplier type | 2024 metric | Impact |
|---|---|---|
| Cloud | AWS 32%/MS 23%/GCP 11% | High pricing/integration leverage |
| App stores | >90% mobile distrib. | Control over access/terms |
| Data providers | ATTOM 155M US props | Licensing dependency |
| Banks | Big4 ~80% home loans AU | Referral/rev share power |
| Ad walled gardens | ~65% US ad spend | Measurement leverage |
What is included in the product
 Detailed Word Document
Tailored Porter's Five Forces analysis for REA that uncovers key competitive drivers, evaluates supplier and buyer power, identifies substitutes and entry barriers, and highlights disruptive threats—delivering strategic insights to inform investor materials, strategy decks, or academic work.

 Customizable Excel Spreadsheet
REA Porter's Five Forces delivers a clear one-sheet summary with customizable pressure levels and an instant spider chart—simplifying competitive analysis into a deck-ready visual non-finance users can tweak and integrate into reports.
Customers Bargaining Power

Real estate agencies and developers
Paying customers — real estate agencies and developers — drive REA’s listings and premium placement revenue, contributing to REA Group’s FY24 revenue of about AU$1.3 billion and its market-leading reach of roughly 12 million monthly users. These customers can multi-home across REA and rivals, enabling price comparison and bargaining, while large groups routinely negotiate volume discounts and bespoke packages. Strong network effects and audience scale temper buyer power but do not eliminate persistent price sensitivity among advertisers.
National advertisers and brands
National auto, finance, and home-services advertisers often buy premium inventory and sponsorships with CPMs cited in 2024 industry reports around $30–60 for CTV/premium display, giving them scale-driven leverage over rates, targeting and measurement demands. Their sizable budgets enable tough negotiations on guarantees and attribution. Robust alternatives across social, search and direct CTV buys create credible outside options. REA’s unique intent audience lowers but does not eliminate this bargaining power.

Consumers (traffic and leads)
End-users don’t pay, but their engagement—measured by sessions and leads—is the scarce commodity agencies buy; mobile accounted for ~56% of global web traffic in 2024, underscoring reach. Consumers can switch portals/apps with low friction, raising churn risk. Superior UX, coverage and tools cut churn and reduce buyer leverage. Rapid shifts in search patterns quickly alter ad yield and conversion-based monetization.

Price transparency and ROI focus
Agencies now track lead volume, quality and time-to-let/sell and push for ROI-based pricing, increasing negotiation intensity as 2024 surveys show >60% of firms prioritise measurable ROI; transparent metrics lead to greater scrutiny of upsells and fees, while tiered bundles face pushback in softer markets. Demonstrable performance and analytics (conversion rates, time-to-transaction) are decisive in moderating buyer power.
- Metrics tracked: lead volume, quality, time-to-let/sell
- Buyer demand: ROI-first (>60% of agencies in 2024)
- Upsell scrutiny: higher with transparent KPIs
- Bundling risk: resisted in soft markets
- Defense: clear performance dashboards and conversion analytics
Contract structures and churn risk
- Renegotiation rhythm: monthly vs annual
- Demand sensitivity: downgrades in downturns
- Lock-in: CRM, data, branding
- Pricing levers: retention incentives, outcome-based
Scale vs ROI pressure: AU$1.3b, ~12M users, mobile 56%
Customers (agencies, developers, national advertisers) exert moderate bargaining power: REA Group FY24 revenue ~AU$1.3b and ~12M monthly users give scale, but multi-homing, ROI-first buying (>60% agencies in 2024), mobile ~56% traffic (2024) and premium CPMs ~$30–60 keep pressure on pricing and guarantees.
| Metric | 2024 |
|---|---|
| Revenue | AU$1.3b |
| Monthly users | ~12M |
| ROI-first agencies | >60% |
| Mobile share | 56% |
| Premium CPMs | $30–60 |
Same Document Delivered
REA Porter's Five Forces Analysis
This preview shows the exact REA Porter's Five Forces Analysis you'll receive immediately after purchase—no placeholders or samples. The full document is professionally written, fully formatted, and ready for download and use the moment you buy. You're viewing the final deliverable, so once payment is complete you'll have instant access to this exact file.

Don't Miss the Bigger Picture
REA’s Porter’s Five Forces snapshot highlights buyer power, supplier leverage, substitute threats, competitive rivalry, and entry barriers shaping its market position. It reveals key pressure points and strategic levers impacting margins and growth. This brief preview only scratches the surface—unlock the full Porter’s Five Forces Analysis for force-by-force ratings, visuals, and actionable recommendations. Get the complete report to inform smarter investment and strategic decisions.
Suppliers Bargaining Power
Reliance on core tech platforms
REA relies on cloud infrastructure (AWS ~32%, Microsoft ~23%, Google ~11% in 2024), app stores that together control >90% of mobile distribution, mapping APIs and analytics tools concentrated among a few global vendors, giving suppliers leverage on pricing, terms and integration priorities. Switching costs are meaningful due to product dependencies and UX impact; long-term contracts and multi-vendor strategies mitigate but do not eliminate this power.
Unique property data sources
Government land registries, geospatial providers and proprietary valuation/demographic datasets are differentiated inputs; ATTOM, for example, reported coverage of about 155 million U.S. properties in 2024, illustrating supplier concentration. Where access is regulated or exclusive, suppliers can set pricing and licensing limits, and loss or degradation of feeds would harm product quality and monetization. Diversifying data pipelines and investing in first-party datasets reduces supplier leverage and operational risk.
Content creators and media production
Content creators for photography, floorplans, 3D tours and copywriting drive listing quality; in 2024 market fragmentation keeps individual supplier power low, though premium providers face capacity constraints during peak seasons. Bundled vendor marketplaces lower unit costs but create soft dependence on preferred partners. Variance in asset quality directly alters engagement and conversion rates, increasing platform risk.
Financial services partners
- Concentration: Big 4 ~80% mortgages (2024)
- Revenue leverage: platform referral fees often double‑digit
- Cost: compliance raises integration spend
- Mitigation: multi‑lender panels, in‑house broking
Ad tech and measurement ecosystems
Third-party ad servers, identity graphs and attribution partners remain critical for premium ad products, and 2024 privacy shifts and ID deprecation amplified the bargaining power of key measurement suppliers as walled gardens (Google, Meta, Amazon) accounted for ~65% of US digital ad spend in 2024.
- Integration depth increases switching costs and roadmap coupling
- Privacy changes elevated supplier leverage in 2024
- Growing first-party data and in-house measurement are gradually reducing external dependence
Concentrated cloud, app store and data suppliers increase pricing power; multi-vendor reduces risk
REA relies on concentrated cloud (AWS 32%, Microsoft 23%, Google 11% in 2024), app stores >90% mobile distribution and specialist mapping/analytics, creating pricing and integration leverage for suppliers. Land/data providers (ATTOM ~155M US properties 2024) and Big Four banks ~80% home loans (Australia 2024) further increase supplier power. Mitigants—multi‑vendor, first‑party data, in‑house broking—reduce but do not remove risk.
| Supplier type | 2024 metric | Impact |
|---|---|---|
| Cloud | AWS 32%/MS 23%/GCP 11% | High pricing/integration leverage |
| App stores | >90% mobile distrib. | Control over access/terms |
| Data providers | ATTOM 155M US props | Licensing dependency |
| Banks | Big4 ~80% home loans AU | Referral/rev share power |
| Ad walled gardens | ~65% US ad spend | Measurement leverage |
What is included in the product
Detailed Word Document
Tailored Porter's Five Forces analysis for REA that uncovers key competitive drivers, evaluates supplier and buyer power, identifies substitutes and entry barriers, and highlights disruptive threats—delivering strategic insights to inform investor materials, strategy decks, or academic work.
Customizable Excel Spreadsheet
REA Porter's Five Forces delivers a clear one-sheet summary with customizable pressure levels and an instant spider chart—simplifying competitive analysis into a deck-ready visual non-finance users can tweak and integrate into reports.
Customers Bargaining Power
Real estate agencies and developers
Paying customers — real estate agencies and developers — drive REA’s listings and premium placement revenue, contributing to REA Group’s FY24 revenue of about AU$1.3 billion and its market-leading reach of roughly 12 million monthly users. These customers can multi-home across REA and rivals, enabling price comparison and bargaining, while large groups routinely negotiate volume discounts and bespoke packages. Strong network effects and audience scale temper buyer power but do not eliminate persistent price sensitivity among advertisers.
National advertisers and brands
National auto, finance, and home-services advertisers often buy premium inventory and sponsorships with CPMs cited in 2024 industry reports around $30–60 for CTV/premium display, giving them scale-driven leverage over rates, targeting and measurement demands. Their sizable budgets enable tough negotiations on guarantees and attribution. Robust alternatives across social, search and direct CTV buys create credible outside options. REA’s unique intent audience lowers but does not eliminate this bargaining power.
Consumers (traffic and leads)
End-users don’t pay, but their engagement—measured by sessions and leads—is the scarce commodity agencies buy; mobile accounted for ~56% of global web traffic in 2024, underscoring reach. Consumers can switch portals/apps with low friction, raising churn risk. Superior UX, coverage and tools cut churn and reduce buyer leverage. Rapid shifts in search patterns quickly alter ad yield and conversion-based monetization.
Price transparency and ROI focus
Agencies now track lead volume, quality and time-to-let/sell and push for ROI-based pricing, increasing negotiation intensity as 2024 surveys show >60% of firms prioritise measurable ROI; transparent metrics lead to greater scrutiny of upsells and fees, while tiered bundles face pushback in softer markets. Demonstrable performance and analytics (conversion rates, time-to-transaction) are decisive in moderating buyer power.
- Metrics tracked: lead volume, quality, time-to-let/sell
- Buyer demand: ROI-first (>60% of agencies in 2024)
- Upsell scrutiny: higher with transparent KPIs
- Bundling risk: resisted in soft markets
- Defense: clear performance dashboards and conversion analytics
Contract structures and churn risk
- Renegotiation rhythm: monthly vs annual
- Demand sensitivity: downgrades in downturns
- Lock-in: CRM, data, branding
- Pricing levers: retention incentives, outcome-based
Scale vs ROI pressure: AU$1.3b, ~12M users, mobile 56%
Customers (agencies, developers, national advertisers) exert moderate bargaining power: REA Group FY24 revenue ~AU$1.3b and ~12M monthly users give scale, but multi-homing, ROI-first buying (>60% agencies in 2024), mobile ~56% traffic (2024) and premium CPMs ~$30–60 keep pressure on pricing and guarantees.
| Metric | 2024 |
|---|---|
| Revenue | AU$1.3b |
| Monthly users | ~12M |
| ROI-first agencies | >60% |
| Mobile share | 56% |
| Premium CPMs | $30–60 |
Same Document Delivered
REA Porter's Five Forces Analysis
This preview shows the exact REA Porter's Five Forces Analysis you'll receive immediately after purchase—no placeholders or samples. The full document is professionally written, fully formatted, and ready for download and use the moment you buy. You're viewing the final deliverable, so once payment is complete you'll have instant access to this exact file.
Description
Don't Miss the Bigger Picture
REA’s Porter’s Five Forces snapshot highlights buyer power, supplier leverage, substitute threats, competitive rivalry, and entry barriers shaping its market position. It reveals key pressure points and strategic levers impacting margins and growth. This brief preview only scratches the surface—unlock the full Porter’s Five Forces Analysis for force-by-force ratings, visuals, and actionable recommendations. Get the complete report to inform smarter investment and strategic decisions.
Suppliers Bargaining Power
Reliance on core tech platforms
REA relies on cloud infrastructure (AWS ~32%, Microsoft ~23%, Google ~11% in 2024), app stores that together control >90% of mobile distribution, mapping APIs and analytics tools concentrated among a few global vendors, giving suppliers leverage on pricing, terms and integration priorities. Switching costs are meaningful due to product dependencies and UX impact; long-term contracts and multi-vendor strategies mitigate but do not eliminate this power.
Unique property data sources
Government land registries, geospatial providers and proprietary valuation/demographic datasets are differentiated inputs; ATTOM, for example, reported coverage of about 155 million U.S. properties in 2024, illustrating supplier concentration. Where access is regulated or exclusive, suppliers can set pricing and licensing limits, and loss or degradation of feeds would harm product quality and monetization. Diversifying data pipelines and investing in first-party datasets reduces supplier leverage and operational risk.
Content creators and media production
Content creators for photography, floorplans, 3D tours and copywriting drive listing quality; in 2024 market fragmentation keeps individual supplier power low, though premium providers face capacity constraints during peak seasons. Bundled vendor marketplaces lower unit costs but create soft dependence on preferred partners. Variance in asset quality directly alters engagement and conversion rates, increasing platform risk.
Financial services partners
- Concentration: Big 4 ~80% mortgages (2024)
- Revenue leverage: platform referral fees often double‑digit
- Cost: compliance raises integration spend
- Mitigation: multi‑lender panels, in‑house broking
Ad tech and measurement ecosystems
Third-party ad servers, identity graphs and attribution partners remain critical for premium ad products, and 2024 privacy shifts and ID deprecation amplified the bargaining power of key measurement suppliers as walled gardens (Google, Meta, Amazon) accounted for ~65% of US digital ad spend in 2024.
- Integration depth increases switching costs and roadmap coupling
- Privacy changes elevated supplier leverage in 2024
- Growing first-party data and in-house measurement are gradually reducing external dependence
Concentrated cloud, app store and data suppliers increase pricing power; multi-vendor reduces risk
REA relies on concentrated cloud (AWS 32%, Microsoft 23%, Google 11% in 2024), app stores >90% mobile distribution and specialist mapping/analytics, creating pricing and integration leverage for suppliers. Land/data providers (ATTOM ~155M US properties 2024) and Big Four banks ~80% home loans (Australia 2024) further increase supplier power. Mitigants—multi‑vendor, first‑party data, in‑house broking—reduce but do not remove risk.
| Supplier type | 2024 metric | Impact |
|---|---|---|
| Cloud | AWS 32%/MS 23%/GCP 11% | High pricing/integration leverage |
| App stores | >90% mobile distrib. | Control over access/terms |
| Data providers | ATTOM 155M US props | Licensing dependency |
| Banks | Big4 ~80% home loans AU | Referral/rev share power |
| Ad walled gardens | ~65% US ad spend | Measurement leverage |
What is included in the product
Detailed Word Document
Tailored Porter's Five Forces analysis for REA that uncovers key competitive drivers, evaluates supplier and buyer power, identifies substitutes and entry barriers, and highlights disruptive threats—delivering strategic insights to inform investor materials, strategy decks, or academic work.
Customizable Excel Spreadsheet
REA Porter's Five Forces delivers a clear one-sheet summary with customizable pressure levels and an instant spider chart—simplifying competitive analysis into a deck-ready visual non-finance users can tweak and integrate into reports.
Customers Bargaining Power
Real estate agencies and developers
Paying customers — real estate agencies and developers — drive REA’s listings and premium placement revenue, contributing to REA Group’s FY24 revenue of about AU$1.3 billion and its market-leading reach of roughly 12 million monthly users. These customers can multi-home across REA and rivals, enabling price comparison and bargaining, while large groups routinely negotiate volume discounts and bespoke packages. Strong network effects and audience scale temper buyer power but do not eliminate persistent price sensitivity among advertisers.
National advertisers and brands
National auto, finance, and home-services advertisers often buy premium inventory and sponsorships with CPMs cited in 2024 industry reports around $30–60 for CTV/premium display, giving them scale-driven leverage over rates, targeting and measurement demands. Their sizable budgets enable tough negotiations on guarantees and attribution. Robust alternatives across social, search and direct CTV buys create credible outside options. REA’s unique intent audience lowers but does not eliminate this bargaining power.
Consumers (traffic and leads)
End-users don’t pay, but their engagement—measured by sessions and leads—is the scarce commodity agencies buy; mobile accounted for ~56% of global web traffic in 2024, underscoring reach. Consumers can switch portals/apps with low friction, raising churn risk. Superior UX, coverage and tools cut churn and reduce buyer leverage. Rapid shifts in search patterns quickly alter ad yield and conversion-based monetization.
Price transparency and ROI focus
Agencies now track lead volume, quality and time-to-let/sell and push for ROI-based pricing, increasing negotiation intensity as 2024 surveys show >60% of firms prioritise measurable ROI; transparent metrics lead to greater scrutiny of upsells and fees, while tiered bundles face pushback in softer markets. Demonstrable performance and analytics (conversion rates, time-to-transaction) are decisive in moderating buyer power.
- Metrics tracked: lead volume, quality, time-to-let/sell
- Buyer demand: ROI-first (>60% of agencies in 2024)
- Upsell scrutiny: higher with transparent KPIs
- Bundling risk: resisted in soft markets
- Defense: clear performance dashboards and conversion analytics
Contract structures and churn risk
- Renegotiation rhythm: monthly vs annual
- Demand sensitivity: downgrades in downturns
- Lock-in: CRM, data, branding
- Pricing levers: retention incentives, outcome-based
Scale vs ROI pressure: AU$1.3b, ~12M users, mobile 56%
Customers (agencies, developers, national advertisers) exert moderate bargaining power: REA Group FY24 revenue ~AU$1.3b and ~12M monthly users give scale, but multi-homing, ROI-first buying (>60% agencies in 2024), mobile ~56% traffic (2024) and premium CPMs ~$30–60 keep pressure on pricing and guarantees.
| Metric | 2024 |
|---|---|
| Revenue | AU$1.3b |
| Monthly users | ~12M |
| ROI-first agencies | >60% |
| Mobile share | 56% |
| Premium CPMs | $30–60 |
Same Document Delivered
REA Porter's Five Forces Analysis
This preview shows the exact REA Porter's Five Forces Analysis you'll receive immediately after purchase—no placeholders or samples. The full document is professionally written, fully formatted, and ready for download and use the moment you buy. You're viewing the final deliverable, so once payment is complete you'll have instant access to this exact file.











