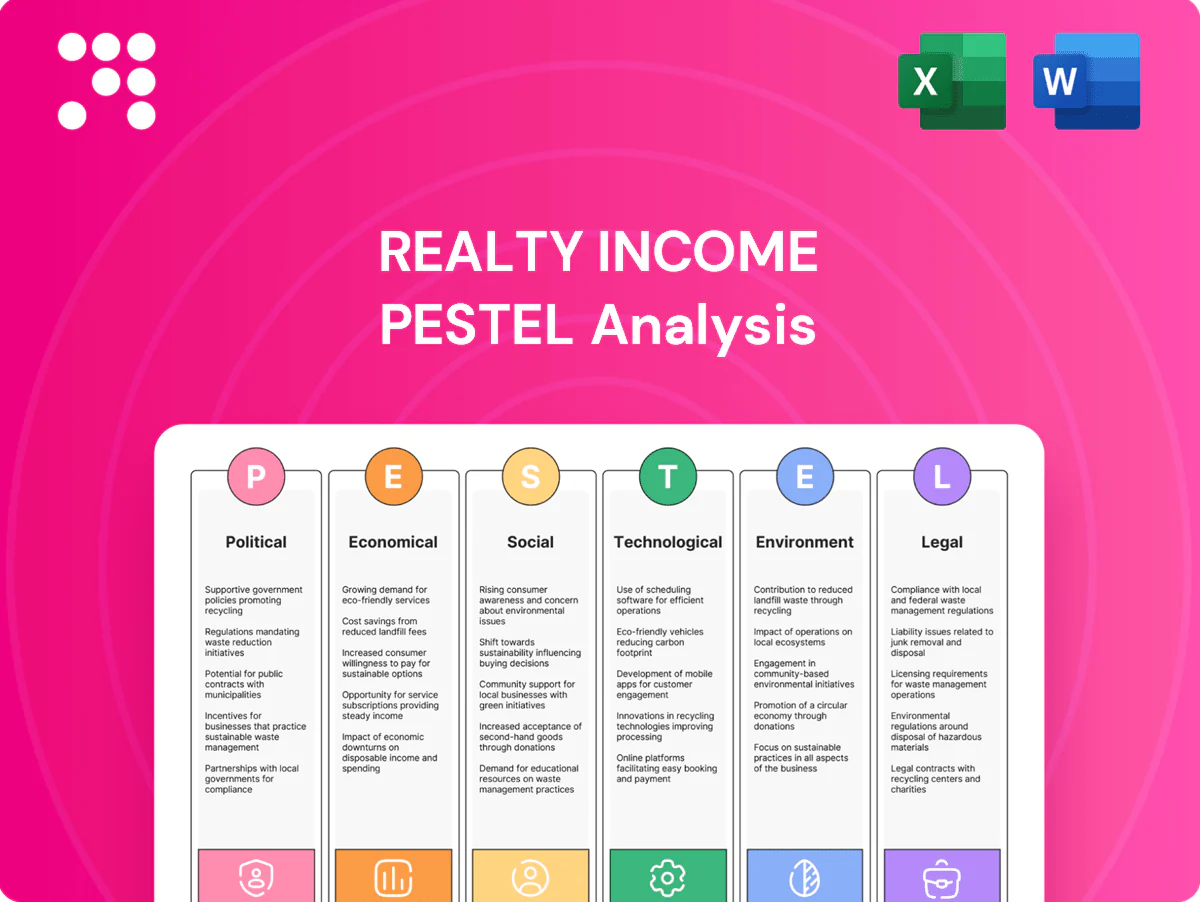
Realty Income PESTLE Analysis

Plan Smarter. Present Sharper. Compete Stronger.
Discover how political, economic, social, technological, legal, and environmental forces are shaping Realty Income’s outlook in our concise PESTLE snapshot—perfect for investors and strategists. Gain forward-looking insights to anticipate risks and spot growth levers. Purchase the full PESTLE for a complete, actionable briefing you can use immediately.
Political factors

Zoning and land-use stability
Local and regional zoning decisions determine permissible uses for single-tenant assets and affect Realty Income's ~11,000+ property portfolio reported in 2024. Stable, predictable regimes support long-term net leases and reduce re-tenanting friction by preserving income streams. Sudden political shifts or community pushback can delay redevelopment or restrict tenant categories, so monitoring municipal planning agendas helps pre-empt entitlement risk.
Tax policy and REIT status
REIT tax pass-through treatment underpins Realty Income’s total-return model by avoiding corporate-level tax and preserving cash flow for dividends. The current federal corporate tax rate is 21%, and the SALT cap remains $10,000, both factors that shape tenant net-lease burdens and landlord underwriting. Changes to corporate, property, or state franchise taxes could compress cash yields and acquisition returns. Realty Income engages with trade groups such as Nareit to defend favorable tax positioning.

Incentives and development subsidies
Economic development grants and tax credits can bolster tenant covenant strength and site economics, with Realty Income (NYSE: O) owning roughly 11,400 properties that benefit from improved occupancy metrics. Political appetites for retail versus industrial incentives shift with employment priorities, influencing local subsidy flows and absorption near logistics corridors. Targeted subsidies can lift acquisition yields—industrial cap-rate spreads to retail widened in 2024—while clawback clauses and turnover increase compliance complexity.

Trade and geopolitical exposure
Trade tensions squeeze retailers’ margins and disrupt supply chains, which can reduce tenants’ rent coverage; Realty Income reported portfolio occupancy near 97% in 2024, highlighting resilience but not immunity to margin pressure.
Geopolitical shocks compress consumer confidence and can delay tenant expansion or renewal decisions, slowing leasing velocity and organic rent growth.
Industrial tenants exposed to imports/exports face throughput volatility; diversifying across tenant industries and geographies mitigates policy-driven shocks.
- Trade tensions → lower rent coverage
- Geopolitical shocks → delayed expansions
- Industrial throughput volatility
- Diversification = risk mitigation
Public infrastructure investment
Government spending under the 2021 Bipartisan Infrastructure Law totals about 1.2 trillion dollars, including roughly 550 billion dollars of new federal investment and a 42.45 billion dollar BEAD broadband program, lifting footfall and logistics efficiency for retail and industrial assets near upgraded roads, ports and broadband corridors.
Locations adjacent to upgraded corridors show stronger tenant desirability and renewal prospects, while deferred infrastructure can accelerate obsolescence; tracking federal, state and local capital plans is essential to refine market selection and rent-growth assumptions.
- IIJA: 1.2 trillion total; 550 billion new
- BEAD broadband: 42.45 billion
- Upgraded corridors: higher tenant demand & renewals
- Deferred projects: faster retail corridor obsolescence
- Action: track capital plans to model rent growth
Zoning stability backs net leases; ~97% / ~11,400 occupancy
Local zoning and political stability preserve long-term net leases across Realty Income’s ~11,400 properties and supported ~97% occupancy in 2024. REIT tax pass-through and 21% federal rate plus $10,000 SALT cap sustain dividend cash flow but remain policy risks. Infrastructure spending (IIJA $1.2T; $550B new; BEAD $42.45B) boosts corridor demand; trade tensions and geopolitical shocks can still pressure tenant cashflows.
| Metric | Value |
|---|---|
| Properties (2024) | ~11,400 |
| Occupancy (2024) | ~97% |
| Federal corp tax | 21% |
| IIJA total / new | $1.2T / $550B |
| BEAD | $42.45B |
What is included in the product
 Detailed Word Document
Explores how macro-environmental factors uniquely affect Realty Income across Political, Economic, Social, Technological, Environmental, and Legal dimensions, with data-backed trends and region-specific regulatory context. Designed for executives and investors, it highlights forward-looking risks, opportunities, and actionable implications for strategy and capital planning.

 Customizable Excel Spreadsheet
A concise, visually segmented PESTLE summary for Realty Income that relieves briefing pain points by enabling quick interpretation, easy sharing across teams, and seamless insertion into presentations or planning materials.
Economic factors

Interest rates and cost of capital
With the federal funds target at 5.25–5.50% (mid‑2025), cap rates and acquisition spreads are tightly tied to benchmark rates and credit spreads; rising rates have narrowed investment spreads and weighed on external growth. Realty Income reports a majority of fixed‑rate debt with staggered maturities to buffer FFO volatility. Continued access to low‑cost equity and unsecured debt markets remains a key competitive moat for financing acquisitions.
Consumer spending cycles
Net-lease retail cash flows for Realty Income closely track discretionary spending and employment; with US unemployment near 4.0% in mid‑2025, consumer demand volatility directly affects rent collections and same‑store sales.
Defensive categories such as grocery, dollar stores and pharmacies—which make up a significant share of Realty Income’s portfolio—help cushion downturns by maintaining stable traffic and sales.
Deep recessions raise tenant default risk and extend re‑letting downtime, pressuring cash flow and valuation.
Lease underwriting should therefore stress test rent coverage across multiple cycles, targeting stronger coverage ratios and longer initial lease terms to mitigate cyclical risk.

Inflation and lease escalators
US CPI rose about 3.4% year-over-year as of May 2025, and for Realty Income real rent growth hinges on CPI-linkage versus fixed-step escalators. Elevated inflation can boost same-store NOI if indexed escalators track CPI, but tenants facing cost pressure may demand concessions at renewal. Maintaining a balanced mix of CPI-linked and fixed bumps helps preserve portfolio purchasing power.

Property market liquidity and cap rates
Competition from private equity and sovereign capital, with roughly $300B of real estate dry powder in 2024, has bid up pricing and pressured cap rates, which have risen about 200 basis points from 2021–24; wider bid-ask spreads and a ~30% drop in transaction velocity during 2023–24 slowed liquidity. Disciplined underwriting and off-market sourcing help Realty Income protect yields, while targeted dispositions recycle low-growth assets into higher-return opportunities.
- Private equity/sovereign dry powder ~ $300B (2024)
- Cap rates +200 bps since 2021
- Transaction velocity down ~30% (2023–24)
- Off-market sourcing and dispositions preserve yields
Tenant credit health
Tenant credit health is central for Realty Income given its single-tenant focus, concentrating risk in tenant covenant quality; monitoring tenant leverage, unit economics and 2024–2025 sector trends (retail, healthcare, industrial) is crucial to stress-testing cash flows. Master leases and parent guarantees materially improve recovery outcomes and lower effective default loss in portfolio scenarios.
- Diversify by industry, brand, geography to reduce correlation
- Track tenant leverage and EBITDAR margins quarterly
- Prefer master leases/guarantees to enhance recovery
Zoning stability backs net leases; ~97% / ~11,400 occupancy
With the fed funds target at 5.25–5.50% (mid‑2025) rising rates have narrowed acquisition spreads and slowed external growth. Unemployment ~4.0% (mid‑2025) and CPI ~3.4% (May 2025) drive rent collections and indexed NOI; defensive tenants cushion downside. Competition with ~$300B dry powder (2024) lifted pricing; disciplined underwriting and off‑market sourcing preserve yields.
| Metric | Value |
|---|---|
| Fed funds | 5.25–5.50% |
| Unemployment | ~4.0% |
| CPI (May 2025) | 3.4% YoY |
| Dry powder (2024) | $300B |
What You See Is What You Get
Realty Income PESTLE Analysis
This Realty Income PESTLE Analysis provides concise political, economic, social, technological, legal, and environmental insights tailored to the REIT sector. It includes actionable implications for investment and portfolio strategy. The preview shown here is the exact document you’ll receive after purchase—fully formatted and ready to use.

Plan Smarter. Present Sharper. Compete Stronger.
Discover how political, economic, social, technological, legal, and environmental forces are shaping Realty Income’s outlook in our concise PESTLE snapshot—perfect for investors and strategists. Gain forward-looking insights to anticipate risks and spot growth levers. Purchase the full PESTLE for a complete, actionable briefing you can use immediately.
Political factors
Zoning and land-use stability
Local and regional zoning decisions determine permissible uses for single-tenant assets and affect Realty Income's ~11,000+ property portfolio reported in 2024. Stable, predictable regimes support long-term net leases and reduce re-tenanting friction by preserving income streams. Sudden political shifts or community pushback can delay redevelopment or restrict tenant categories, so monitoring municipal planning agendas helps pre-empt entitlement risk.
Tax policy and REIT status
REIT tax pass-through treatment underpins Realty Income’s total-return model by avoiding corporate-level tax and preserving cash flow for dividends. The current federal corporate tax rate is 21%, and the SALT cap remains $10,000, both factors that shape tenant net-lease burdens and landlord underwriting. Changes to corporate, property, or state franchise taxes could compress cash yields and acquisition returns. Realty Income engages with trade groups such as Nareit to defend favorable tax positioning.
Incentives and development subsidies
Economic development grants and tax credits can bolster tenant covenant strength and site economics, with Realty Income (NYSE: O) owning roughly 11,400 properties that benefit from improved occupancy metrics. Political appetites for retail versus industrial incentives shift with employment priorities, influencing local subsidy flows and absorption near logistics corridors. Targeted subsidies can lift acquisition yields—industrial cap-rate spreads to retail widened in 2024—while clawback clauses and turnover increase compliance complexity.
Trade and geopolitical exposure
Trade tensions squeeze retailers’ margins and disrupt supply chains, which can reduce tenants’ rent coverage; Realty Income reported portfolio occupancy near 97% in 2024, highlighting resilience but not immunity to margin pressure.
Geopolitical shocks compress consumer confidence and can delay tenant expansion or renewal decisions, slowing leasing velocity and organic rent growth.
Industrial tenants exposed to imports/exports face throughput volatility; diversifying across tenant industries and geographies mitigates policy-driven shocks.
- Trade tensions → lower rent coverage
- Geopolitical shocks → delayed expansions
- Industrial throughput volatility
- Diversification = risk mitigation
Public infrastructure investment
Government spending under the 2021 Bipartisan Infrastructure Law totals about 1.2 trillion dollars, including roughly 550 billion dollars of new federal investment and a 42.45 billion dollar BEAD broadband program, lifting footfall and logistics efficiency for retail and industrial assets near upgraded roads, ports and broadband corridors.
Locations adjacent to upgraded corridors show stronger tenant desirability and renewal prospects, while deferred infrastructure can accelerate obsolescence; tracking federal, state and local capital plans is essential to refine market selection and rent-growth assumptions.
- IIJA: 1.2 trillion total; 550 billion new
- BEAD broadband: 42.45 billion
- Upgraded corridors: higher tenant demand & renewals
- Deferred projects: faster retail corridor obsolescence
- Action: track capital plans to model rent growth
Zoning stability backs net leases; ~97% / ~11,400 occupancy
Local zoning and political stability preserve long-term net leases across Realty Income’s ~11,400 properties and supported ~97% occupancy in 2024. REIT tax pass-through and 21% federal rate plus $10,000 SALT cap sustain dividend cash flow but remain policy risks. Infrastructure spending (IIJA $1.2T; $550B new; BEAD $42.45B) boosts corridor demand; trade tensions and geopolitical shocks can still pressure tenant cashflows.
| Metric | Value |
|---|---|
| Properties (2024) | ~11,400 |
| Occupancy (2024) | ~97% |
| Federal corp tax | 21% |
| IIJA total / new | $1.2T / $550B |
| BEAD | $42.45B |
What is included in the product
Detailed Word Document
Explores how macro-environmental factors uniquely affect Realty Income across Political, Economic, Social, Technological, Environmental, and Legal dimensions, with data-backed trends and region-specific regulatory context. Designed for executives and investors, it highlights forward-looking risks, opportunities, and actionable implications for strategy and capital planning.
Customizable Excel Spreadsheet
A concise, visually segmented PESTLE summary for Realty Income that relieves briefing pain points by enabling quick interpretation, easy sharing across teams, and seamless insertion into presentations or planning materials.
Economic factors
Interest rates and cost of capital
With the federal funds target at 5.25–5.50% (mid‑2025), cap rates and acquisition spreads are tightly tied to benchmark rates and credit spreads; rising rates have narrowed investment spreads and weighed on external growth. Realty Income reports a majority of fixed‑rate debt with staggered maturities to buffer FFO volatility. Continued access to low‑cost equity and unsecured debt markets remains a key competitive moat for financing acquisitions.
Consumer spending cycles
Net-lease retail cash flows for Realty Income closely track discretionary spending and employment; with US unemployment near 4.0% in mid‑2025, consumer demand volatility directly affects rent collections and same‑store sales.
Defensive categories such as grocery, dollar stores and pharmacies—which make up a significant share of Realty Income’s portfolio—help cushion downturns by maintaining stable traffic and sales.
Deep recessions raise tenant default risk and extend re‑letting downtime, pressuring cash flow and valuation.
Lease underwriting should therefore stress test rent coverage across multiple cycles, targeting stronger coverage ratios and longer initial lease terms to mitigate cyclical risk.
Inflation and lease escalators
US CPI rose about 3.4% year-over-year as of May 2025, and for Realty Income real rent growth hinges on CPI-linkage versus fixed-step escalators. Elevated inflation can boost same-store NOI if indexed escalators track CPI, but tenants facing cost pressure may demand concessions at renewal. Maintaining a balanced mix of CPI-linked and fixed bumps helps preserve portfolio purchasing power.
Property market liquidity and cap rates
Competition from private equity and sovereign capital, with roughly $300B of real estate dry powder in 2024, has bid up pricing and pressured cap rates, which have risen about 200 basis points from 2021–24; wider bid-ask spreads and a ~30% drop in transaction velocity during 2023–24 slowed liquidity. Disciplined underwriting and off-market sourcing help Realty Income protect yields, while targeted dispositions recycle low-growth assets into higher-return opportunities.
- Private equity/sovereign dry powder ~ $300B (2024)
- Cap rates +200 bps since 2021
- Transaction velocity down ~30% (2023–24)
- Off-market sourcing and dispositions preserve yields
Tenant credit health
Tenant credit health is central for Realty Income given its single-tenant focus, concentrating risk in tenant covenant quality; monitoring tenant leverage, unit economics and 2024–2025 sector trends (retail, healthcare, industrial) is crucial to stress-testing cash flows. Master leases and parent guarantees materially improve recovery outcomes and lower effective default loss in portfolio scenarios.
- Diversify by industry, brand, geography to reduce correlation
- Track tenant leverage and EBITDAR margins quarterly
- Prefer master leases/guarantees to enhance recovery
Zoning stability backs net leases; ~97% / ~11,400 occupancy
With the fed funds target at 5.25–5.50% (mid‑2025) rising rates have narrowed acquisition spreads and slowed external growth. Unemployment ~4.0% (mid‑2025) and CPI ~3.4% (May 2025) drive rent collections and indexed NOI; defensive tenants cushion downside. Competition with ~$300B dry powder (2024) lifted pricing; disciplined underwriting and off‑market sourcing preserve yields.
| Metric | Value |
|---|---|
| Fed funds | 5.25–5.50% |
| Unemployment | ~4.0% |
| CPI (May 2025) | 3.4% YoY |
| Dry powder (2024) | $300B |
What You See Is What You Get
Realty Income PESTLE Analysis
This Realty Income PESTLE Analysis provides concise political, economic, social, technological, legal, and environmental insights tailored to the REIT sector. It includes actionable implications for investment and portfolio strategy. The preview shown here is the exact document you’ll receive after purchase—fully formatted and ready to use.
Description
Plan Smarter. Present Sharper. Compete Stronger.
Discover how political, economic, social, technological, legal, and environmental forces are shaping Realty Income’s outlook in our concise PESTLE snapshot—perfect for investors and strategists. Gain forward-looking insights to anticipate risks and spot growth levers. Purchase the full PESTLE for a complete, actionable briefing you can use immediately.
Political factors
Zoning and land-use stability
Local and regional zoning decisions determine permissible uses for single-tenant assets and affect Realty Income's ~11,000+ property portfolio reported in 2024. Stable, predictable regimes support long-term net leases and reduce re-tenanting friction by preserving income streams. Sudden political shifts or community pushback can delay redevelopment or restrict tenant categories, so monitoring municipal planning agendas helps pre-empt entitlement risk.
Tax policy and REIT status
REIT tax pass-through treatment underpins Realty Income’s total-return model by avoiding corporate-level tax and preserving cash flow for dividends. The current federal corporate tax rate is 21%, and the SALT cap remains $10,000, both factors that shape tenant net-lease burdens and landlord underwriting. Changes to corporate, property, or state franchise taxes could compress cash yields and acquisition returns. Realty Income engages with trade groups such as Nareit to defend favorable tax positioning.
Incentives and development subsidies
Economic development grants and tax credits can bolster tenant covenant strength and site economics, with Realty Income (NYSE: O) owning roughly 11,400 properties that benefit from improved occupancy metrics. Political appetites for retail versus industrial incentives shift with employment priorities, influencing local subsidy flows and absorption near logistics corridors. Targeted subsidies can lift acquisition yields—industrial cap-rate spreads to retail widened in 2024—while clawback clauses and turnover increase compliance complexity.
Trade and geopolitical exposure
Trade tensions squeeze retailers’ margins and disrupt supply chains, which can reduce tenants’ rent coverage; Realty Income reported portfolio occupancy near 97% in 2024, highlighting resilience but not immunity to margin pressure.
Geopolitical shocks compress consumer confidence and can delay tenant expansion or renewal decisions, slowing leasing velocity and organic rent growth.
Industrial tenants exposed to imports/exports face throughput volatility; diversifying across tenant industries and geographies mitigates policy-driven shocks.
- Trade tensions → lower rent coverage
- Geopolitical shocks → delayed expansions
- Industrial throughput volatility
- Diversification = risk mitigation
Public infrastructure investment
Government spending under the 2021 Bipartisan Infrastructure Law totals about 1.2 trillion dollars, including roughly 550 billion dollars of new federal investment and a 42.45 billion dollar BEAD broadband program, lifting footfall and logistics efficiency for retail and industrial assets near upgraded roads, ports and broadband corridors.
Locations adjacent to upgraded corridors show stronger tenant desirability and renewal prospects, while deferred infrastructure can accelerate obsolescence; tracking federal, state and local capital plans is essential to refine market selection and rent-growth assumptions.
- IIJA: 1.2 trillion total; 550 billion new
- BEAD broadband: 42.45 billion
- Upgraded corridors: higher tenant demand & renewals
- Deferred projects: faster retail corridor obsolescence
- Action: track capital plans to model rent growth
Zoning stability backs net leases; ~97% / ~11,400 occupancy
Local zoning and political stability preserve long-term net leases across Realty Income’s ~11,400 properties and supported ~97% occupancy in 2024. REIT tax pass-through and 21% federal rate plus $10,000 SALT cap sustain dividend cash flow but remain policy risks. Infrastructure spending (IIJA $1.2T; $550B new; BEAD $42.45B) boosts corridor demand; trade tensions and geopolitical shocks can still pressure tenant cashflows.
| Metric | Value |
|---|---|
| Properties (2024) | ~11,400 |
| Occupancy (2024) | ~97% |
| Federal corp tax | 21% |
| IIJA total / new | $1.2T / $550B |
| BEAD | $42.45B |
What is included in the product
Detailed Word Document
Explores how macro-environmental factors uniquely affect Realty Income across Political, Economic, Social, Technological, Environmental, and Legal dimensions, with data-backed trends and region-specific regulatory context. Designed for executives and investors, it highlights forward-looking risks, opportunities, and actionable implications for strategy and capital planning.
Customizable Excel Spreadsheet
A concise, visually segmented PESTLE summary for Realty Income that relieves briefing pain points by enabling quick interpretation, easy sharing across teams, and seamless insertion into presentations or planning materials.
Economic factors
Interest rates and cost of capital
With the federal funds target at 5.25–5.50% (mid‑2025), cap rates and acquisition spreads are tightly tied to benchmark rates and credit spreads; rising rates have narrowed investment spreads and weighed on external growth. Realty Income reports a majority of fixed‑rate debt with staggered maturities to buffer FFO volatility. Continued access to low‑cost equity and unsecured debt markets remains a key competitive moat for financing acquisitions.
Consumer spending cycles
Net-lease retail cash flows for Realty Income closely track discretionary spending and employment; with US unemployment near 4.0% in mid‑2025, consumer demand volatility directly affects rent collections and same‑store sales.
Defensive categories such as grocery, dollar stores and pharmacies—which make up a significant share of Realty Income’s portfolio—help cushion downturns by maintaining stable traffic and sales.
Deep recessions raise tenant default risk and extend re‑letting downtime, pressuring cash flow and valuation.
Lease underwriting should therefore stress test rent coverage across multiple cycles, targeting stronger coverage ratios and longer initial lease terms to mitigate cyclical risk.
Inflation and lease escalators
US CPI rose about 3.4% year-over-year as of May 2025, and for Realty Income real rent growth hinges on CPI-linkage versus fixed-step escalators. Elevated inflation can boost same-store NOI if indexed escalators track CPI, but tenants facing cost pressure may demand concessions at renewal. Maintaining a balanced mix of CPI-linked and fixed bumps helps preserve portfolio purchasing power.
Property market liquidity and cap rates
Competition from private equity and sovereign capital, with roughly $300B of real estate dry powder in 2024, has bid up pricing and pressured cap rates, which have risen about 200 basis points from 2021–24; wider bid-ask spreads and a ~30% drop in transaction velocity during 2023–24 slowed liquidity. Disciplined underwriting and off-market sourcing help Realty Income protect yields, while targeted dispositions recycle low-growth assets into higher-return opportunities.
- Private equity/sovereign dry powder ~ $300B (2024)
- Cap rates +200 bps since 2021
- Transaction velocity down ~30% (2023–24)
- Off-market sourcing and dispositions preserve yields
Tenant credit health
Tenant credit health is central for Realty Income given its single-tenant focus, concentrating risk in tenant covenant quality; monitoring tenant leverage, unit economics and 2024–2025 sector trends (retail, healthcare, industrial) is crucial to stress-testing cash flows. Master leases and parent guarantees materially improve recovery outcomes and lower effective default loss in portfolio scenarios.
- Diversify by industry, brand, geography to reduce correlation
- Track tenant leverage and EBITDAR margins quarterly
- Prefer master leases/guarantees to enhance recovery
Zoning stability backs net leases; ~97% / ~11,400 occupancy
With the fed funds target at 5.25–5.50% (mid‑2025) rising rates have narrowed acquisition spreads and slowed external growth. Unemployment ~4.0% (mid‑2025) and CPI ~3.4% (May 2025) drive rent collections and indexed NOI; defensive tenants cushion downside. Competition with ~$300B dry powder (2024) lifted pricing; disciplined underwriting and off‑market sourcing preserve yields.
| Metric | Value |
|---|---|
| Fed funds | 5.25–5.50% |
| Unemployment | ~4.0% |
| CPI (May 2025) | 3.4% YoY |
| Dry powder (2024) | $300B |
What You See Is What You Get
Realty Income PESTLE Analysis
This Realty Income PESTLE Analysis provides concise political, economic, social, technological, legal, and environmental insights tailored to the REIT sector. It includes actionable implications for investment and portfolio strategy. The preview shown here is the exact document you’ll receive after purchase—fully formatted and ready to use.











